1 INTRODUCTION
1.1 Man-made disasters and the design role
Human errors or human-related factors have been regarded as significant contributors or even the trig-gering element of recent major accidents, according to a number of technical investigations designated to determine the causes of these adverse events. Fuku-shima in Japan and Macondo in the Gulf of Mexico are examples, to name but a few, of catastrophic events deeply associated with direct human actions or flawed decision-making processes leading to dev-astating consequences. Kurokawa et al (2012), for example, concluded that the 2011 nuclear accident in Japan was a man-made disaster, a term coined al-most 40 years ago by Turner (1978) to emphasise how information distortion generated by systems complexity can challenge risk prevention measures.
To describe the dynamics of accident causation, in his well-known “Swiss cheese” theory, Reason (1990) introduced the idea of a sequence of safety barriers (represented by cheese slices) with holes as an indication of flaws. Complex systems fail and ac-cidents occur when a combination of synchronized flaws in these barriers take place or, better saying, as
*National Agency for Petroleum, Natural Gas and Biofuels
(ANP), Brazil.
a result of the alignment of the holes in the Swiss cheese slices. He also associated these flaws/holes to slips, lapses, mistakes, violations (or active failures) and latent conditions (Reason, 1997). Thus, it is widely accepted that high-technology accidents are likely to occur under a complex interaction of multi-ple active failures and latent conditions. These latent conditions might have long incubation periods, im-plying that a number of design failures may be em-bedded in systems until combined with human errors and exposed in an accident sequence.
Previous data analysis (Moura et al, 2015a) using a proprietary dataset structured to capture human, technology and organisational features from indus-trial accidents (Multi-attribute Technological Acci-dents Dataset - MATA-D), found that more than 60% of the events in the dataset featured some sort of design failure, which can be considered to be the most frequent single contributory factor (or latent condition) to major accidents. Consequently, the de-tection and correction of design gaps in earlier stages of the facilities’ lifecycle, when the cost of correc-tions is significantly lower, would certainly reduce the likelihood of undesirable outcomes during the operational phase. However, traditional hazard iden-tification methods used in design such as Fault-trees or FMECAs (Failure Mode, Effects, and Criticality Analysis), in spite of being very successful in dis-closing undesirable conditions (Vesely et al, 1981),
Learning from accidents: analysis of multi-attribute events and
implications to improve design and reduce human errors
R. Moura
*, M. Beer, E. Patelli & J. Lewis
Institute for Risk and Uncertainty, University of Liverpool, United Kingdom
F. Knoll
NCK Inc., Montreal, Canada
have some limitations that might be preventing the recognition of multidimensional factors leading to a critical accident. These limitations can arise from their structure (one rigid/hierarchical, the other de-pendent on the accurate prediction of all failure modes) or from difficulties in encompassing simul-taneous failures involving humans and organisations. In fact, industrial accidents investigations attest that seemingly autonomous features typically found in industrial environments can be combined and syn-chronised in an apparently unpredictable fashion to produce critical accidents.
This exposes the need for a novel method focused on the examination of specific interactions between latent design deficiencies and human erroneous ac-tions, assuming that the identification of common patterns from real-world accidents can provide some guidance to design failure prevention schemes. Limi-tations in dealing with complex data will be over-come by the application of the self-organising maps (SOM) algorithm developed by Kohonen (2001) in a major-accidents dataset, followed by the detailed in-terpretation of the output with regard to design fail-ures.
2 BACKGROUND
2.1 The Multi-Attribute Technological Accidents Dataset (MATA-D)
In order to capture human, technology and organisa-tional features from industrial accidents, the authors developed a comprehensive dataset by collecting da-ta from insurance companies, regulators, industry and official commissions designated to investigate major accidents. The proposed dataset structure fol-lowed Hollnagel’s (1998) Cognitive Reliability and Error Analysis Method (CREAM) taxonomy, and was used in this work to identify and classify events from different industrial domains under a common framework. As major accidents can be considered to be rare events, having the possibility to merge a number of significant events generated from seem-ingly dissimilar industrial segments, such as aviation and chemicals factories, would build-up sufficient data to allow statistical analysis and disclose com-mon associations. This novel approach might prove to be a powerful alternative to understand how latent conditions embedded in design are interacting with human errors to generate or contribute to major ac-cidents.
In summary, features related to (i) human errone-ous actions (e.g. timing, omission, wrong direction, wrong object, wrong sequence); (ii) human cognitive functions (e.g. observation missed, wrong identifica-tion, decision error, wrong reasoning, incorrect
pre-diction, inadequate plan, priority error); (iii) tempo-rary person-related functions (e.g. fear, fatigue, dis-traction); (iv) permanent person-related functions (e.g. functional impairment); (v) technology (e.g. equipment failure, inadequate procedure, software fault); and (vi) organisation (e.g. communication, maintenance failure, quality control, design failure, inadequate task allocation, training, working condi-tions) are extracted from the accident reports and or-ganised in a matrix in order to allow numerical anal-ysis (using binary tables containing the presence or absence of attributes). Each accident can simultane-ously contain up to 53 of these human, technology and organisational factors. Detailed evaluations and further interpretation are also possible, by using the brief descriptions containing the hot spots of each one of the identified factors, as interpreted from the accident reports. Moura et al (2015a) presented a full account of the proposed classification scheme and a detailed example of an accident dissection.
Currently, the dataset contains 216 accidents from several industrial domains (e.g. refining, upstream (oil & gas), terminals and distribution, petrochemi-cals, construction, metallurgy, nuclear and gas pro-cessing and chemicals).
3 DATASET ANALYSIS METHOD 3.1 Clustering and data mining using self-organisation
Aiming at the identification of groups of major in-dustrial accidents sharing common features, an un-supervised training neural network technique named Self-organising Maps (Kohonen, 2001), was applied to the MATA-D dataset. The resulting self-organisation summarises the multidimensional data (a 216 x 53 Matrix, in the current study) in a two-dimensional topographic map (Figure 1), where ac-cidents were mutually attracted by a similarity crite-ria and thus adjacently grouped. 2-D SOM maps were created with Viscovery® SOMine expert ver-sion.
Figure 1. SOM Clustering for MATA-D, after Moura et al (2015b)
4 RESULTS
4.1 Design Failure Clustering results
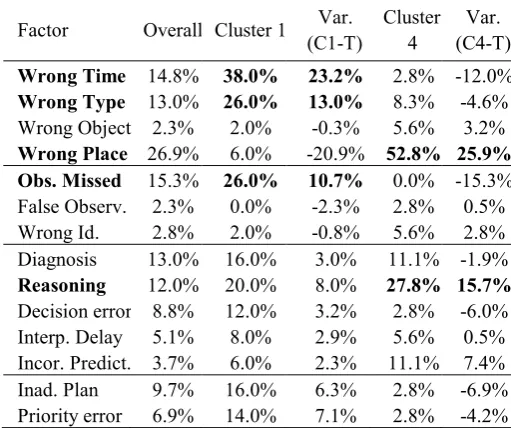
The Design Failure factor highest incidences were shown in Clusters 1 and 4, with 86.0% and 83.3%, respectively. Therefore, once the self-organising maps algorithm had been used to highlight these two groups as the most important from a design perspec-tive, further analysis on the individual features’ SOM maps will be conducted in order to disclose relevant associations. Table 1 presents the overall importance of each human (from Wrong Time to Cognitive Bias), technology (from Equipment Fail-ure to Mislabelling) and Organizational (from Communication Failure to Inadequate Working Hours) feature for the full dataset, compared to the results of the SOM algorithm for clusters 1 and 4. For instance, it can be seen that the Design Failure factor frequency has shown an increase of 23.5% for cluster 1 and of 20.8% in cluster 4, above the overall incidence of 62.5%.
Table 1. MATA-D Overall Frequencies vs. SOM clusters 1 & 4 frequencies
Factor Overall Cluster 1 Var. (C1-T)
Cluster 4
Var. (C4-T)
Wrong Time 14.8% 38.0% 23.2% 2.8% -12.0%
Wrong Type 13.0% 26.0% 13.0% 8.3% -4.6%
Wrong Object 2.3% 2.0% -0.3% 5.6% 3.2%
Wrong Place 26.9% 6.0% -20.9% 52.8% 25.9%
Obs. Missed 15.3% 26.0% 10.7% 0.0% -15.3%
False Observ. 2.3% 0.0% -2.3% 2.8% 0.5% Wrong Id. 2.8% 2.0% -0.8% 5.6% 2.8% Diagnosis 13.0% 16.0% 3.0% 11.1% -1.9%
Reasoning 12.0% 20.0% 8.0% 27.8% 15.7%
Decision error 8.8% 12.0% 3.2% 2.8% -6.0% Interp. Delay 5.1% 8.0% 2.9% 5.6% 0.5% Incor. Predict. 3.7% 6.0% 2.3% 11.1% 7.4% Inad. Plan 9.7% 16.0% 6.3% 2.8% -6.9% Priority error 6.9% 14.0% 7.1% 2.8% -4.2%
Memory fail 0.9% 0.0% -0.9% 0.0% -0.9% Fear 2.3% 2.0% -0.3% 0.0% -2.3% Distraction 6.5% 4.0% -2.5% 2.8% -3.7% Fatigue 3.2% 4.0% 0.8% 2.8% -0.5% Perf. var. 1.4% 0.0% -1.4% 0.0% -1.4% Inattention 2.3% 2.0% -0.3% 0.0% -2.3% Physio. stress 0.9% 0.0% -0.9% 2.8% 1.9% Psycho. stress 3.2% 2.0% -1.2% 5.6% 2.3% Func. Impair. 0.5% 2.0% 1.5% 0.0% -0.5% Cognitive styl 0.0% 0.0% 0.0% 0.0% 0.0% Cognitive bias 6.9% 10.0% 3.1% 8.3% 1.4%
Equip failure 57.9% 82.0% 24.1% 61.1% 3.2%
Software fault 2.8% 0.0% -2.8% 5.6% 2.8%
Inadeq. proc. 43.1% 44.0% 0.9% 77.8% 34.7%
Access limits 1.4% 0.0% -1.4% 2.8% 1.4% Ambig. Info. 2.8% 6.0% 3.2% 2.8% 0.0% Incomp. info. 13.9% 20.0% 6.1% 16.7% 2.8% Access probs 1.4% 2.0% 0.6% 5.6% 4.2% Mislabelling 1.4% 0.0% -1.4% 2.8% 1.4%
Communic. 11.1% 26.0% 14.9% 5.6% -5.6%
Missing info. 19.0% 20.0% 1.0% 58.3% 39.4%
Maintenance 34.7% 42.0% 7.3% 83.3% 48.6%
Quality Ctrl. 57.4% 82.0% 24.6% 97.2% 39.8%
Management 10.2% 18.0% 7.8% 19.4% 9.3%
Design 62.5% 86.0% 23.5% 83.3% 20.8%
Task alloc. 56.5% 62.0% 5.5% 97.2% 40.7%
Social press. 6.9% 0.0% -6.9% 22.2% 15.3%
Skills 36.6% 72.0% 35.4% 36.1% -0.5%
Knowledge 33.3% 60.0% 26.7% 63.9% 30.6%
Temperature 1.4% 2.0% 0.6% 0.0% -1.4% Sound 0.0% 0.0% 0.0% 0.0% 0.0% Humidity 0.0% 0.0% 0.0% 0.0% 0.0% Illumination 0.9% 0.0% -0.9% 5.6% 4.6% Other 0.0% 0.0% 0.0% 0.0% 0.0% Ambient cond 7.4% 4.0% -3.4% 5.6% -1.9% Demand 5.6% 2.0% -3.6% 5.6% 0.0% Layout 2.8% 2.0% -0.8% 2.8% 0.0% Team support 3.7% 4.0% 0.3% 5.6% 1.9% Working hrs 4.2% 2.0% -2.2% 5.6% 1.4%
[image:3.595.30.287.44.219.2] [image:3.595.31.287.588.802.2]well-defined path for further investigation, as the genesis of major accidents involving design failures appears to be grounded on a very limited amount of factors.
Cluster 1 accidents, which were deeply associated with the Design Failure, Inadequate Quality Control and Equipment Failure factors, were largely accom-panied by two very specific human erroneous ac-tions, Wrong Time and Wrong Type. In this group-ing, these human errors were uniformly connected with all three cognitive levels (Observation, Interpre-tation and Planning), but with an observable greater tie between the Wrong Time and Observation Missed factors, as exemplified in Figures 2 and 3.
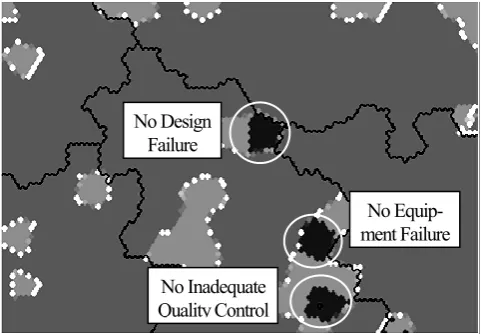
[image:4.595.308.552.38.208.2]The SOM maps for individual features (Figures 2 to 6) are binary, meaning that the dark grey zone is where the analysed item was absent, while the light grey represents the regions were the feature was ob-served.
Figure 3. Observation missed SOM
[image:4.595.31.279.271.449.2]Further analysis of the Wrong Time SOM also al-lows identifying that in the scarce cases where De-sign Failure did not seem to contribute to the acci-dents, an Insufficient Skills issue (i.e. lack of practical experience or equipment mishandling) was manifested and joined the Inadequate Quality Con-trol and Equipment Failure factors to contribute to the undesirable outcome. When Inadequate Quality Control or Equipment Failure did not appear to di-rectly contribute to the accident (highlighted regions on Figure 4), the Wrong Time feature was equally represented, but combined with the Insufficient Knowledge factor (e.g. lack of understanding of the situation).
[image:4.595.30.568.501.751.2]Figure 2. Wrong Time SOM
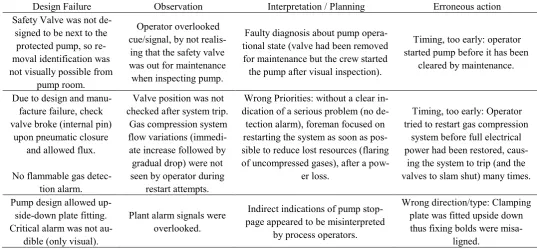
Table 2. Cluster 1 accident examples
Design Failure Observation Interpretation / Planning Erroneous action Safety Valve was not
de-signed to be next to the protected pump, so re-moval identification was not visually possible from
pump room.
Operator overlooked cue/signal, by not
realis-ing that the safety valve was out for maintenance when inspecting pump.
Faulty diagnosis about pump opera-tional state (valve had been removed for maintenance but the crew started the pump after visual inspection).
Timing, too early: operator started pump before it has been
cleared by maintenance.
Due to design and manu-facture failure, check valve broke (internal pin)
upon pneumatic closure and allowed flux.
No flammable gas detec-tion alarm.
Valve position was not checked after system trip.
Gas compression system flow variations
(immedi-ate increase followed by gradual drop) were not seen by operator during
restart attempts.
Wrong Priorities: without a clear in-dication of a serious problem (no de-tection alarm), foreman focused on restarting the system as soon as pos-sible to reduce lost resources (flaring of uncompressed gases), after a
pow-er loss.
Timing, too early: Operator tried to restart gas compression
system before full electrical power had been restored,
caus-ing the system to trip (and the valves to slam shut) many times.
Pump design allowed up-side-down plate fitting. Critical alarm was not
au-dible (only visual).
Plant alarm signals were overlooked.
Indirect indications of pump stop-page appeared to be misinterpreted
by process operators.
Wrong direction/type: Clamping plate was fitted upside down thus fixing bolds were
misa-ligned.
Table 2 highlights some MATA-D extracts of cluster 1-type accidents, focusing on the interaction between design failures; observation, interpretation and plan-
Figure 4. Insufficient Knowledge SOM
Apart from the situations where the simultaneous failure of the threesome Design-Quality Control-Equipment was present, the Wrong Type factor in cluster one only persisted in the few cases where a Wrong Reasoning cognitive function was also shown (shadowed regions on Figures 5 and 6). It means that even when one of the three main factors was not decisive, a faulty reasoning involving infer-ences, generalisations or deduction was still capable of leading to an erroneous action and contribute to an accident. Similarly to the Wrong Time factor, er-roneous actions classified as Wrong Type also per-sisted when the Design Failure was not critical, but only when combined with Insufficient Skills.
Figure 6: Wrong Reasoning SOM
In Cluster 4, accidents were largely based on the trio Design-Quality-Task Allocation, all organisational features. The manifestation of human erroneous ac-tions was heavily determined by the Wrong Place feature, accompanied by a specific interpretation cognitive function, the Wrong Reasoning factor. Contrasting with Cluster 1, where other factors (e.g. Insufficient Skills) joined some erroneous actions to produce an accident sequence even in the absence of a design flaw, no observable single feature could substitute the Design Failure and direct link with the Wrong Place in this cluster. Additionally, 100% of the Wrong Place appearances were simultaneously influenced by Inadequate Task Allocation and Inad-equate Quality Control.
[image:5.595.308.550.37.195.2]Table 3 exemplifies the nature of accidents grouped in Cluster 4. Design Failures are combined with interpretation cognitive functions to stimulate a Wrong Place erroneous action type. In these cases, the number of cognitive functions associated to ob-servation and planning was negligible.
Figure 5: Wrong Type SOM
Table 3. Cluster 4 accident examples
Design Failure Observation Interpretation Erroneous Action Design of the pipe trench
al-lowed hot water/solids to stay in permanent contact
with hydrogen pipe.
-
A recent leak in a non-related nitro-gen pipe in the plant made induced operator to think that the new leakage
was similar. (Wrong Reasoning)
Sequence, Jump forward: mainte-nance skipped testing and continued
service without knowing the liquid identification. (Wrong Place)
Poor design of oven
temper-ature controller. -
Operator interpreted the temperature problem as a product quality issue and ignored the safety critical matter
of letting the furnace doors open. (wrong reasoning, wrong priorities)
Wrong action: operator opened fur-nace doors to control temperature as
it was too high. (Wrong Place) No Equipment
Failure
No Inadequate Quality Control
No Equip-ment Failure
No Inadequate Quality Control No Design
Failure
No Equip-ment Failure
No Inadequate Quality Control No Design
[image:5.595.32.273.440.607.2]5 DISCUSSION
5.1 Genesis of human errors in major accidents
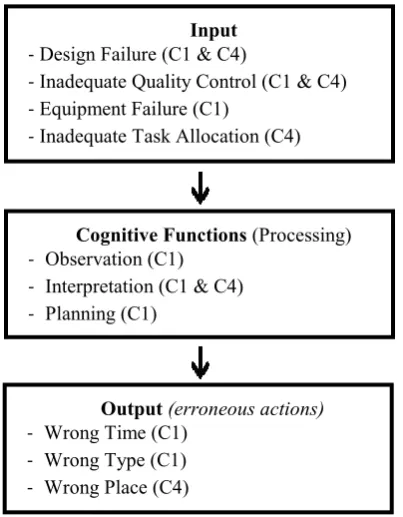
The Design Failure feature was the most significant single contributor to major accidents, and obtained the highest frequency in the MATA-D dataset. En-hanced analysis applying the self-organisation algo-rithm for clustering/data mining purposes highlight-ed the two areas in which design failures imposhighlight-ed its greatest influence: Cluster 1 and Cluster 4. In spite of being composed of a complex interaction of up to 53 features, the examination of the clustering and of the self-organising maps for each individual feature indicated that the major accidents origins in these two areas seem to lie on a straightforward and nar-row basis to trigger disturbances in cognitive func-tions. As a direct result, the manifestation of very specific human erroneous actions in the end of the accident sequence was recognised. Design Failure and Inadequate Quality Control were combined with Equipment Failure to trigger Wrong Time and Wrong place erroneous actions in Cluster 1, and with Inadequate Task Allocation to trigger the Wrong Place error mode in Cluster 4. Despite the differences between Cluster 1 and Cluster 4, the in-put-output connection depicted in Figure 7 is largely applicable, and thus can be depicted as a general pat-tern for major accidents related to design failures and human errors.
Figure 7: General configuration of human errors in industrial accidents
This model suggests that approaches which intend to prevent human error in design by simply reacting to large sets of possible human erroneous actions can be largely unsatisfactory and of limited usage, as the phenomenon focus is fundamentally wrong. Human errors can be mistakenly seen as the cause of major
accidents, but the data analysis indicates that they are mainly responses to unsupportive inputs (e.g. Design Failure) which misdirected human mental processes. From a design perspective, the correct and precise approach would necessarily involve designing to support mental processes and facilitate the fluidity of the human cognitive functions.
When latent conditions embedded in design are not observable in an accident sequence, basic poor training circumstances (lack of skills) play a more significant role to contribute to accidents, but this training-related input is expected to be dealt with in future stages of the lifecycle, specifically in the op-erational stage. Nevertheless, as can be concluded from the Insufficient Knowledge SOM map (Figure 4) analysis, a poor design appears to override the knowledge about the system, and, to compensate the design deficiency, the human operator has to per-form a complex cognition sequence, involving the observation of simultaneous clues and signals, tak-ing immediate decisions based on interpretations and construct accurate mental plans. It is worth noticing that overlooking a cue, indication or measurement (observation missed) is particularly associated with the Wrong Time factor, as previously seen in Figures 2 and 3.
5.2 Design transparency and comprehension
The analysis of the results in Cluster 1 and the examples in Table 2 shows a clear path for improv-ing design. The strong presence of the Observation Missed cognitive function exposes an issue that can be defined as “transparency of design”. At first glance, errors such as starting a pump under mainte-nance and clamping a plate fitting upside-down can be considered to be elementary, but the broad view is that design obscurity (safety valve was located away from the equipment, design allowed an upside-down fitting and the lack of audible alarms) caused a sys-tem ambiguity difficult to interpret in the face of simultaneous operating challenges.
In Cluster 4, the design input mostly contributed to a more complex, but well-defined, flawed mental modelling. The Wrong Reasoning feature was mani-fested while the human operator was trying to carry out a sequence of actions (Wrong Place) to compen-sate (or as a consequence) of the Design Failure. Once again, an isolated analysis of the human errors such as opening the furnace doors to control temper-ature can appear to be inconsequential, but, in fact, an undoubtedly poor design triggered interpretation shortcomings. In these cases, the overall understand-ing of the system behaviour was lost.
Input
-Design Failure (C1 & C4)
-Inadequate Quality Control (C1 & C4)
-Equipment Failure (C1)
-Inadequate Task Allocation (C4)
Cognitive Functions (Processing)
- Observation (C1)
- Interpretation (C1 & C4)
- Planning (C1)
Output (erroneous actions)
- Wrong Time (C1)
- Wrong Type (C1)
[image:6.595.65.267.424.683.2]6 CONCLUSIONS
6.1 A new two-step approach to design
It is now clear that the early detection of latent conditions embedded in design is essential to mini-mise human errors and thus accidents, and the gen-eral configuration in Figure 7 aims to express a di-rect and useful path to support design failure prevention schemes. Significant improvement can be achieved by primarily focusing on the “transparency of design”, which means to initiate the design analy-sis from a visibility assessment perspective - the sys-tem variables and components which are simultane-ously seen by operators and serve as input to the decision-making process (largely based on cognitive functions). This study has also shown that the person in charge might perform an irregular sequence of ac-tions to keep the system under control, and an incor-rect reasoning under this environment is usually dis-astrous. Thus, the second step would involve the analysis of how design might support the accurate interpretation of system status and help the operator in the search for alternative solutions for operations’ continuity. This would lead to a broad “comprehen-sion of design”.
Therefore, from the real-world accidents dataset scrutinised in this study, it can be concluded that de-signing for transparency and human comprehension can be a prevailing mechanism to transform design in the future and reduce major accidents in high-technology industries.
6.2 Future Developments
Future investigation regarding the mental processes depicted in Figure 7 may perhaps give some insight into how design and organisational aspects can stim-ulate an improved interpretation and systemic ap-proach to operational reality. Also, the high frequen-cy of the quality control and maintenance failure features in Cluster 4 may deserve further examina-tion.
A complete analysis of the MATA-D design fail-ures description in relation to cognitive functions failures may also support the construction of a straightforward list of critical interactions to be checked during the design stage.
Existing design can benefit from the same method to scrutinise relevant factors such as training and quality control. Similarly, other clusters could be ex-amined in the search for additional input to design improvement strategies.
The expansion of the data sample to include more high-technology accidents is also ongoing.
7 ACKNOWLEDGEMENTS
This study was partially funded by CAPES (Proc. nº 5959/13-6).
8 REFERENCES
Butler, J.E. 1980. Man-made disasters. Richmond (Victoria): Heinemann Educational
Hollnagel, E. 1998. Cognitive Reliability and Error Analysis Method. Oxford: Elsevier Science Ltd.
Kohonen, T. 2001. Self-Organizing Maps. 3rd ed. Berlin:
Springer.
Kurokawa, K. et al. 2012.The Official Report of The Fukushi-ma Nuclear Accident Independent Investigation Com-mission - Executive Summary [Online] Tokyo: The Na-tional Diet of Japan. Available from:
https://www.nirs.org/fukushima/naiic_report.pdf
(Ac-cessed: 6 February 2015).
Moura, R. et al. 2015a. Human error analysis: Review of past accidents and implications for improving robustness of system design, Proceedings of the 24th European Safety and Reliability Conference, 14-18 September 2014, Wroclaw. London: Taylor & Francis Group, pp. 1037-1046.
Moura, R. et al. 2015b. Learning from Accidents: Analysis and Representation of Human Errors in Multi-attribute Events. Proceedings of the 12th International Confer-ence on Applications of Statistics and Probability in Civil Engineering, ICASP12 Vancouver, Canada, July 12-15, 2015.
Reason, J. 1990. Human Error. New York, NY: Cambridge University Press
Reason, J. 1997. Managing the Risks of Organizational Acci-dents. Farnham, Surrey: Ashgate Publishing Limited Vesely, W.E. et al. 1981. NUREG-0492 - Fault Tree