Simulation and Analysis of Renewable Energy
Resource Integration for Electric Vehicle Charging
Stations in Thailand
Tongpong Sriboon
1, Supakorn Sangsritorn
1, Paul Gerard Tuohy
2, Mahesh Kumar Sharma
3and
Nopbhorn Leeprechanon
3,*1Alternative Energy Division, Provincial Electrical Authority (PEA), Bangkok, Thailand
2Department of Mechanical and Aerospace Engineering, University of Strathclyde, Glasgow, Scotland, U.K.
3
Department of Electrical and Computer Engineering, Thammasat University, Pathum Thani 12120, Bangkok, Thailand *Corresponding Author, Email: [email protected]
Abstract—This paper presents simulation results and analysis of renewable energy system integration to supplying EV charging stations using Provincial Electricity Authority (PEA) head office located in Bangkok, the capital territory of Thailand. This study has incorporated three types of renewable energy resources, i.e. solar, wind and energy storage. The MERIT™ program is being used in this study to simulate the system performance. However, relevant system data and other parameters, i.e. energy matching (%) between power demand and power supplied from renewable energy resources, capital cost (£) incurred in building renewable energy system, the amount of surplus and deficit (kWh), are also brought into consideration. This work also targeted to devise the annual proportion of three size cases of EVs available in market today−small, medium and large, respectively. On comparing the simulation results with real electricity generating situations, it is envisaged that the obtained solutions being employed to improve performance of a completely installed renewable energy system integrated into EV charging stations, located at PEA head office, are expected to alleviate the electricity use of the grid and meet the charging demand of EV’s in the long term.
Index Terms—Charging station, electric vehicle (EV), renewable energy, solar power, wind power.
I. INTRODUCTION
The worldwide adoption of electric vehicles (EVs) taking a lead over the traditional fossil fuel vehicles, particularly in the marketplace, is being made possible due to various profitable reasons which they offer to their end consumers in the form of performance improvement, low environmental impact with no greenhouse emissions, high efficiency, etc. [1] [2]. Hence, the governmental and non-governmental organizations throughout the globe have conferred policies to support the possible trade of EVs in their respective countries. However, some countries are still lacking in the widespread availability of EVs charging stations−the important element of EVs, needed for recharging EV’s batteries [3]. Generally, the energy required for charging EVs is taken from the main grid, thus reducing the greenhouse gas emissions and other air pollutants released out through the fueling transportation. However, several problems are attached
with the petroleum-based electricity generation that causes the rise in the emission level [4]. Thus, it is not the best solution to only use energy from the grid for charging EVs, and thus, the non-conventional energy resources should be integrated which improve both the ability and the performance of these systems. This will also add value to EVs charging stations, thus making them more efficient and eco-friendly with their dependency on the primary source of energy. With this background, this paper has laid its main focus on the optimal use of renewable energy resources for the proliferation of EVs charging stations. In this research study, relevant system data and other parameters such as energy matching (in %) between power demand and power supplied from the renewable energy resources, capital cost (in £) incurred in building a renewable energy system, the amount of surplus and deficit (in kWh), are being considered. The case study taken into account is divided into 28 different categories for finding the appropriate proportion of the renewable energy resources to install for charging three sizes of EVs available in the market today−small, medium and large, respectively. The simulation results have been compared with PEA’s head office based EV charging station, located in Bangkok, to evaluate the difference in the performance of stand-alone renewable energy systems and renewable energy systems that are integrated with the existing power grid, respectively.
The synopsis of this paper focusing on the enhancement of the renewable energy resources integration into EV’s charging station is as follows. The problem setting comprising software requirements to perform optimization of the renewable energy systems for EVs charging stations, analysis of technical details and model taken into consideration, renewable energy systems design for EVs charging stations, investigation of model based on the energy matching, charging system demand, climate and time, is discussed in Section II. Simulation results obtained for three different sizes of EV’s model are provided in Section III. In Section IV, discussion on the overall simulation results with their comparison to the real electricity generation situations is made followed by the conclusion.
II. PROBLEM SETTING
A. Software requirements for performing the optimization of
renewable energy system for EVs charging stations Many countries are greatly heading towards the integration of the renewable energy resources either in stand-alone or grid connected mode into EVs charging stations. The generation of the electricity is becoming a costly affair due to high fuel price while greenhouse gas emission issue is reaching to its extreme limits causing climate change and air pollution. Moreover, for performing electrification of a remote area or rural location, an extension of the electricity system is required, hence installing renewable energy resources system as a standalone system can be more commercial than extending power lines to the grid [5] but prior to installation, local usable renewable energy supply, local load demand, and climate must be considered. Therefore, the prediction of these data through simulation software would be helpful in finding both users demand and renewable energy based supply needed more efficiently [6].
Previous research studies affirmed the success of computer programs in simplifying the job of renewable energy resources integration system either connected directly or remotely to the EVs charging stations. This research study requires a software program to match the profile of EV’s load demand, the supply utilizing the green energy resources and the grid setting by the users. The data obtained by this software program that has the ability to increase the capability of EVs charging stations more efficiently are not only needed but also the financial issues and environmental impacts are the anticipated results this software programs should provide to users too [7]. However, in general, this software program should have various functions which are as follows.
• Setting the size of EVs demand
• Evaluating the energy supply received from renewable energy resources as well as the electricity grid
• Matching properly users energy demand with supply • Investigating the local climate with various seasonings • Managing the auxiliary system, i.e. energy storage and
controlling for getting better benefits
B. Technical and Modelling Analysis
[image:2.612.319.556.59.228.2]To successfully meet the primary objective of this research study, a software program which is selected to do a simulation of matching performance of EV’s load demand and renewable energy resources is MERIT™ program. Various factors which support the use of this simulation software due to its suitability to feed the specific information regarding location and climate as inputs, resulting various useful data after simulation such as percentage matching between demand and supply, the amount of surplus and deficit energy, installation cost incurred into the system. The framework of this software program is elaborated in Fig. 1. The system framework allows information exchange with other energy analysis tools remotely via the internet. This simulation software makes usage of the real data in simulation apart from this, it can also exploit the ideally generated data of energy supply taking as inputs before system installation at the real location or area as shown in Fig. 2.
Figure 1. Framework of MERIT program [8]
This software program facilitates its users to input the data like power demand, energy supply, local climate and auxiliary database for assessing the system quality in various models. A matching number is displayed in percentage which is the main data to check the system performance through this program. If this number is high, it concludes EVs charging stations system can balance demand and load properly.
Figure 2. Working window of MERIT program
C. Designing of Renewable Energy Based System Utilizing
into EVs Charging Stations
[image:2.612.319.553.333.462.2]The main component of the renewable energy resources based systems for EVs charging stations is illustrated in Fig. 3.
Figure 3. Designing of renewable energy system for EVs charging stations
D. Model of Matching Demand and Supply
For simulation purpose, MERIT program utilized common data of the main component as discussed in Section II-C to see the matching number related to demand and supply; therefore, users have to input the general data into this software program. Details included in this data are described as follows.
1) Photovoltaic Panel Module: Thailand strength in terms of solar power capacity does not need any introduction. Thus, the power generated to charge EVs cars, utilized in this study, is highly supplied from solar power. This work has employed polycrystalline type solar panel having a size of 0.812 m2,and it has a standard maximum output of 100W per panel.
2) Wind Turbine Module: Even though Thailand does not
have a high wind power capacity but still there are some areas in Thailand capable of generating power with low wind speed and by considering this fact, this research study has employed low wind speed turbine reasonable to install in Bangkok. This wind turbine has its rotor diameter of 3.2 m, and the workable wind speed is about 2.5 m/s to 7 m/s. Even if the performance of small wind turbine is lower than large wind turbine but still small wind turbine chosen in this study for simulation is more suitable to locate in Bangkok.
3) Battery Storage: As per the specification of solar panel and wind turbine mentioned above, bus voltage of 12V DC is needed to design this renewable energy system. Thus, the size of the battery to be integrated into this system should be 12V 215Ah. However, the minimum state of charge (SOC) of this battery storage is 40% which represents that the power of this battery storage cannot fall below 40% whereas the power will be utilized only when the battery is charged nearly 60% of the total capacity of the battery storage.
In Thailand, the targeted area, where the renewable energy system is planned to be installed into EVs charging stations, is about 120 m2 exactly similar to the rooftop area of PEA’s head office based EV charging station, located in Bangkok, whereas the size of solar panel that is exploited in this work is 0.812 m2 as discussed earlier. As a result, the maximum number of solar panels that can be installed in this area is 120/0.8712 = 137.74 (≈ 140 panel). For ideal systems, each solar panel should have their own batteries to keep energy for EV charging station thus
making the system more effective. Therefore, to meet the ideal systems requirement, the maximum number of batteries equals to the maximum number of solar panels, i.e. 140 units.
[image:3.612.314.558.219.274.2]To achieve the purpose of matching demand and supply of EVs charging station systems, the renewable energy resources utilized in this study are divided into various categories to find the most suitable case from the perspective of their integration into EVs charging station in Thailand. Hence, in this study, the ratio of the maximum number of solar panels and batteries has been taken into four categories as shown in Table I.
TABLE I. RATIO OF MAXIMUM NUMBER OF RENEWABLE RESOURCES IN FOUR DIFFERENT CATEGORIES
Ratio of Maximum Number Solar Panel (Units) Battery (Units)
Zero 0 0
Quarter 35 35
Half 70 70
One 140 140
As discussed earlier, the low wind speed turbine is utilized in this study by knowing the fact that Thailand does not have a high wind power capacity. Thus, to study the effect of the low wind speed turbine on EVs charging stations, this research has added only one unit of the low wind speed turbine considering it as an alternative category. The case study taken into account is divided into 28 different categories relating to the renewable
energy resources and battery storage as shown in Table II.
TABLE II. NUMBER OF RENEWABLE ENERGY RESOURCES IN TWENTY -EIGHT DIFFERENT CATEGORIES
Category Wind (Units)
Photovoltaic (Units)
Battery (Units)
1. 1 0 0
2. 1 35 0
3. 1 70 0
4. 1 140 0
5. 1 0 35
6. 1 35 35
7. 1 70 35
8. 1 140 35
9. 1 70 0
10. 1 35 70
11. 1 70 70
12. 1 140 70
13. 1 140 0
14. 1 35 140
15. 1 70 140
16. 1 140 140
17. 0 35 0
18. 0 70 0
19. 0 140 0
20. 0 35 35
21. 0 70 35
22. 0 140 35
23. 0 35 70
24. 0 70 70
25. 0 140 70
26. 0 35 140
27. 0 70 140
[image:3.612.314.558.418.726.2]E. Model of EVs Charging Stations System Demand In compliance with the matching of demand and supply for a realistic model, in this research study, the demand model has been divided into three different sizes of EVs−small, medium, and large, respectively, commonly available in today’s market. The normal time period for charging EVs is about 7 hours, i.e. between 9:00 am to 16:00 pm which is the normal office hours in Thailand facilitating users to charge their electric car during this period of time. Thus, the electric charging demand for this study can be expressed as provided in Eq. (1), while the details of EV’s charging demand for three different models have been summarized in Table III and Table IV, respectively.
(Maximum Charging/ Full hour of Charging) × (Charging hour per day) × (Day of the Month) (1)
TABLE III. DETAILS OF EV’S CHARGING DEMAND
Size Model
Battery Storage Capacity (kWh)
Time for Full Charging
(hr)
Range for Full Charging
(km)
Power Demand per month
(kWh)
Small Twizy 6.1 3.5 80 183
Medium Nissan 24 8 160 630
Large Tesla 85 14 480 1,275
TABLE IV. CHARGING DEMAND PER MONTH FOR EV’S IN THREE
DIFFERENT MODELS
Model
(Maximum Capacity/Full hour of Charging) × (Charging hour per
day) × (Day of the Month)
Total Monthly Charging
Demand Twizy (6.1/3.50) × 3.5 × 30 183 kWh Nissan (24/8) × 7 × 30 630 kWh Tesla (85/14) × 7 × 30 1,275 kWh
F. Model of Climate and Time
[image:4.612.313.560.77.121.2]Bangkok, the capital territory of Thailand, has been chosen as the studied area by estimating that it would relatively have a high market possibility for globally growing EVs demand than other cities of Thailand. Thailand including Bangkok has three calendar seasons−winter, summer and rainy, in general. Thus, the starting month of each season is selected for representing a season as shown in Table V.
TABLE V. STARTING MONTH OF EACH SEASON FOR SIMULATION
Month Seasoning
January Winter
April Summer
September Rainy
III. SIMULATION RESULTS
For finding the appropriate proportion of renewable energy resources to be integrated into EVs charging stations, installed in Bangkok, Thailand, MERIT™ simulation software program has been selected for this research study. There are three types of demand profile of EVs−small, medium and large, that have been considered from simulation viewpoint. Simulation results obtained corresponding to three different sizes of EV’s models have further categorized on the basis of three different seasons of Thailand for attaining the closeness to a realistic model, and thus, helping in designing cost-effective EVs charging stations systems in Thailand. These simulations results regarding three cases of EVs have been provided in the following subsections.
A. Small Case Model
[image:4.612.50.561.563.725.2]As mentioned earlier, the Renault Twizy has been selected to represent small case model that requires the charging power of approximately 183 kWh per month. In Table VI, simulation results indicated that the maximum matching percentage is not the expected value of renewable energy supply. The power is generated from 35 units, 75 units, and 140 units of 100W solar panel enabling support to all demand of small EV’s model but it does not provide the high number of matching percentage of demand and supply because of possessing high surplus energy in spite of delivering power to EVs charging model. However, this surplus energy can be utilized for charging other EV’s car. Considerably, in the summer, photovoltaic panels can produce the surplus power of 665.99 kWh, 1510 kWh and 3210 kWh utilizing 35 units, 70 units and 140 units of 100W photovoltaic panels, respectively. Details of supply from photovoltaic panel and demand for small case model during the summer are being provided here in the weekly graphical form as shown in Fig. 4. The best case for small case EVs charging stations in Thailand is supplied energy from 35 units of photovoltaic panels having a high deficit and low cost, resulting in the ease of installation.
TABLE VI. SIMULATION RESULTS OF SMALL CASE MODEL FOR EVS CHARGING
Combination Match (%) Total Demand (kWh) Total Delivered (kWh) Total RE Supply (kWh) Surplus Energy (kWh) Deficit Energy (kWh) Capital Cost (£)
For Winter Season
WT600 12.63 183 7.35 27.67 19.47 166.74 1850 WT600 + 140 Batt. 100 183 183 27.67 0 0 47350
For Summer Season
WT600 12.01 183 17.59 88.32 68.57 150.45 1850 WT600 + 140 Batt. 100 183 183 88.32 0 0 47350
For Rainy Season
WT600 16.20 183 10.60 39.32 27.64 159.56 1850 WT600 + 140 Batt. 100 183 183 39.32 0 0 47350
Only Photovoltaic (Summer Season)
(a) 35 units of 100W Photovoltaic
(b) 70 units of 100W Photovoltaic
[image:5.612.52.292.62.256.2](c) 140 units of 100W Photovoltaic
Figure 4. Simulation results of small case model in summer
B. Medium Case Model
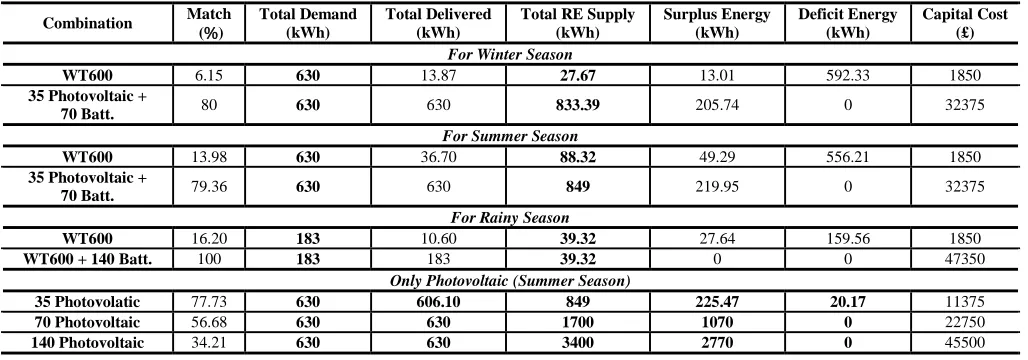
The Nissan leaf has been chosen to represent medium case model that requires the charging power of about 630 kWh per month, resulting in higher demand relative to small EV model. Thus, the power delivered for charging from renewable energy resources will be higher than small case model. On examining simulation results presented in Table VII, it is revealed that the maximum matching percentage is not resulted from renewable energy supply, even from its best case. The power is generated from 70 units and 140 units of 100W solar panel, respectively, facilitating support to all demand of medium EV’s models but it does not provide the high number of matching percentage of demand and supply because of possessing high surplus energy in spite of delivering power to EVs charging model. It is noted here that the power from 35 units of 100W photovoltaic panels is not sufficient to generate the power for medium case model. Considerably, in the summer, photovoltaic panels can produce the surplus power of 1,070 kWh and 2,270 kWh using 70 units and 140 units of 100W photovoltaic panels, respectively.
Details of supply from photovoltaic panels and demand for the medium case model during the summer are being presented in the weekly graphical form as provided in Fig. 5. The best case for medium case EVs charging stations in Thailand is supplied energy by 70 units of photovoltaic panels having a high deficit and low cost, resulting in the ease of installation.
(a) 35 units of 100W Photovoltaic
(b) 70 units of 100W Photovoltaic
(c) 140 units of 100W Photovoltaic
Figure 5. Simulation results of medium case model in summer
C. Large Case Model
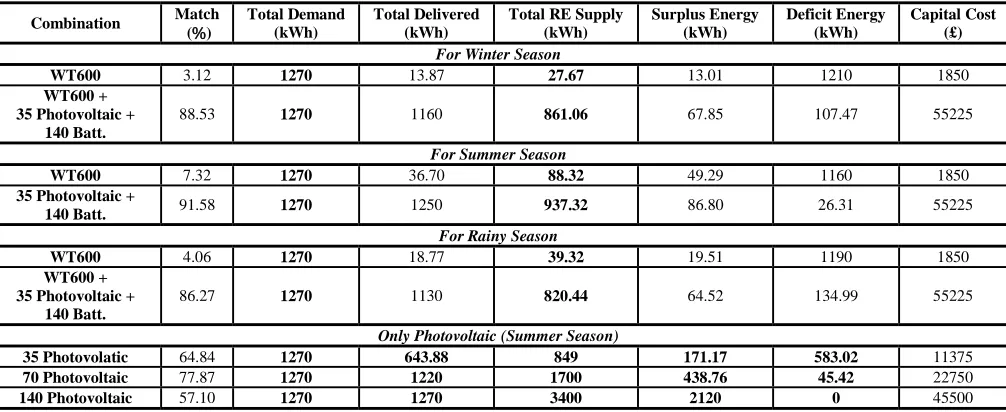
As mentioned earlier, the Tesla has been opted to represent large case model having high energy consumption. It demands for the charging power of about 1,270 kWh per month. As per simulations results provided in Table VIII, it is evident that the maximum matching percentage is not resulted from renewable energy supply, even from its best case. The power is generated only from 140 units of 100W photovoltaic panel thus enabling support to all demand of large EV’s model but it does not give the high number of matching percentage of demand as well as supply, it is because of possessing high surplus energy in spite of delivering power to EVs charging model. It is noted that the power from 35 units and 70 units of 100W photovoltaic panels is not sufficient to generate the power to large case model.
TABLE VII. SIMULATION RESULTS OF MEDIUM CASE MODEL FOR EVS CHARGING
Combination Match (%)
Total Demand (kWh)
Total Delivered (kWh)
Total RE Supply (kWh)
Surplus Energy (kWh)
Deficit Energy (kWh)
Capital Cost (£)
For Winter Season
WT600 6.15 630 13.87 27.67 13.01 592.33 1850 35 Photovoltaic +
70 Batt. 80 630 630 833.39 205.74 0 32375
For Summer Season
WT600 13.98 630 36.70 88.32 49.29 556.21 1850 35 Photovoltaic +
70 Batt. 79.36 630 630 849 219.95 0 32375
For Rainy Season
WT600 16.20 183 10.60 39.32 27.64 159.56 1850 WT600 + 140 Batt. 100 183 183 39.32 0 0 47350
Only Photovoltaic (Summer Season)
[image:5.612.314.556.138.316.2] [image:5.612.50.564.534.714.2]TABLE VIII. SIMULATION RESULTS OF LARGE CASE MODEL FOR EVS CHARGING
Combination Match (%)
Total Demand (kWh)
Total Delivered (kWh)
Total RE Supply (kWh)
Surplus Energy (kWh)
Deficit Energy (kWh)
Capital Cost (£)
For Winter Season
WT600 3.12 1270 13.87 27.67 13.01 1210 1850 WT600 +
35 Photovoltaic + 140 Batt.
88.53 1270 1160 861.06 67.85 107.47 55225
For Summer Season
WT600 7.32 1270 36.70 88.32 49.29 1160 1850 35 Photovoltaic +
140 Batt. 91.58 1270 1250 937.32 86.80 26.31 55225
For Rainy Season
WT600 4.06 1270 18.77 39.32 19.51 1190 1850 WT600 +
35 Photovoltaic + 140 Batt.
86.27 1270 1130 820.44 64.52 134.99 55225
Only Photovoltaic (Summer Season)
35 Photovolatic 64.84 1270 643.88 849 171.17 583.02 11375 70 Photovoltaic 77.87 1270 1220 1700 438.76 45.42 22750 140 Photovoltaic 57.10 1270 1270 3400 2120 0 45500
In summer, photovoltaic panels can produce the surplus power of 2120 kWh by using 140 units of 100W photovoltaic panels. Details of supply from photovoltaic panels and demand for the large case model during the summer are being demonstrated in the weekly graphical form as provided in Fig. 6. The best case for large EV’s charging stations in Thailand is supplied energy by using 140 units of 100W photovoltaic panels having a high deficit and low cost, resulting in the ease of installation.
(a) 35 units of 100W Photovoltaic
(b) 70 units of 100W Photovoltaic
[image:6.612.56.559.79.285.2](c) 140 units of 100W Photovoltaic
Figure 6. Simulation results of large case model in summer
IV. MODEL DISCUSSIONS
A. Discussion on Overall Simulation Results
In accordance with simulation results regarding three sizes of EVs taken into account, provided in the previous section, it can be clearly observed that the highest number of matching is not resulted from renewable energy supply because it can only generate the power as demand rises. In addition to this, it does not have the high surplus energy, making it possible to support the system extension in the future. Hence, for reliable and cost effective system, high surplus energy, low deficit and low cost of system installation should be given major preferences while
[image:6.612.311.561.366.431.2]comparing with 28 different categories. In Table IX, details of the most effective and suitable renewable system to install into the location of Thailand for each case model are being given.
TABLE IX. DETAILS OF THE MOST EFFECTIVE AND SUITABLE SYSTEM TO INSTALL IN THAILAND
Size Model Combination
Surplus Energy (kWh)
Deficit Energy (kWh)
Capital Cost
(£) Small Twizy 35 Photovoltaic 665.99 0 11375 Medium Nissan 70 Photovoltaic 1070 0 22750 Large Tesla 140 Photovoltaic 1850 0 45500
This research study has been performed on different scales of load demand. Simulation results strongly recommended that Thailand has the potential to generate energy pervasively from low wind speed turbines and photovoltaic panels employed for charging all EVs model taken into account. Photovoltaic panel systems can even supply energy to the load if system required, without utilizing any battery storage because EV’s cars can be charged directly from solar resources, resulting in helping to reduce the overall cost. Moreover, systems would be extended to large-scale, if needed, and thus battery storage elements are required to be introduced to these systems to supply energy on time.
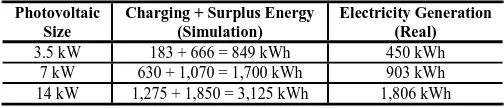
B. Comparison of Simulation Results with Real Situations of
Electricity Generation
[image:6.612.54.297.395.561.2]TABLE X. COMPARISON OF PHOTOVOLTAIC SIMULATION RESULTS WITH REAL ELECTRICITY GENERATION USING SOLAR ROOFTOP AT PEA’S
HEAD OFFICE FOR APRIL,2014
Photovoltaic Size
Charging + Surplus Energy (Simulation)
Electricity Generation (Real) 3.5 kW 183 + 666 = 849 kWh 450 kWh
7 kW 630 + 1,070 = 1,700 kWh 903 kWh 14 kW 1,275 + 1,850 = 3,125 kWh 1,806 kWh
It can be observed from Table X that the amount of energy estimated through simulation is approximately 40% more than the power obtained from the real electricity generating system. In this study, an effective factor has not been included in the simulation program. However, if it is considered, in that scene, the amount of energy produced is estimated to be nearly equal to that of the real electricity generating system.
V. CONCLUSION
In this paper, technical and economic aspects of renewable energy system resources integrated into EVs charging stations, located in Bangkok, Thailand have been investigated by using MERIT simulation program that optimizes demand and supply regarding these resources. The case study taken into account is divided into three size cases of EVs in each calendar season of Thailand, resulting in making it usable to realistic situations as much as possible. The matching percentage related to demand and supply is provided by this software program to its users to adjust system parameters, i.e. energy matching between power demand and power supplied from renewable energy resources, capital cost incurred in building renewable energy system, the amount of surplus and deficit, etc. prior to implementing them on Thailand’s locations. From the obtained simulation results, it can be concluded that the simulation program being used for evaluating the effectiveness of the renewable energy resources system to be integrated with EVs charging stations is expected to increase the capacity and reliability of these systems. Future work will incorporate the simulation of quick charging of EVs including the large range of climate data for different locations with extensive financial analysis as well.
ACKNOWLEDGMENT
The authors would like to pay their sincere gratitude to the anonymous reviewers for their critical comments and valuable suggestions that help in improving this manuscript. We would also like to acknowledge and appreciate the financial support, information, and resources received from our host institutions and organizations during this work.
REFERENCES
[1] P. Phonrattanasak and N. Leeprechanon, “Development of fast chargin-g station for Thailand,” International Journal of Innovation, Managem-ent and Technology, vol. 3, no. 4, pp. 668-674, Dec. 2012.
[2] P. Phonrattanasak and N. Leeprechanon, “Optimal placement of fast charging station on residential distribution grid,” International Journal of Innovation, Management and Technology, vol. 3, no. 6, pp. 675-681, Dec. 2012.
[3] A. Hamidi, L. Weber and A. Nasiri, “EV charging station integrating renewable energy and second-life battery,” in Proc. IEEE Int. Conf. Re- newable Energy Research and Applications (ICRERA), pp. 1217-1221, Oct. 2013, Madrid.
[4] A. Arikan et al, “Optimal renewable energy transfer via electrical vehi-cles,” in Proc. IEEE Innovative Smart Grid Technologies Conf. (ISGT), pp. 1-5, Feb. 2015, Washington, D.C.
[5] K. T. K. Teo, H. H. Goh, B. L. Chua, S. K. Tang and M. K. Tan, “Mod-elling and optimization of stand alone power generation at rural area,” in IEEE ICCE-China Workshop, pp. 51-56, Apr. 2013, Shenzhen. [6] J. Clarke, J. Hong, J. Kim, P. Strachan, I. Hwang and H. Lee,
“Simulat-ion-based design procedure to evaluate hybrid-renewable energy syste-ms for residential buildings in Korea,” in Proc. Ninth Int. IBPSA Conf., Building Simulation, pp. 191-198, Aug. 2005, Montreal, Canada. [7] J. Kim, “Integrated information system supporting energy action
plann-ing via the internet,” Ph.D. Dissertation, Dept. of Mechanical Engineer-ing, University of Strathclyde, Glasgow, UK, 2004.
[8] N. Smith, “Decision support for new and renewable energy systems de-ployment,” Ph.D. Dissertation, Dept. of Mechanical Engineering, Univ-ersity of Strathclyde, Glasgow, UK, 2002.
![Figure 1. Framework of MERIT program [8]](https://thumb-us.123doks.com/thumbv2/123dok_us/1560094.108627/2.612.319.553.333.462/figure-framework-merit-program.webp)