A New High and Moderate Speed Servo-Hydraulic
Forging Simulator Capabilities and Process Optimization
Michail Ntovas
1,a, Paul Blackwell
2,b1 Design, Manufacture and Engineering Management, University of Strathclyde, James Weir Building, 75
Montrose Street, Glasgow G1 1XJ, United Kingdom
2 Advanced Forming Research Centre, University of Strathclyde, 85 Inchinnan Drive, Inchinnan, Renfrewshire,
PA4 9LJ, United Kingdom
a[email protected], b[email protected]
Abstract. Process optimization within modern manufacturing is generally supported through the use of finite element based process models. Although the measurement of data at slower rates (10-4s-1 to 1s-1) is well established, there exists a challenge in generating accurate data for higher strain rate (10s-1to 200s-1) processes such as forging. Specialist equipment is required to determine the basic stress / strain response of materials in this range of strain rates. In the current work the capabilities of a novel servo-hydraulic forging simulator machine with capability for moderate and high deformation rates will be discussed. Furthermore, the route followed for optimizing the experimental procedure will be considered and some of the challenges highlighted.
INTRODUCTION
In modern manufacturing the need for process optimization is becoming more and more important due to the need to drive down costs and increase production rate [1]. In the past high strain rate forging processes were often used to manufacture parts that were oversize and which required final machining to shape. More recently there has been a move to forge parts close to net shape to minimize the need for such final machining. In addition, there is a requirement to ensure close control of microstructure to guarantee final properties. A principle tool in supporting process optimization is the use of finite element (FE) simulation [2][3].
A number of factors need to be in place to ensure that process models are robust; these include a large database of materials properties and a representation of the boundary conditions relevant to the process. The most widely used method for collecting material data to simulate forging processes is literature-models, static or dynamic tests and from material databases which are included in many commercial FE software packages.
Although, material data for slow deformation rates (10-4-1s-1) [4][5][6] and very high stain rates (above 1000s-1) [7][8][9] is well established and widely accessible through quasi-static tests and Hopkinson bar work for many materials, for moderate strain rates (10s-1 to 200s-1) the available material data is restricted. The reason behind this is the necessity for specialized testing equipment. Until recently data in this moderate strain rate was not widely available due to hardware and software restrictions, but at the same time it is essential for the accurate representation of e.g. those involving screw presses or hammers.
The equipment presented in the current work is a state of the art forging simulator based on a bespoke designed servo-hydraulic machine able to reach moderate strain rates up to 300s-1, covering the deformation rates produced during fast forging processes and creating material data essential for the Finite Element Simulations. The equipment’s unique hardware and software characteristics and capabilities are presented in this work. In addition, due to the fact that the equipment was new the route followed for optimizing the experimental procedure will be discussed and some of the challenges highlighted.
EQUIPMENT DESCRIPTION
of 12mm diameter and 18mm long but the multi-functional design provides the capability for other geometries also. An unusual characteristic is that the top and bottom platens both move during the compression test. In most standard test machines only one of the platens will move. Furthermore, each platen can be controlled independently from the other which confers considerable freedom in setting up complex displacement regimes.
FIGURE 1. Servo-hydraulic forging simulation machine, chamber and interior
The system is also equipped with an environmental chamber and argon supply system which allows experiments to be carried out in a neutral (non-oxidizing) environment and at the same time prevent the corrosion of the platens (the platens are manufactured from Tungsten). Furthermore, an automatic quenching system is installed in the chamber which makes possible fast quenching (within less than 5sec from the end of the experiment).
For high temperature experiments an induction heating system is used capable of generating temperatures up to 11000C, the system has been designed to be very flexible in terms of coils geometry (different coils can be used based on the material being tested) and heating ramps. The temperature may be controlled either using a pyrometer attached in the environmental chamber or by thermocouples (up to eight thermocouples can be used simultaneously to monitor the temperature).
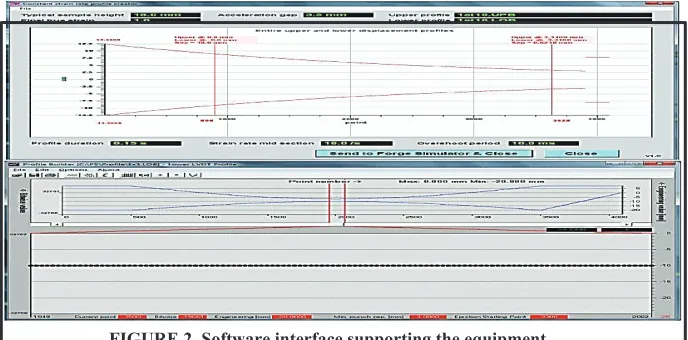
Two software packages support the equipment with distinct functions; Fig.2. The first software “Constant
Strain Rate Profile Creator” is specially designed software dedicated for forging or compression tests. The input parameters for the experiments are; the acceleration gap, the strain rate, the final true strain, the profile duration and the overshoot period. The second software is the “Profile Builder” which is dedicated to create a multistep forging profile.
[image:2.612.148.492.517.687.2]The combination of hardware and software makes this machine ideal for the detailed simulation of the thermomechanical conditions taking place during hot forging in screw presses and hammers.
EXPERIMENTAL OPTIMIZATION
Optimizing an experimental procedure is always challenging and become more challenging when the equipment is new and no previous method is in place. The most significant step in the optimization procedure is to define the parameters that influence the experiment and then control them to achieve a solid, repeatable and accurate experiment. Due to similarities with the hot isothermal compression test the protocols and the standards used worldwide to describe the experimental procedure has been used as a baseline for the experiments[10].
Three main parameters have been identified that influence the experimental procedure. The first is the temperature control, the second is the sample position and the third is the strain rate variation. Two factors are important with regard to the sample position;it’s location on the platens i.e. is it central, and the platen position in the coil.
Temperature Control Optimization
During the experiment procedure accurate and precise temperature control has been identified as critical to achieve solid, repeatable and accurate experiment. The system is supplied with an induction heating arrangement which is controlled by a pyrometer. The ASTM standard, E209-00, designates that the uniformity of temperature within the specimen gage length should be within +5.5°C and -11°C of the nominal test temperature up to and
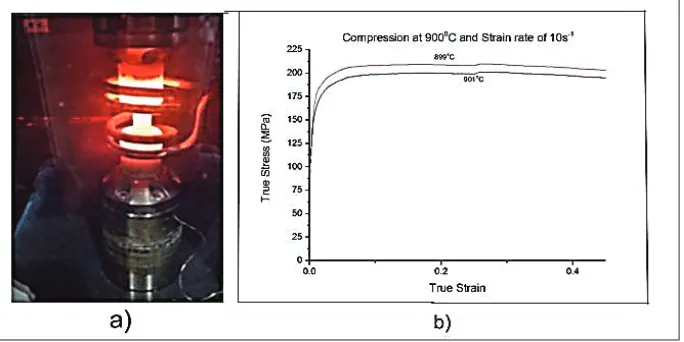
including 538°C and within +1.0 % and -2.0 % of the nominal test temperature above 538°C [11]. Due to changes in emissivity and the volume of the heated platens the pyrometer which is used to control the temperature lacks the accuracy for the precise temperature control required by the standard. Experimental results have shown that even small differences in the temperature during high strain rate compression tests can have a significant influence at the results; Fig.3.
FIGURE 3. a) Experimental set-up, b) Temperature variation influence
To optimize the temperature control in conjunction with the pyrometer a very fine, rapid response and minimum size thermocouple have been used (Type-K 0.25mm). The thermocouple is carefully spot welded to the sample and the temperature is recorded throughout the heating phase. The combination of two measuring/monitoring methods minimizes the actual temperature variation between experiments.
Sample Position Optimization
[image:3.612.150.492.411.582.2]within the coil. Any off-axis positioning, either vertical or horizontally, will tend to create a non-uniform electro-magnetic field within the sample. To address that factor a calibration tool Fig.4a was designed and manufactured. The tool uses the platen shape and a constant point in the chamber to identify the correct position of the sample.
FIGURE 4. a) Calibration tool, b) Temperature distribution Sample
The position of the platens (vertically) within the coil also has a significant effect on the temperature distribution inside the sample. To achieve a uniform temperature distribution a number of trials were run to determine the optimum position of the platens during heating. The sample material was taken from a Ti6Al4V 2000mm long bar with a very fine equiaxed microstructure. This was machined to samples 12mm in diameter by 18mm long. The samples were EDM machined with six holes of 0.3mm diameter Fig.4b. The holes were located 2mm from the top and the bottom and two of them in the middle of the sample. Six 0.25mm thermocouples were used to monitor and record the temperature inside the sample. Three were inserted 2mm from the surface of the sample and the other three were positioned along the sample centerline.
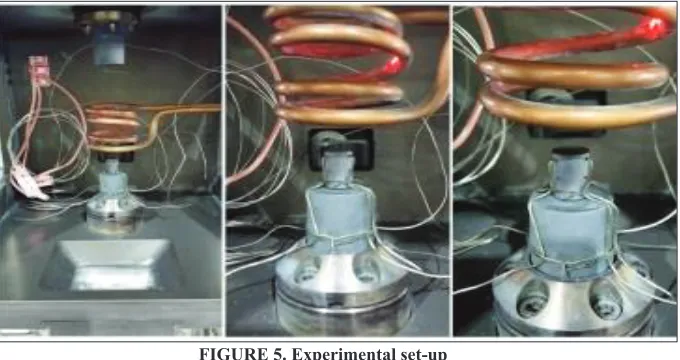
[image:4.612.149.491.125.303.2]The experimental set-up is illustrated in Fig.5. The sample was inserted inside the coil and heated to 5000C and the temperature monitored and recorded. The platen position was adjusted until the temperature distribution satisfied the ASTM standard E209-00 specifications [11]. The trial was repeated for a number of temperatures starting from 500oC up to 7000C with a step of 1000C and then up to 9500C with a 500C step.
FIGURE 5. Experimental set-up
The results from the six thermocouples for each of the selected optimized temperatures are given in Table 1. Small fluctuations are monitored inside the sample; these fluctuations arise from the induction heating system that is been used and from the heat exchange with the bottom platen (the top platen is not in contact with the sample during the heating stage). However, all the results are within the ASTM specification and the standard deviation of the temperature inside the sample has successfully been kept at minimum values
a
[image:4.612.151.491.470.650.2]TABLE 1. Temperature distribution optimization results Temperature
5000C 6000C 7000C 7500C 8000C 8500C 9000C 9500C
Thermocoupl
e
Temperature
Top Centre 5020C 5990C 6990C 7480C 8000C 8530C 9040C 9550C
Top Edge 5010C 5990C 6970C 7460C 7980C 8490C 9000C 9510C
Middle Centre 4950C 5960C 6950C 7440C 7960C 8430C 8920C 9400C
Middle Edge 5050C 6050C 7020C 7500C 8000C 8490C 9000C 9510C
Bottom Centre 5000C 5940C 6970C 7500C 8000C 8480C 8950C 9450C
Bottom Edge 5050C 6060C 7060C 7560C 8080C 8570C 9060C 9570C
Average 5010C 6000C 7000C 7500C 8000C 8500C 9000C 9500C
Standard Dev. 3.720C 4.790C 4.030C 4.110C 4.560C 4.70C 5.280C 6.330C
STRAIN RATE OPTIMIZATION
Having obtained the necessary temperature control, the next stage in experimental optimization is to then consider the control of the strain rate. Tests at these high speeds may take as little as 0.1sec. In the case of this particular equipment the input parameters are; the acceleration gap, the strain rate, the final true strain, the profile duration and the overshoot period. With regard to the acceleration gap, given the high speeds required to obtain these strain rates, it is necessary to have an initial gap between the specimen and the top platen to allow the upper actuator to reach full speed prior to impacting the sample. The magnitude of the acceleration gap effects the initial phase of the test and needs to be optimized to ensure that the top actuator hits the sample in the right speed. The profile duration is the parameter responsible for the data sampling period of the experiment. The software records up to 4096 values during the test. The third parameter is the overshoot period which works as a counter measure for the recording delay between the software and the hardware.
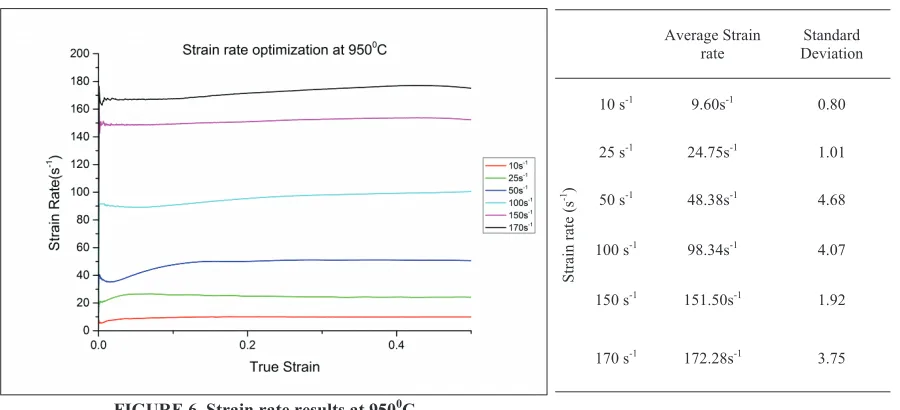
[image:5.612.87.537.472.677.2]To achieve a minimum strain rate variation a number of trials were run to determine the optimum values for the three parameters. For all the strain rates that was optimized the true final strain kept stable at 0.5. The strain rate optimization was conducted for a number of strain rates and temperatures. The same Ti6Al4V samples were used to avoid inputting any variance in the tests. Due to the large amount of the test not all the results for all the temperatures and stain rates can be presented. A number of the optimized strain rates conducted at 9500C are presented in Fig.6 and the average strain rate and standard deviation are shown in Table 2.
TABLE 2. Strain rate variation
FIGURE 6. Strain rate results at 9500C
It should be noted that these are the true (logarithmic) strain rates and not simply displacement speeds. From the results it is clear that the average strain rate for the tests was wall controlled. The strain rate variation up to the strain rate of 50s-1 and above 150s-1 shows a very small deviation in comparison with the strain rates from
Average Strain rate Standard Deviation Strain rate (s -1 )
10 s-1 9.60s-1 0.80
25 s-1 24.75s-1 1.01
50 s-1 48.38s-1 4.68
100 s-1 98.34s-1 4.07
150 s-1 151.50s-1 1.92
100s-1 to 150s-1. The reason behind that variation is in the beginning of the test where the strain rate undershoots otherwise the strain rate remains stable and constant during the rest of the experiment.
Conclusion
In the current work the capabilities of a new servo-hydraulic forging simulator machine with capability for moderate and high deformation rates have been demonstrated. Furthermore, the two main parameters influencing the experimental process have been identified and optimized for repeatable and accurate experiment. However, an optimization process is an ongoing process which evolved base on the needs. The combination of sample position and temperature control in terms of accuracy has been optimized but in terms of cost is an ongoing process. The cost of the thermocouple for each forging simulation trial is high and different methods are beening examined to minimize this cost.
Acknowledgement
M. Ntovas who is an Engineering Doctorate student within the Advanced Manufacturing Industrial Doctorate Centre (AMIDC) would like to acknowledge, the Engineering and Physical Sciences Research Council (EPSRC), the University of Strathclyde, the Advanced Forming Research Centre (AFRC) and the Department of Design, Manufacture and Engineering Management (DMEM). for the financial support.
References
1] A. Forcellese, E. Mancini, M. Sasso, and M. Simoncini, “Evaluation of Friction at High Strain Rate using the Split Hopkinson Bar,” Key Eng. Mater., vol. 651–653, pp. 108–113, 2015.
[2] J. Luo, B. Wu, and M. Li, “3D finite element simulation of microstructure evolution in blade forging of Ti-6Al-4V alloy based on the internal state variable models,” Int. J. Miner. Metall. Mater., vol. 19, no. 2, pp. 122–130, Jan. 2012.
[3] A. K. M. N. Amin, Titanium Alloys - Towards Achieving Enhanced Properties for Diversified Applications. InTech, 2012.
[4] W. F. Cui, Z. Jin, A. H. Guo, and L. Zhou, “High temperature deformation behavior of ?? + ??-type biomedical titanium alloy Ti-6Al-7Nb,” Mater. Sci. Eng. A, vol. 499, no. 1–2, pp. 252–256, 2009. [5] W. F. Cui, Z. Jin, a. H. Guo, and L. Zhou, “High temperature deformation behavior of α+β-type
biomedical titanium alloy Ti–6Al–7Nb,” Mater. Sci. Eng. A, vol. 499, no. 1–2, pp. 252–256, Jan. 2009. [6] R. Ding, Z. X. Guo, and a. Wilson, “Microstructural evolution of a Ti–6Al–4V alloy during
thermomechanical processing,” Mater. Sci. Eng. A, vol. 327, no. 2, pp. 233–245, Apr. 2002.
[7] W.-S. Lee and C.-F. Lin, “Plastic deformation and fracture behaviour of Ti–6Al–4V alloy loaded with
high strain rate under various temperatures,” Mater. Sci. Eng. A, vol. 241, no. 1–2, pp. 48–59, Jan. 1998. [8] W.-S. Lee, T.-H. Chen, C.-F. Lin, and N.-W. Lee, “High strain rate shear deformation and fracture
behaviour of biomedical titanium alloy,” Mater. Sci. Technol., vol. 26, no. 9, pp. 1079–1087, Sep. 2010. [9] W.-S. Lee and H.-F. Lam, “The deformation behaviour and microstructure evolution of high-strength
alloy steel at high rate of strain,” J. Mater. Process. Technol., vol. 57, no. 3–4, pp. 233–240, Feb. 1996. [10] B. Roebuck, J. D. Lord, M. Brooks, M. S. Loveday, C. M. Sellars, and R. W. Evans, “Measurement of
[11] B. Blocks, “Standard Practice for Compression Tests of Metallic Materials at Elevated Temperatures