Rochester Institute of Technology
RIT Scholar Works
Theses Thesis/Dissertation Collections
12-2013
A Novel Work-Sharing Protocol for U-Shaped
Assembly Lines
Srinath Sriram
Follow this and additional works at:http://scholarworks.rit.edu/theses
This Thesis is brought to you for free and open access by the Thesis/Dissertation Collections at RIT Scholar Works. It has been accepted for inclusion in Theses by an authorized administrator of RIT Scholar Works. For more information, please [email protected].
Recommended Citation
ROCHESTER INSTITUTE OF TECHNOLOGY
A Novel Work-Sharing Protocol for
U-Shaped Assembly Lines
A Thesis submitted in partial fulfillment of the requirement for the degree of Master
of Science in Industrial Engineering in the Kate Gleason College of Engineering
Industrial and Systems Engineering Department
SRINATH SRIRAM (RIT Student)
DEPARTMENT OF INDUSTRIAL AND SYSTEMS ENGINEERING
KATE GLEASON COLLEGE OF ENGINEERING
ROCHESTER INSTITUTE OF TECHNOLOGY
ROCHESTER, NEW YORK
CERTIFICATE OF APPROVAL
M.S. DEGREE THESIS
The M.S. Degree Thesis of Srinath Sriram has been examined and approved by the committee as
satisfactory for the thesis requirement for the Master of Science degree
Approved by:
________________________________
Dr. Andres L. Carrano, Thesis Advisor,
Associate Professor, Department of Industrial & Systems Engineering, RIT
_________________________________
Dr. Michael E. Kuhl, Committee Member,
Professor, Department of Industrial & Systems Engineering, RIT
_________________________________
Dr. Brian Thorn, Committee Member,
Acknowledgements
This thesis work was by no means the work of an individual. I would like to thank everyone
involved - directly, or indirectly.
Dr. Andres Carrano, without whose support and guidance, this work would not have seen the light
of day. His adherence to the scientific method in all aspects - including critique and advice - made
me realize what a master’s thesis entails. Dr. Kuhl and Dr. Thorn, both experts in their own fields,
for taking the time out of their busy schedules to answer my questions. Dr. Kuhl’s simulation class
was one of the inspirational forces behind my choice of methodology for this thesis. My parents
and brother, without whose efforts, well wishes, nourishment, and love, I wouldn’t be here today.
Prof. John Kaemmerlen, whose inspiration, guidance, and teachings gave legs to my career. My
friends, roommates, and colleagues who were there with me and for me throughout this journey.
All the Toyota lab assistants and volunteers who participated in the experiments for their help and
support
Last, but not the least, Manuel Tolentino, and the anonymous Mr.E, for their help in simulation,
Abstract
Companies worldwide try to employ contemporary manufacturing systems that can cope with
changes in external competitive environments and internal process variability. Just In Time (JIT)
philosophy helps achieve the required resilience by its policy of having people, machines, and
material just-in-time for any given process. U-shaped assembly lines (U-lines) are used to
implement JIT principles. Another principle that helps achieve competitive advantage by
developing a flexible workforce that responds efficiently to change is that of work-sharing.
Operators share work and help each other in a dynamic and floating way, requiring little
management effort to distribute workload amongst operators, or balance the assembly line.
The aim of this thesis work is to develop an effective work-sharing protocol for U-shaped
assembly lines that will provide the combined advantages of U-lines and work-sharing principles.
The new protocol is based on two ideas from literature - the Cellular Bucket Brigade (CBB)
system, and the Modified Work-Sharing (MWS) system. To keep the focus on developing the
protocol, the scope of this work was limited to two worker systems. The methodology used is to
model the protocol and U-line system as a discrete event simulation model, and then use an
optimization model to maximize throughput and find optimal buffer locations and levels. A
physical simulation experiment was conducted in the Toyota Production Systems lab at RIT to
validate the model. Once validated, computer simulation experiments were run with industry data,
and results obtained were compared with existing protocols from literature.
It was found that the new protocol performed at least as well as the CBB protocol, improving the
output by an average of 1%, for the scenarios tested. Increase in processing speed variability as
well as larger variation among workers were found to negatively impact the performance of the
ii
why there are anomalies and patterns, or lack thereof. Finally, limitations of the protocol, and
opportunities for future research in the field are presented. Major limitations of the protocol are
that it is difficult to comprehend, and the assumption of an assembly line divided into equal tasks
iii
Contents
List of Figures v
List of Tables vii
1. Introduction 1
2. Background 3
2.1 Just in Time (JIT) Production System 3
2.2 Traditional assembly lines 4
2.3 U-shaped assembly lines 4
2.4 Work-sharing and self-balancing lines 6
3. Literature Review 13
3.1 Work-sharing methods in linear assembly lines 13
3.2 Cellular bucket brigades 18
3.3 The U-line balancing problem and worker allocations 22
3.4 Research Gap 24
4. Problem Statement 26
5. Methodology 27
5.1 Definitions and Assumptions 28
5.2 Stage I: Developing a new protocol 34
5.3 Stage II: Comparative Experiments to Analyze performance 68
6. Results and Analyses 69
6.1 Screening Experiments 69
6.2 Main Experiments 79
6.3 Generalized Results 98
7. Conclusion 102
8. Future Work 104
iv
Appendix I
Appendix I: IRB approval form I
Appendix II: Snapshots of ARENA models II
Appendix III: Data from secondary experiments V
Appendix IV: Optimal control levels data from secondary experiments VII
v
List of Figures
Figure 1: A traditional assembly line with five workstations and fiveoperators. ... 4
Figure 2: A U-line with three workers and five workstations (M = 5, N = 3) ... 5
Figure 3: A traditional assembly line with three stations containing three tasks each, and three operators ... 7
Figure 4: A self-balanced bucket brigade line reaching balance ... 8
Figure 5: 3 Operators working in their 'zones' in a 6 station line with 2 buffers ... 9
Figure 6: A balanced bucket brigade system of nine tasks, three workstations, and three workers ... 14
Figure 7: The MWS system for a three worker - six station line with two buffers (B1 and B2) ... 16
Figure 8: Expected throughput as a function of learning process (source: Montano et al.2007) ... 17
Figure 9: A cellular bucket brigade. The paths of workers i and i+1 between two successive exchanges (at xit and xit+1) are shown. Source: Lim (2011). ... 19
Figure 10: (a) Comparison of serial BB with cellular BB for different aisle widths. (b) Aisle width vs number of workers plot. Source: Lim (2011). ... 22
Figure 11: Methodology flowchart ... 27
Figure 12: A 6 station 3 worker U-line in which the entire process is divided into 24 with workers having equal work velocities v1= v2 = v3 and aisle walking velocity w ... 29
Figure 13: An example of the location of buffers introduced in the 6 station U-line (M=6) shown in Figure 12 ... 30
Figure 14: Schematic of a six station, two workers U-line, with seven buffers and control levels. ... 36
Figure 15: Example case: When A and B drop their jobs at buffers 2 and 6 respectively by following the MWS protocol ... 37
Figure 16: Example case: When A drops job at B2, B is at task 12. ... 38
Figure 17: Example Case: When steady state is reached ... 39
Figure 18: Example case: Exchange at tasks 6 and 18 when worker B lags behind due to variable processing times ... 40
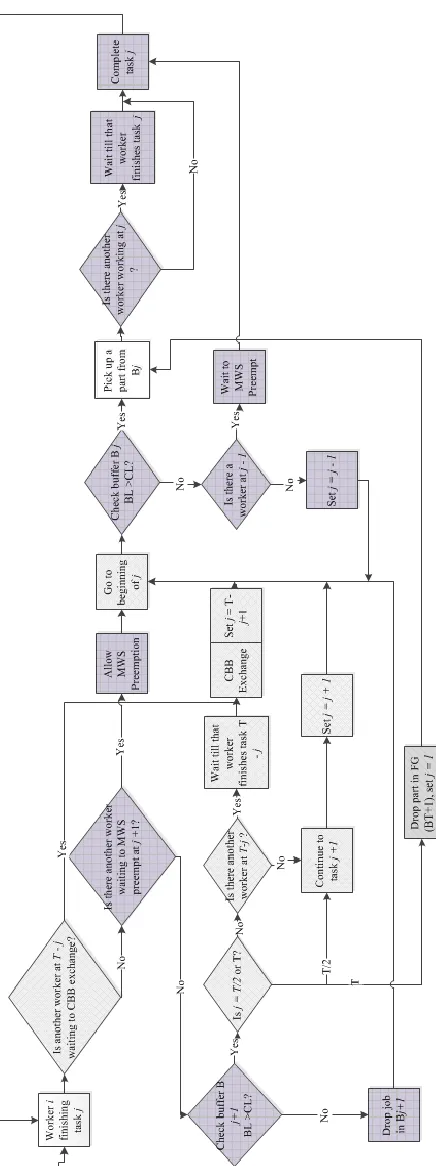
Figure 19: Flowchart showing the new protocol for a two worker U-line system to be followed by worker i, starting from task j ... 44
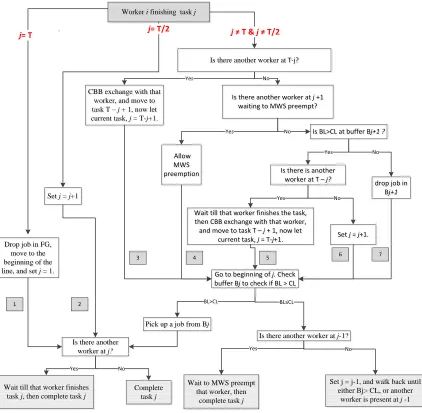
Figure 20: Protocol flowchart starting from the location of the worker. Seven different paths or branches (possible scenarios) of the protocol are shown. ... 45
Figure 21: Flowchart showing logical flow of entities inside a task submodel ... 51
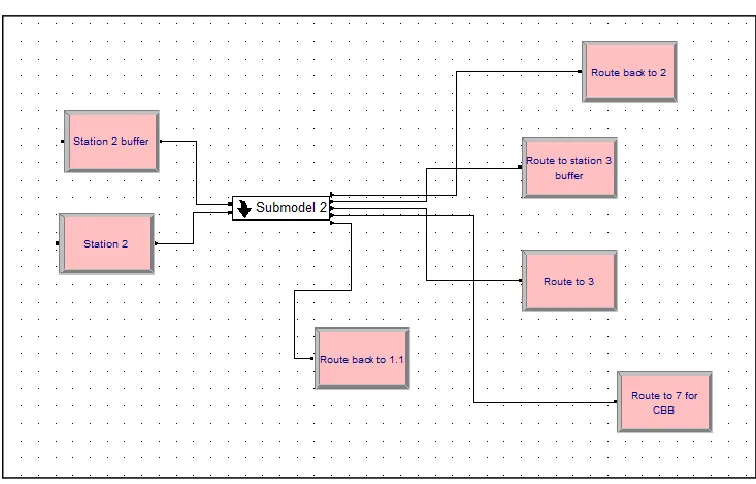
Figure 22: Submodel for the task 2 in the 8 tasks model, showing station and route modules ... 51
vi
Figure 24: Screenshot of the controls screen in OptQuest. The selected variables are included in the
optimization model for a 8 task system. The bounds for these controls can be seen here. ... 55
Figure 25: Final settings screen in OptQuest ... 56
Figure 26: The experimental setup in the Toyota Lab at RIT with two volunteers assembling Legos on either legs of the assembly line ... 59
Figure 27: Completed Lego assembly block at the finished goods location, on a plastic pallet used as a carrier. ... 60
Figure 28: Schematic of the experiment, showing one exchange position ... 63
Figure 29: Volunteer in the second leg of the assembly line waiting to perform CBB exchange after task 16 ... 63
Figure 30: After A drops the part in buffer 1 and B drops the part in buffer 2 and B MWS preempts A at buffer 1. ... 66
Figure 31: When B crosses the buffer ... 67
Figure 32: After CBB exchange at 5, 11 ... 67
Figure 33: Half normal plot of standardized effects (α = 0.99) for New Protocol Th data for 8 tasks model. ... 73
Figure 34: Main Effects plot for New Protocol Th for the 8 tasks model... 73
Figure 35: Interactions plot for factors A and D for New Protocol Th data for the 8 tasks model ... 74
Figure 36: Half normal plot of standardized effects (α = 0.99) for the 16 tasks model ... 77
Figure 37: Main Effects plot for the 16 tasks model ... 77
Figure 38: Main Effects plot for 8 tasks model... 85
Figure 39: Interaction Effects plot for 8 tasks model ... 86
Figure 40: The interaction effects plot for the CBB system in the 16 tasks model with data from Table 16 89 Figure 41: Main Effects plot for 16 tasks model... 92
Figure 42: Interaction Effects plot for 16 tasks model ... 93
Figure 43: Main Effects plot for 24 tasks model... 97
Figure 44: Interaction Effects plot for 24 tasks model ... 98
Figure 45: Main effects of Factor A, Gamma distribution CV ... 99
vii
List of Tables
Table 1: Data of 32 U-lines compiled from three local manufacturing companies ... 47
Table 2: Scope of the thesis ... 49
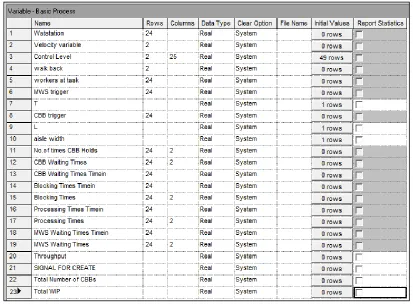
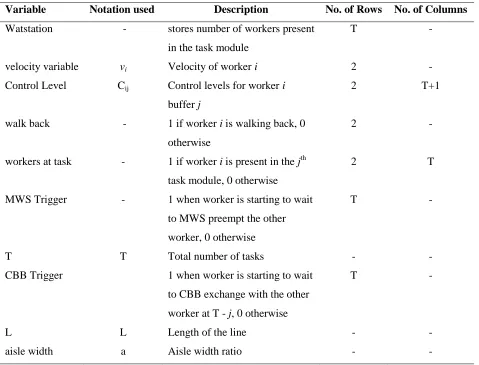
Table 3: Description of important variables used in the simulation model ... 53
Table 4: Values of factors (measured and calculated) that were used for the validation experiment ... 62
Table 5: Screening Experiment Levels ... 70
Table 6: Full Factorial treatment combinations of the screening experiment ... 70
Table 7: Results of Screening Experiment: 8 tasks ... 72
Table 8: ANOVA table from Minitab for 8 tasks screening experiment ... 74
Table 9: Results of Screening Experiment: 16 tasks ... 76
Table 10: ANOVA table from Minitab for 16 tasks screening experiment ... 78
Table 11: Factors and Levels for the secondary experiment ... 80
Table 12: Treatment Combinations for the secondary experiment ... 80
Table 13: Results of Main Experiment: 8 tasks ... 81
Table 14: Results from the secondary experiment - 8 tasks model ... 82
Table 15: Average number of CBB exchanges that occur between task pairs: 8 tasks case ... 83
Table 16: ANOVA table from Minitab - 8 tasks model... 85
Table 17: Number of Optimal Solutions for the 8 tasks case screening experiment ... 87
Table 18: Results from the secondary experiment - CBB comparison, 16 tasks model ... 88
Table 19: CBB Exchanges and Efficiency Data for 16 tasks model ... 88
Table 20: Average number of CBB exchanges that occur between task pairs: 16 tasks case... 90
Table 21: Table showing number of Optimal Solutions for the 16 tasks case screening experiment ... 91
Table 22: ANOVA table from Minitab - 16 tasks model... 91
Table 23: Results from the secondary experiment - CBB comparison, 24 tasks model ... 94
Table 24: Results from the secondary experiment - CBB comparison, 24 tasks model ... 94
Table 25:Average number of CBB exchanges that occur between task pairs: 24 tasks case... 95
Table 26: Table showing number of Optimal Solutions for the 16 tasks case screening experiment ... 96
1
1. Introduction
In today's competitive world, manufacturing companies are constantly trying to increase their
productivity with the same amount of resources. They also find the need to make their systems
flexible to counter external demand variability, while dealing with internal process variability.
Reducing idle time of a limiting resource is the key to increased productivity (McClain, Schultz &
Thomas, 2000). When labor is the limiting resource in a production facility, work-sharing is one
way to reduce idle time (McClain et al., 2000). U-shaped assembly lines (U-lines) are another
option that companies turn to when they try to increase their productivity without increasing their
resources. After reviewing existing literature, a research gap was identified in the area of
developing a work-sharing methodology or protocol for U-shaped assembly lines. This work
proposes a new protocol for two worker U-lines in which buffers (temporary storage locations
within the assembly line) are employed in an existing protocol.
One of the ways that companies try to reduce idle time is by following the Just In Time (JIT)
philosophy. The JIT philosophy is a policy of having men, machine and material arrive and leave
just-in-time for any given process. JIT philosophy can be considered a subset of the ‘Lean
Principles’, also known as the Toyota Production System (Hopp & Spearman, 2008). U-lines are
used to implement these JIT principles (Hopp & Spearman, 2008). Miltenburg (2001) claims that
the productivity improved in companies by an average of 76%, WIP dropped by 86%, lead time
shrunk by 75% and defective rates dropped by 83% when U-lines replaced linear assembly lines
without increasing the workforce. Another principle that helps companies achieve competitive
advantage (by developing a flexible workforce that can respond to changes quickly) is that of
work-sharing. As it focuses on utilizing workers more efficiently and nurturing team work,
2
work amongst workers (Ghiram, 2012). In these systems, workers share work and help each other
in a dynamic and floating way.
The bucket brigade system is based on this idea of sharing work. This system lists a set of rules
that these workers should follow while working on the assembly line, proposed by Bartholdi &
Eisenstein (1996). The modified work-sharing (MWS) system (introduced in Montano et.al. 2007)
builds on the Bucket Brigade system and explores the option of having inventories between
workstations, so that the probability of a worker being blocked by his/her downstream neighbor is
reduced. Cellular Bucket Brigades (CBB), proposed by Lim (2011) seeks to reduce the
unproductive walking time of workers in a bucket brigade by considering a linear assembly line
bent in half, so that workers can exchange work across the aisle based on a set of rules. This
system, in effect, is a U-shaped assembly line using a work-sharing protocol. But, this system too
has its flaws: it requires the aisle width to be less than 4% the entire length of the line (which may
not be practical) and assumes a continuous assembly line. In addition to these flaws, there is a gap
in literature in the area of a self-balancing protocol for U-lines that accommodates discrete tasks
and stochastic processing times. This thesis aims to address this gap by developing a new
work-sharing protocol for U-shaped assembly lines by creating a simulation model in ARENA (a
discrete event simulation software) and then comparing the performance of this new protocol with
existing protocols. The new protocol will utilize the cellular bucket brigade system and also
capture the effectiveness of using buffers ( as in the MWS system). Section 2 provides a
background of the topics, section 3 is a detailed review of existing literature, section 4 outlines the
problem statement, section 5 describes the methodology used to attack this problem, section 6
explains the results and conclusions that were drawn, and section 7 speaks to the scope of future
3
2. Background
The sections in this chapter introduce the background concepts such as the Just In Time (JIT)
production system, traditional assembly lines, U-shaped assembly lines, contemporary solutions,
and relevant work-sharing protocols and principles.
2.1 Just In Time (JIT) Production System
The JIT production system is a set of principles, rules and ideas which are essentially a subset of
the principles that form the lean manufacturing system. The main idea being that people, machines
and materials should ‘arrive’ and ‘leave’ just-in-time for any given process. This tends to eliminate
waste – in terms of time, material and resources. Companies worldwide try to achieve this by
employing a flexible manufacturing system (and hence a flexible assembly line) that can cope with
changes in the external competitive environments. Research suggests that there are several reasons
why JIT manufacturing systems are able to cope with these external changes, including
cross-trained multi-functional workers and efficient facility layouts (Miltenburg, 2001). Due to its wide
range of advantages, JIT has been increasingly gaining interest by many manufacturing companies.
Some benefits of JIT production systems (Hopp, 2008) are:
1. WIP reduction
2. Increased Quality
3. Increased productivity
4. Reduced space requirements
4 6. Lower overheads
7. Increased employee motivation.
2.2 Traditional Assembly Lines
An assembly line typically consists of a sequence of workstations through which the product is
processed from Raw Materials (RM) to Finished Good (FG). The product remains for a certain
time at each station, during which a group of tasks are performed; and workers are assigned to
different stations. Traditionally, as designed by Henry Ford in 1915, assembly lines are arranged in
a straight line (Miltenburg, 2001), i.e. raw materials arrive at one side of the line and finished
goods are produced at other end. In this case, each worker may be assigned to one workstation or
multiple workstations.
Figure 1: A traditional assembly line with five workstations and fiveoperators.
2.3 U-Shaped Assembly Lines
A layout or design that is widely used in the JIT system is the U-shaped assembly line U-shaped
cells are more flexible to changes in demand and production in comparison to traditional assembly
lines. Moreover, the number of workers can be lower in JIT systems, since multifunctional
5
On the other hand, in U-lines, the material enters and exits on each end of the U. Hence, raw
materials arrive into the line and finished goods depart from the line on the same side of the
assembly line. As in traditional assembly lines, workers may be assigned to one more
workstations, but, the U-shape allows for flexible worker-workstation assignments (Miltenburg,
1994). Workers may cross-over from one leg to the other leg of the U-line. Workers are
multi-skilled and cross trained to work in different ‘zones’ of the line. Figure 3 is an example of a U-line.
In this case, there are three workers (A, B, and C) and five workstations ( M represents the
number of workstations and N the number of workers). Worker A is assigned the first and fifth
[image:16.612.225.417.319.419.2]workstations and hence requires a cross-over.
Figure 2: A U-line with three workers and five workstations (M = 5, N = 3)
Miltenburg (2001) notes from surveying U-lines in 114 companies in the US and Japan that the
average U-line has 10.2 machines and 3.4 operators. The paper also states that when U-lines were
employed in a company that used traditional lines previously, productivity improved by an average
of 76%, WIP dropped by 86%, lead time shrunk by 75% and defective rates dropped by 83%. The
following are some of the potential advantages of U-lines over traditional lines and the reasons for
their popularity (Miltenburg, 1994 and Miltenburg, 2001):
The input and output of the line are both close to shipping – reduces transportation of
6
Lower inventories between stations
Simpler material handling processes.
Easier production planning and control
Opportunities for problem solving
Visibility and Communications are improved because of the close proximity of
operators to each other
Multi-skilled operators make the workers to stations assignments more flexible and
hence, assignments can be changed more easily when production rate needs to be
altered or if a bottleneck is encountered.
The number of workers required on a U-line is usually not more than that required on a
standard/traditional line.
2.4 Work Sharing and Self-Balancing Lines
In a traditional assembly line, each station (the term "station" is used synonymously with
"workstation") is manned by one worker or operator and that worker is specifically assigned to that
station. In a work sharing environment, the number of operators is less than or equal to the number
of work stations (N ≤ M). More importantly, each worker is not restricted to one station – he or she
is cross trained to work in multiple stations ahead and/ or behind his station. This helps the worker
share work with co-workers, thereby reducing the waiting time and number of jobs in process by
taking advantage of extra capacity of faster workers. These types of assembly lines are often called
‘self-balancing’ lines. These lines are balanced automatically as the line runs - when the operators
follow a set of rules, known as a protocol. The most researched work sharing systems in literature
that provide such rules or protocols are the bucket brigade system, the modified work-sharing
7
2.4.1 Bucket Brigades
The first practical implementation of the bucket brigades was made in the textile industry, in the
1970s, under the name of “Toyota Sewn Products Management System” –TSS for short (Bratcu &
Dolgui, 2005). In bucket brigades, each worker continues to process his job (while walking
downstream) until he or she is stopped by his or her successor who then takes the job from him and
continues downstream. This worker then moves upstream until he/she in turn pulls from his/her
predecessor, and so on. This process of pulling or handing over an incomplete job is known as
preempting. There are certain rules that the workers follow to reduce waiting time. Bratcu &
Dolgui (2005) present a survey of bucket brigades covering its history in detail.
Task 1 task 2 task 3 Task 4 task 5 task 6 Task 7 task 8 task 9
OP 1 OP 2 OP 3
STATION 1 STATION 2 STATION 3
Figure 3: A traditional assembly line with three stations containing three tasks each, and three
operators
The rules that workers follow in this system are presented in Bartholdi (1996) as follows:
Forward Rule: Continue processing the job in your hand on successive workstations, moving
downstream until your successor takes over the work from you or you (in the case of the last
worker) reach the end of the line. Then give up the job and follow the backward rule. Never skip
8
OP 1 OP 2 OP 3
Task 1 Task 2 Task3
Handover point 1 Handover point 2
Task 4 Task 5 Task 6 Task 7 Task 8 Task9
Figure 4: A self-balanced bucket brigade line reaching balance
Backward Rule: Walk back and take over the item of your immediate predecessor and follow the
forward rule. If you are the first worker, start a new job and move downstream.
These rules also form the backbone of the Modified Work Sharing (MWS) system (Montano et al.,
2007), and the cellular bucket brigade protocol (Lim, 2011). Bartholdi & Eisenstein (1996) proved
mathematically that when the TSS (or the bucket brigade) line reaches a state of self-balance when
these rules were followed and provided the workers are sequenced from slowest to fastest, the
following results hold true:
There exists a fixed point such that if the workers start at positions x*, then they will always reset
to position x*, i.e. balance is always possible (the two lines in Figure 4 are examples of these
points).
If the workers are sequenced from the slowest to the fastest, then there exists a unique fixed
9
If worker velocities (velocities at which workers process the job while moving downstream
in the assembly line) are constant and this order (from slowest to fastest worker) is
maintained, the production rate is the largest possible.
If the workers are not arranged in this fashion, the fixed point could act as a ‘repeller’, so
that if the system ever deviates, however slightly from that point, then the system
inexorably diverges from it.
2.4.2 Modified Work Sharing System (MWS system)
The MWS system (described in Montano, Villalobos, Gutierrez, & Mar (2007)) is a slight
modification of the bucket brigade system. Montano et al. (2007) suggest placing ‘buffers’ or
inventory locations between ‘zones’. Each worker primarily works in his or her zone – a series of
workstations for which the worker is trained. Instead of being preempted by the worker’s
successor, the worker drops off the job in a buffer located at the beginning and end of each zone.
Each buffer has a pre-assigned control limit for each worker. That is, each worker can only deposit
up to a fixed number of parts in each buffer.
Figure 5: 3 Operators working in their 'zones' in a 6 station line with 2 buffers
When the number of parts in the buffer is equal to the control limit, the worker picks a job from
10
buffer at the beginning of his zone becomes zero, he moves upstream to pull from his predecessor.
The general rules that the workers are required to follow in this system are:
While moving downstream:
Advance processing the part downstream until encountering a control buffer or being
preempted by a downstream operator.
If a buffer is encountered and the number of parts in that buffer is equal to or greater than
the operator’s control number for that buffer, continue processing the current part until
encountering the next buffer or being preempted, otherwise deposit the part in the buffer
and return upstream.
If the control number for a buffer is zero leave the part in the buffer and start the upstream
motion
While moving upstream:
When advancing upstream if an operator is encountered, preempt that operator by taking
the part being processed by this operator and continue processing downstream. Otherwise,
continue advancing upstream until a buffer is encountered.
If the buffer contents are equal to the operator’s control level or less, continue advancing
upstream.
If the buffer contents are greater than the operator’s control level, take a part and start the
11
If the operator reaches the upstream limit of his or her work zone and there are no parts in
the control buffer stay idle until a part becomes available.
2.4.3 Chaining
Chaining, as explained by Gong, Wang, & Zhang (2011), is similar to the MWS system in the
sense that workers work in zones. But these zones overlap each other and there are no buffers. The
main advantage of such overlapping zones over the traditional bucket brigades is that it
significantly reduces the cross training of workers by limiting how far they can overlap with each
other. While in Bucket Brigades all the workers have to be fully cross trained, chaining just
requires each worker to be trained in one station downstream and one station upstream of his zone.
Practical applications of the chaining protocol have been reported to reduce the WIP in the line
that tends to accumulate in the MWS system (Gong, 2011).
2.4.4 Advantages of self-balancing lines over traditional lines
Some of the benefits of the self-balancing systems such as the bucket brigades and MWS over
traditional assembly lines, as detailed in archival literature ( Bartholdi & Eisenstein (1996), Bratcu
& Dolgui (2005) and Ghiram (2012)) can be summarized as follows:
The need for planning and management, and balancing the line over and over again is
reduced considerably in self-balancing lines. Traditional lines often require re-balancing
when the demand rate changes, when there is a different mix of products, when there is
considerable and frequent worker turnover etc. (Bratcu & Dolgui, 2005).
Self-balancing lines are more flexible and agile. The throughput of the system can be
changed by simply adding or removing an operator in the line. The line is also more ready
12
The throughput is increased in most cases, because self-balancing lines spontaneously
generate the optimal division of work, taking advantage of the faster workers - who tend to
take up more share of the work (Ghiram, 2012).
Though training of workers in traditional lines is easier, coordination of the workers is
made easy in self-balancing lines because it is easy for workers to know what to do next.
The workers also benefit from each-others’ knowledge and experience, in a way receiving
more training (Ghiram, 2012).
In traditional lines, each operator is focused only on the worker’s unique standard amount
of work content and is hence restricted to the worker’s workstation. In self-balancing
processes, the workers are made to work together as a team – which boosts worker morale,
improves communication between them, and allows them to learn from each-others’
experience (Ghiram, 2012).
In Ghiram (2012), self-balancing lines are claimed experientially to be better over traditional lines
from a management perspective. The classic approach works well if the company has (or has
committed to developing) a complete lean management system that responds to problems every
takt time because it seeks to force leveling and takt-pacing. However, since most organizations do
not have the management capacity to respond every cycle time, Self-Balancing proves an
extremely efficient and effective delivery method while they work to develop the management
support systems. Ghiram (2012) considers self-balancing lines as the means to achieve true lean
continuous flow, as the focus of trouble shooting is more on the stoppage of material flow and
waiting of workers than being worker-process centric. Ghiram (2012) also highlights the benefits
of self-balancing and claims that some benefits will be realized over time as the people involved
13
3. Literature review
The literature that was reviewed for this thesis is detailed in this section under three topics:
work-sharing methods in linear assembly lines, cellular bucket brigades (linear assembly lines bent in half
to resemble U-lines) and the U-line balancing problem. These three topics are discussed in sections
3.1,3.2 and 3.3 respectively. In section 3.4, the gap that was identified in this section is explained.
3.1 Work-Sharing methods in linear assembly lines
In this section, two important work-sharing methods in literature that are relevant to this thesis
topic are reviewed: the Bucket Brigades system (section 3.1.1) and the Modified Work-sharing
System (section 3.1.2). In each section, the protocols that the workers follow in these systems are
explained, and their benefits and drawbacks are analyzed. Other work-sharing systems that have
surfaced during this literature review are mentioned in section 3.1.3.
3.1.1 Bucket Brigades
One of the first papers in the field of the bucket-brigade system of work-sharing was that of
Bartholdi & Eisenstein (1996). This paper explains succinctly the forward and backward rules that
every worker is required to follow independently for a bucket brigade system to work in a serial
assembly line. Although these rules and postulates hold true for the model, the real world scenario
is a contrast to the assumptions made in this paper. The authors assume that all the work is done in
deterministic times– providing no room for variations in the process which occur often in a real
manufacturing environment – and assume instantaneous walk-back, i.e. it takes the worker no time
14
OP 1 OP 2 OP 3
Task 1 Task 2 Task3
Handover point 1 Handover point 2
Task 4 Task 5 Task 6 Task 7 Task 8 Task9
Figure 6: A balanced bucket brigade system of nine tasks, three workstations, and three workers
The authors also consider workers with a large variation in their work-velocities. While this may
hold true for the apparel industry that the authors have collected data from, it may not hold true for
other industries where the workforce is mostly at the same skill level. They also assume
continuous work handover i.e. the jobs should be immediately preempted and transferred (when
preemption is invoked according to the rules). This has been a cause of a variety of quality issues
(Armbruster & Gel, 2006).
The deterministic assumptions in Bartholdi & Eisenstein (1996) were relaxed to accommodate
stochastic processing times in other extension papers. Bartholdi, Eisenstein, & Foley (2001) have
proved by convergence analysis in topographic spaces that the more the number of work stations in
a stochastic system, the more its behavior will tend to the behavior of a deterministic one
(assuming the order of workers does not change). An exception to this rule was observed when the
number of workstations is almost equal to the number of workers. It is to be noted that the
optimality of the ordering of workers from slowest to fastest has not yet been proved for the
15
number of workers are more than the number of stations, also considers identical worker
velocities.
Another cause for concern is when the a worker placed upstream ‘catches up’ to a worker placed
more downstream. This leads to certain amount of waiting experienced by the upstream worker.
This scenario is commonly referred to as "blocking". Lim & Yang (2009), attempted to find
policies that maximize the throughput of the line for a given work distribution on stations to avoid
the blocking scenario. They found that the sequencing of workers from slowest to fastest
outperforms other policies for most work distributions except for some cases (such as when the
work content for the 1st station is much larger than the work content for the 2nd station). In these
cases, limiting workers to zones provided higher throughput.
To counter variability in the processing times in a bucket brigade, temporary buffers may be used
in the system. Although this could increase the WIP in the system, it may considerably reduce the
cost caused by other factors such as waiting and blocking. McClain, Schultz, & Thomas (2012),
observe that when worker velocities are nearly equal, even when the machine-to-worker ratios are
high, bucket brigades perform poorly (lower throughput, more waiting etc.) ; the ‘drop off’ rule
performs better in this case. This paper mainly focuses on environments in which processing time
variability challenges the flexibility of the system and low machine-to-worker ratio limits the
amount of sharing that is possible.
3.1.2 Modified Work-sharing System (MWS)
The MWS system is a slight modification of the bucket brigade system (Montano, Villalobos,
Gutierrez, & Mar (2007)). Montano et al. (2007) suggest placing ‘buffers’ or inventory locations
16
which the worker is trained. Instead of being preempted by the worker’s successor, the worker
drops off the job in a buffer located at the beginning and end of each zone. Each buffer has a
pre-assigned control limit for each worker. Figure 7 illustrates these zones. Buffers B1 and B2 will
each have 3 separate buffers – one for each operator. Thus, each worker can only deposit up to a
certain fixed number of parts in each buffer. When the number of parts in the buffer is equal to the
control limit, the worker picks a job from that buffer and starts processing it downstream from his
zone. And when the control level of the buffer at the beginning of his zone becomes zero, the
worker moves upstream to pull from his/her predecessor.
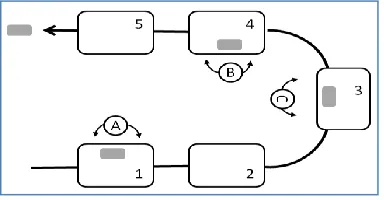
Figure 7: The MWS system for a three worker - six station line with two buffers (B1 and B2)
The control level is represented as Cij, where i denotes the buffer location and j denotes the
operator for whom the control level applies. For example, C11 = 3means that the control level for
operator 1 in buffer 1 would be 3. In Figure 7 (from Montano et al., 2007), the dashed lines
represent the zones for each operator. The authors suggest that these zones can be accomplished
with the following values of control levels:
C11 = a C21 = ∞
C12 = 0 C22 = b
17
It can be noted that a worker in MWS will move forward processing the part as much as possible,
but the amount a worker can advance is limited by both, the potential preemption by the
downstream worker, and by the control buffer levels encountered as the worker moves
downstream.
It can also be observed that this system would behave in one extreme as a bucket brigade system if
all the control levels are 0, and would behave as a traditional system (with almost constant WIP, or
a balanced line) in the other extreme. The flexibility offered by this buffer system changes the pure
pull system of a bucket brigade to a combination of push and pull systems. Montano et al. (2007)
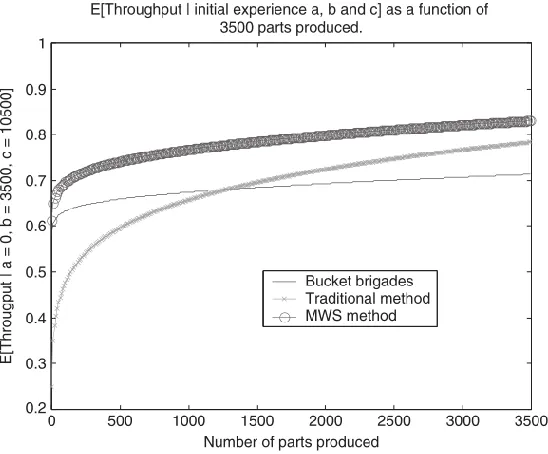
model this MWS system in a similar fashion to the bucket brigades, and draw comparisons (Figure
[image:28.612.169.443.360.587.2]8) between the them.
Figure 8: Expected throughput as a function of learning process (source: Montano et al.2007)
They conclude that the MWS method is a good alternative for use in high labor turnover
18
represent a major investment. However, both the latter conditions of fully cross trained operators
and cheap replicate tooling are not often found in real-world manufacturing.
3.1.3 Other work-sharing systems in literature
Jordan et.al (2004) analyzes the traditional cross-training policy of chaining, in which the worker
is trained in the tasks of the next station apart from his own. This helps when the worker next to
this worker lags behind, and also when the throughput has to be sustained in cases of worker
absenteism. Gong et al.(2011) introduces a new workforce cross-training policy for U-shaped
assembly lines by improving the traditional chaining policy. The paper suggests that rather than
training the workers to perform tasks only next in sequence to his task, they should be trained to
perform tasks before and after their own task. This will make the system much more flexible and
balanced when absenteeism occurs. Experiments were conducted to compare the traditional
training policy with the new training policy and it was found that the new policy produced better
throughput and more flexibility. This work does not present a comparison with the bucket brigade
or any other work sharing system. The workers could still be starved when the previous worker
lags behind significantly. Unlike in the MWS system, the preemption rules are not used in chaining
and hence, the workers may have more idle time, leading to less throughput and lower efficiencies.
3.2 Cellular Bucket Brigades
Lim (2011) suggests a new design for bucket brigades that reduces unproductive walk back time,
claiming up to 30% improvement in throughput when compared to a bucket brigade system. The
design (as shown in Figure 9) consists of a serial line folded in half. In the first half of the line,
workers process the work forward, then at the end of the line carry the work over to the second
19
traditional U-line, the beginning and end of the assembly line are right next to each other. The two
[image:30.612.116.546.133.214.2]halves of the line are also called as the two ‘legs’ of the U-line.
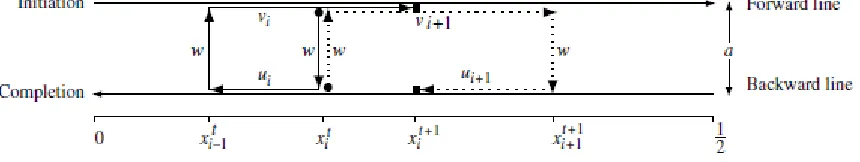
Figure 9: A cellular bucket brigade. The paths of workers i and i+1 between two successive exchanges (at xit and xit+1) are shown. Source: Lim (2011).
The author models this design and proposes new rules for the workers to follow:
Work Forward (on first-half of the line): Continue to process the job forward until one of the
following happens:
1. You are preempted by your successor, then exchange jobs with him and then work
backward on the second-half of the line.
2. You reach the end of the forward line if you are the last worker, then carry the job to the
second-half of the line and continue to work backward on the same job.
3. You catch up to your successor working forward, then slow down and continue to process
job at his pace.
4. You catch up with your successor who is crossing the aisle (from forward to backward
line), then wait.
Work Backward (on the second-half of the line): Continue to process your work until one of the
20
1. You preempt your predecessor who is working on the forward line and exchange work with
him/her and then continue to work forward
2. You complete your job at the end of the backward line (if you are the first worker),
cross-over and initiate a new item
3. You catch up with your predecessor while crossing the aisle, then wait.
4. If you catch up with him on the same aisle, slow down and continue working the job at the
worker’s velocity.
Waiting rules: Continue carrying your item
1. If you are on the forward line, remain idle until your successor has finished crossing the
aisle, then work forward
2. If you are on the backward line, remain idle until your predecessor has finished crossing
the aisle, then work backward.
Analysis of the protocol using the model presented in the paper shows that the waiting rule will
never be invoked under normal operation of a properly configured line. Let ‘a’ be the aisle width
for this line and ‘w’ be the velocity with which workers cross this aisle. Similar to the bucket
brigades (refer to Figure 9), there exists a fixed point x* (x is a real number between 0 and 1,
representing the position on the line. x will be between 0 and ½ for the forward line and between ½
and 1 for the backward line). If vi and ui are the forward and backward velocities of worker i, then
θi is defined as: θi = (1/vi + 1/ ui)-1. For this fixed point x*, the following holds true:
21
This point acts as the point of self-balance (i.e. x* is an attractor), provided the following condition
is satisfied:
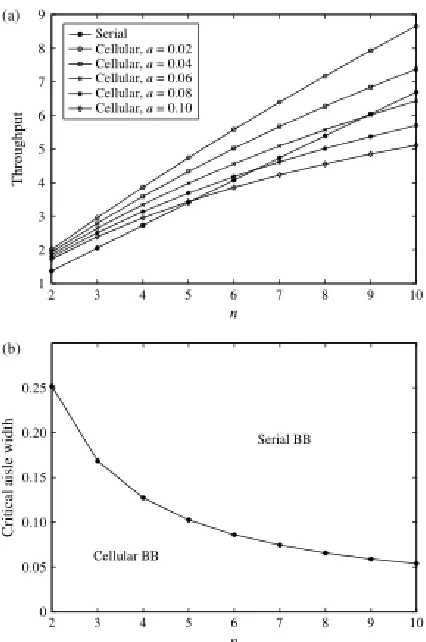
The throughput increases with the number of workers ‘n’, but the increase in throughput is less
than linear because of the corresponding increase in unproductive travel. On comparing serial
bucket brigades with this cellular system, the author finds that the cellular bucket brigade is more
productive than serial lines when the width of the aisle and/or number of workers are sufficiently
small (Figure 10).
From Figure 10, it is evident that the cellular bucket brigades perform better than serial lines when
a ≤ 0.04 (i.e. the aisle is less than 4% of the total length of the assembly line). This seems like an
unlikely situation, because the aisle has to be wide enough to accommodate workers while moving.
Similar to Bartholdi & Eisenstein (1996) , this paper has considered a real line model of an
assembly line. Although this is convenient for modeling and drawing results, it does not represent
the real world situation. In the real world, tasks are not usually continuously laid out on the
assembly line – a set of tasks is associated with each workstation. If cellular bucket brigades were
to be adapted for U-lines, the discrete nature of the line will have to be considered – each assembly
line consists of a certain number of fixed stations. Each of these stations (or locations of tasks) are
generally preferred to be completed by the same operator. Also, the complex nature of the rules
might confuse workers, who not only have to progress with their work, but are now also expected
22
drawback of this model is the assumption of deterministic processing times without taking into
consideration process variability.
Figure 10: (a) Comparison of serial BB with cellular BB for different aisle widths. (b) Aisle width vs number of workers plot. Source: Lim (2011).
3.3 The U-line balancing problem and worker allocations
The U-line balancing problem can be defined as the assignment of approximately same amount of
workload to each workstation or worker in a U-shaped assembly line, as well as assigning workers
to a set of workstations (as generally n<m). U-shaped line balancing problems have been
investigated since 1994 with the evolution of JIT.
Miltenburg (1994) investigated the line balancing problem for U-shaped lines. Purpose of this
[image:33.612.204.417.122.443.2]23
second is to prove that traditional line algorithms can be successfully adapted to new problems.
Other papers (Urban, 1998; Scholl & Klein, 1999; Gökçen & Agpak, 2006; and Erel, Sabuncuoglu,
& Aksu, 2001) have improved on Miltenburg’s balancing problem and have come up with
different approaches or have suggested improvements in the problem to solve the U-line balancing
problem. Most of the archival research investigated aims to minimize number of stations
(workers). Since they have adapted the linear assembly line approach and as each worker can work
on multiple stations in a U-line, they use the term ‘station’ to represent the set of work-stations that
each worker works in. Thus, making the number of stations equal to the number of workers. They
minimize the number of workers instead of physical work station, since a worker can work more
than one station in u-line.
All line balancing research has been done for stable environments. Difference between stable and
dynamic environment is the frequency of rebalancing. If rebalancing is required often due to
variations in production or demand, it is considered as a dynamic environment. Rebalancing
technique should be easy and less costly. Proposed algorithms from previous research require the
redesigning of work stations and task assignments at each station. Redesigning the cell from
beginning is still costly and time-consuming. Erin (2007) provides a more detailed research on the
U-line balancing problem literature.
Research in worker allocation aims to prove that optimizing workforce assignment is as essential
as line balancing itself. The majority of the research in line balancing focuses on the minimization
of the number of workers (stations) without considering walking times and waiting times.
However, it is not a practical approach in real life. Nakade and Ohno (1997) criticized Miltenberg
and Wijingard (1994) approach to U-line balancing problem - it only takes into account the
24
(1997) proposed Petri Net and GSMP theories to prove that reduction in variances of operation and
walking times of workers increases the throughput. In addition, throughput is same for reverse
system, as well. Nakade & Ohno (1999) proposed a model for deterministic walking and process
time cases. Erin (2007) also considers worker walking time. In this paper, first minimum number
of workers is determined under given cycle time, and then an optimal worker allocation with
minimum number of operators is proposed.
Nakade & Ohno (2003) worked on separate, and carousel type of allocations of workers using both
deterministic and stochastic times. Each worker was responsible for specific machine groups in the
separate system, while every worker was allocated to all machines in the carousel system. This
study showed that if workload between operators are same in separate allocation, system cycle
time is smaller than carousel allocation. However, if the difference is big between operators in
deterministic time, carousel allocation is better when time is stochastic. Erin (2007) provides a
table outlining the details of the literature in this field.
3.4 Research Gap
Very limited archival literature is currently available on bucket brigades in U-lines. Even fewer
have considered worker crossovers, stochastic processing times, and discrete tasks. Crossing over
of workers is one of the main advantages of the U-line and makes the U-line a more flexible
assembly line balancing problem as a larger set of worker to station assignments are possible
(Miltenburg, 2001). Considering stochastic processing times are important to take into account the
variability in the time it takes the worker to complete a task. Also, most of the literature available
in bucket brigades (specifically Bartholdi et al., 1996; Bartholdi et al.,1999; and Lim, 2011)
25
job. Few papers (Bartholdi et al., 2001; Montano et al., 2007) consider the discrete breakdown of a
process. This is nothing but breaking down the assembly line into a finite number of relatively
smaller tasks (or steps), as opposed to a continuous system, which can be conceived as breaking
down the entire assembly line into infinitesimally small tasks.. Although cellular bucket brigades
(proposed in Lim, 2011) comes close to addressing this gap in literature, it does not consider
process variability or the importance of preempting or exchanging only after a task is completed –
two important factors that contribute to the practicality of a protocol (outlined in Bratcu et
al.,2005; and Montano et al., 2007). On surveying three local manufacturing facilities, the
importance of these two issues was further strengthened. They considered it to be a quality related
best-practice to not divide a task between two workers, and practically imperative to consider
variations in task-times as inherent to the assembly line. Cellular bucket brigades also assume a
continuous assembly line and very small aisle widths (less than 10% only, with 4% being the
critical width), limiting its practicality.
Hence, a literature gap was identified in the area of a work-sharing protocol for U-shaped
assembly lines that considers discrete tasks and worker crossovers using stochastic processing
26
4. Problem Statement
The literature gap outlined at the end of the previous section specifically outlines
problems in contemporary work-sharing protocols that can be addressed. The objective of
this thesis is to develop a novel self-balancing work sharing protocol for two worker
U-shaped assembly lines that will accommodate:
1. Worker crossovers
2. Discrete tasks (i.e. no exchange/ preemption during a task)
3. Stochastic processing times
Specific sets of research questions that this thesis aims to answer are:
1. Can an effective work sharing protocol (that approaches self-balancing) be
developed for U-shaped assembly lines? Can it provide advantages of
work-sharing similar to those obtained when the MWS and the CBB protocols are
employed?
2. What are the factors that affect this protocol? How does the performance of these
U-lines (when this protocol is employed) compare with the performance of
traditionally balanced U-lines and cellular bucket brigades (in terms of metrics
such as utilization, throughput, WIP, cycle time and number of preemptions)?
3. Is this protocol generalizable (with respect to number of stations, workers, various
processing times, types of processes, aisle width to line length ratio, etc.)? What
27
5. Methodology
In this section, the methodology adopted to answer the research questions posed in the
previous section is detailed. The methodology primarily consisted of two stages. In the
first stage, a new protocol along with a working model was developed. In the second, the
performance of this protocol was analyzed, evaluated and contrasted against the
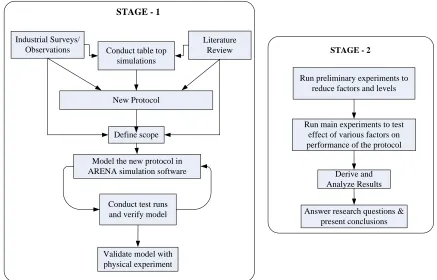
performance of existing protocol in literature. Figure 11 is a schematic on the steps
involved in this methodology.
Conduct table top simulations
Define scope
Model the new protocol in ARENA simulation software
Validate model with physical experiment
Conduct test runs and verify model
STAGE - 1
Literature Review
New Protocol Industrial Surveys/
Observations
Run preliminary experiments to reduce factors and levels
Run main experiments to test effect of various factors on performance of the protocol
Derive and Analyze Results
STAGE - 2
[image:38.612.87.524.286.566.2]Answer research questions & present conclusions
Figure 11: Methodology flowchart
In the first stage, an iterative process using simple table-top simulations to gain a
28
hypothesis for a new protocol. This hypothesis suggested that it was possible to combine
the benefits of both the CBB system and the MWS protocol by including buffers with
control levels in a U- line that followed the cellular bucket brigade protocol (research
question 1). Observations from the literature review and industrial surveys helped
strengthen the protocol, arrive at a generalized protocol, and narrow down its scope to a
feasible size (detailed in sections 5.2.1, 5.2.2, and 5.2.3). To test the new protocol,
simulation models in ARENA, a discrete event simulation software, were developed
(section 5.2.4). Then, an iterative process to modify the model to more accurately
represent the protocol was undertaken. This involved conducting test runs and verifying
the model. The simulation model was then validated by conducting a physical
experiment. This involved staging and physically simulating the protocol with volunteers
in a U-shaped assembly line set-up in the Toyota Production Systems Lab at RIT (section
5.2.5). Once validated, the simulation model was used to run a preliminary round of
experiments to screen factors and to check if exploring more levels of that factor would
be fruitful (section 6.1). After narrowing down factors and levels, a final round of
experiments was conducted (section 6.2). The results of these experiments were then
analyzed, and attempts were made to answer concerns that arose during various stages of
the thesis. Finally, conclusions were drawn from the analyses, and research questions
were answered (section 7).
5.1 Definitions and Assumptions
Some of the terms that will be used in this work are defined as follows (refer Figure 12
29
Worker (Operator): A person who performs the tasks assigned to him/her in an
assembly line. It is assumed that the tasks are sequenced and allocated along the
length of the line and that the operator moves down the line as he/she completes
each task. The index i is used to refer to a worker and the total number of workers
in the assembly line is represented by N.
Stations and tasks: The entire work content of the assembly line can be divided
into a number of smaller divisions of equal work content, called stations. The total
number of stations is represented by M. Every station in-turn consists of smaller
sub-divisions of equal work content, called tasks. The number of tasks for each
workstation is denoted by Tj, where the index j = 1,2,.., M. Figure 12 shows a
U-line divided into 6 stations and 24 tasks.
Figure 12: A 6 station 3 worker U-line in which the entire process is divided into 24 with
workers having equal work velocities v1= v2 = v3 and aisle walking velocity w
Buffers: Buffers are physical locations used to temporarily store WIP in the
30
(Montano et.al, 2007), buffers are located between pairs of consecutive
workstations, as well as one before the first workstation, and one after the last one
(Figure 13 illustrates this). In this case, for M workstations, there will be a total of
(M + 1) buffers, represented as: B1, B2, B3,…,BM+1. The buffer preceding station 1
is referred to as B1, the buffer preceding the second workstation as B2, and so on
until the last buffer. The last buffer succeeds the Mth workstation and is referred to
as BM+1. If buffers were instead located between tasks, for a T tasks line, there
will be a total of (T + 1) buffers, represented as: B1, B2, B3,…,BT+1.
Figure 13: An example of the location of buffers introduced in the 6 station U-line
(M=6) shown in Figure 12
Work-zone (or zone): An area consisting of a combination of stations or tasks
within which the worker works. For example, in Figure 12, worker A's zone
consists of stations 1 and 6.
Worker velocity ,vi: Each worker (i = 1...N) is assumed to have a finite work
velocity vi, which can be defined as the assembly speed (or job processing speed)
of the ith worker, given in parts per unit time (Montano et al.,2007). It is to be
31
Aisle width, a: The ratio of the width of the aisle to the total length of the line. It
can take any value from 0 to 1,i.e. a ϵ [0,1] (Lim, 2011).
Walking velocity (or Walk velocity, as used in Lim, 2011) w: All workers walk
with a finite walk velocity, w units per unit time. It is important to distinguish
walking velocity from worker velocity. When a worker is not assembling (or
processing) a job, but moves from one location to another in the U-line, he/she
does so with a walking velocity, w. Hence, for a line of length L and aisle width
ratio a, the time taken by each worker to cross the aisle will be (aL/w) units. If all
T tasks in a line of length L are equally spaced, then distance between two
consecutive tasks on the same side of the aisle will be (L/T), and the time taken to
walk back from one of task to the previous task on the same side of the aisle will
be L/(Tw).
WIP: Work in Process - the total number of jobs present in the entire system
The following assumptions are made in this work:
1. Each workstation consists of a number of discrete tasks Tj, j = 1..M (where M is
the total number of workstations). Figure 12 shows an example of this.
2. Workers can be preempted only after a task is completed (i.e. no preemption in
the middle of a task)
3. The average work content is the same for all tasks i.e. a worker would take the
same amount of time for every task, if there were no variability.
4. Task times are distributed based on a Gamma distribution
5. Walking velocity is a normal distribution with a mean of 4.39 ft/sec, and a
32
Assumption 1 is to address the mismatch between continuous models used by most of the
previous authors (such as Bartholdi et al., 1996, 1999; Lim, 2011) and discrete stations
used in the industry (outlined in Bratcu et al. (2005) and used in Bartholdi (2001), and
from a local industry survey). This also allows for the lean practice of 'standard work' -
where each station is described as a list of tasks to be performed by every worker in order
to minimize defects (Ghiram, 2012). The second assumption follows the first assumption.
Besides being impractical, if a worker were to be preempted during a task, unforeseen
quality issues could occur due to a possible loss of information and more than one person
performing the same task (which increases the variability in the quality of the product).
Assumption 3 is from previous literature (Bartholdi et al. (2001), Montano et al. (2007))
and is in place to keep the focus on balancing the workload between the workers rather
than focusing on assigning work to workstations.
Assumption 4 is to consider the variability in processing times. Across the manufacturing
industry, processing times vary greatly depending on the product being manufactured,
tools and machinery used, training imparted to the operators, operators’ experience,
number of stations in the assembly line, number of workers, etc. Within each assembly
line task itself, there may be some sources of variability due to human errors and other
internal process variability. Bartholdi et.al (1999), Miltenburg et.al (2007), and several
other works in literature that consider stochastic processing times chose an exponential
distribution. Their primary argument for doing so is that an exponential distribution is a
conservative assumption. This means that there will be greater variance at each work
station than one would expect to find in practice, and this unrealistically large variance
33
(Bartholdi et.al, 1999). Although this is a reasonable assumption to make, it compromises
on the opportunity to analyze whether the system behaves differently for small and large
variances.
On the other hand, normal distributions are commonly used to represent quantities that
are expected to be the sum of several independent processes (including human errors).
Das, Garcia-Diaz, MacDonald & Ghoshal(2010), Scholl (1999), and Smunt & Perkins
(1985) among others, consider normally distributed task times in their approach to
stochastic assembly line balancing problems.
One of the assumptions made in this thesis work is that the average work content is the
same for all workstations, i.e. a worker will take the same amount of time to finish the
work in every station if there is no variability. This work also does not consider any
scheduled or unscheduled stoppages to the processes either due to equipment failures,
time breaks, maintenance requirements, workers’ learning curves, or process failures. The
sources of variability are thus limited to human errors while processing the job(captured
in this work by different worker velocities) and walking (captured by walking velocities).
Mason et al. (2005) considered the impact of Human Performance Variance (HPV), and
analyzed the fit of various empirical distributions such as Pearson IV, Weibull, Gamma,
and Normal. The conclusion was that Pearson IV (r2 = 0.997) and Gamma (r2 = 0.975 to
0.991) represent the manufacturing operation process the closest (with coefficients of
variances, CV, varying from 0.3 to 0.6). Pearson IV has only slightly a higher correlation
coefficient r2 than Gamma. While Gamma distribution is commonly used included in
other literature such as MacDonald & Ghoshal(2010), Scholl (1999), Person IV is
34
above, for this work, Gamma distribution is used as the empirical distribution for task
times.
While Bartholdi & Eisenstein (1999) and Miltenburg et al. (2007) consider walking
velocities as a fraction of the working velocities, this work uses empirical data for the
walking velocities. Assumption 5 is made based on data on human walking speeds from
Daamen & Hoogendoom (2006), Mohler et al. (2007), and Levine & Norenzayan (1999).
The rationale behind this choice was that walking that occurs when the protocol is
followed is no different from walking in normal everyday life. The walking velocities of
individuals appeared to follow a normal distribution, with an estimated mean of 1.34 m/s
(4.39 ft/s) and a standard deviation of 0.37 m/s (1.21 ft/s). The data on which the
distributions were estimated came from large-scale laboratory walking experiments in
more than twenty countries.
5.2 Stage -1
To develop a new protocol, review of existing protocols in literature was essential.
Simple table top simulations were used for this purpose. Big sheets of paper, markers,
and objects such as paper clips and pins were used to simulate U-shaped assembly lines.
A simple U-line of six stations and two workers was used as an example. Role-playing
was used to simulate time. Worker positions, buffer levels, and cycle times were
annotated. First, a simple CBB protocol was simulated, and then a simple linear MWS
line with buffers was simulated. When MWS buffers were introduced into the CBB line,
the simulation quickly grew in complexity, and it became difficult to keep track of all the
35
stochastic cases was not. At this point, a hypothesis was developed based on observations
made during these manual table-top simulations: CBB protocol with MWS-like buffers
will produce a higher throughput than the traditional CBB system under similar
conditions. The rationale behind this hypothesis was that buffers would reduce the
waiting time that existed in the CBB protocol when workers exchanged jobs across the
aisle. Although this introduced new walking times, the trade-off between increasing
walking times, and decreasing waiting times seemed to result in higher efficiency, and
hence higher throughput.
5.2.1 Developing the New Protocol
The new protocol can be viewed as a simple combination of the Cellular Bucket Brigade
system introduced by Lim (2011), and the Modified Work-Sharing protocol introduced
by Montano et al. (2007). However, there were some connecting rules and overlapping
rules that were appended and deleted from these protocols. Theapproach to developing
the new protocol was using simple, specific case studies to simulate various conditions
and situations, and then generalizing them based on lessons learnt from the simulation
model in ARENA. Due to their simplicity, the most common examples found in literature
are the 6station - 2 worker, and 6 station - 3 worker assembly lines (Bartholdi &
Eisenstein 1996, 2001, Montano et.al, 2007, Lim, 2011). Hence, these also used as the
starting point to study various permutations and combinations of the rules. Here, first the
protocol is explained through an example, and then the generalized rules are presented.
For this example, a 6 station - 2 worker U-line is considered, with each station having 4
tasks, and the workers following both the MWS, and the CBB protocols (Figure 14). This
36
considered for each worker i - buffer j combination are mentioned in Figure 14. Worker
B with velocity v2, is assumed to have twice the work velocity of A with velocity v1 (v2 =
2v1). In the beginning, worker A and worker B start processing from tasks 1 and 13
respectively. What will happen from this time forward is explained below under three
scenarios or situations. The first two scenarios are observed when the process times are
deterministic, while the third scenario deals with what would happen in the first two
conditions with stochastic processing times.
Figure 14: Schematic of a six station, two workers U-line, with seven buffers and control levels.
Note that in this case, all control levels at B1, B3, B4, and B5 are -∞. This means that
when workers A and B encounter these buffers, they behave as if there was no buffer
(even zero is greater than -∞). Both the control levels at B1 are -∞, as the assumption is
that there is infinite raw material; the control levels at B7 are ∞, as this is represents
finished goods storage. B2 has a control level of 1 for worker A, while B6 has a control