QUALITY IMPROVEMENT IN MANUFACTURING INDUSTRY
USING SIX SIGMA METHODOLOGIES
NG TECK MING
B051410158
QUALITY IMPROVEMENT IN MANUFACTURING INDUSTRY USING SIX SIGMA METHODOLOGIES
This report is submitted in accordance with requirement of the University Teknikal Malaysia Melaka (UTeM) for Bachelor Degree of Manufacturing Engineering
by
NG TECK MING B051410158 941022-10-5204
Disahkan oleh:
_____________________________ ______________________________ Alamat Tetap: Cop Rasmi:
NO.19, JLN PEKERTI 25/133D, TMN MUTIARA KEMUNING 40460 SHAH ALAM, SELANGOR.
Tarikh: _______________________ Tarikh: _______________________
*Jika Laporan PSM ini SULIT atau TERHAD, sila lampirkan surat daripada pihak berkuasa/organisasi berkenaan dengan menyatakan sekali sebab dan tempoh laporan PSM ini perlu dikelaskan sebagai SULIT atau TERHAD.
UNIVERSITI TEKNIKAL MALAYSIA MELAKA
BORANG PENGESAHAN STATUS LAPORAN PROJEK SARJANA MUDA
Tajuk: QUALITY IMPROVEMENT IN MANUFACTURING INDUSTRY USING SIX SIGMA METHODOLOGIES
Sesi Pengajian: 2017/2018 Semester 2
Saya NG TECK MING (941022-10-5204)
mengaku membenarkan Laporan Projek Sarjana Muda (PSM) ini disimpan di Perpustakaan Universiti Teknikal Malaysia Melaka (UTeM) dengan syarat-syarat kegunaan seperti berikut:
1. Laporan PSM adalah hak milik Universiti Teknikal Malaysia Melaka dan penulis. 2. Perpustakaan Universiti Teknikal Malaysia Melaka dibenarkan membuat salinan
untuk tujuan pengajian sahaja dengan izin penulis.
3. Perpustakaan dibenarkan membuat salinan laporan PSM ini sebagai bahan pertukaran antara institusi pengajian tinggi.
4. *Sila tandakan (√)
(Mengandungi maklumat yang berdarjah keselamatan atau kepentingan Malaysiasebagaimana yang termaktub dalam AKTA RAHSIA RASMI 1972)
(Mengandungi maklumat TERHAD yang telah ditentukan oleh organisasi/ badan di mana penyelidikan dijalankan)
SULIT
TERHAD
DECLARATION
I hereby, declared this report entitled “Quality Improvement in Manufacturing Industry Using Six Sigma Methodologies” is the results of my own research except as cited in
reference.
Signature : ………
Author’s Name : NG TECK MING
APPROVAL
This report is submitted to the Faculty of Manufacturing Engineering of Universiti Teknikal Malaysia Melaka as a partial fulfilment of the requirements of the degree of
Bachelor of Manufacturing Engineering (Hons.). The member of the supervisory committee are as follow:
……… (En. Nor Akramin bin Mohamad) – Principal Supervisor
i
ABSTRAK
ii
ABSTRACT
iii
DEDICATION
Only my beloved family
iv
ACKNOWLEDGEMENT
First of all, I would like to thank my supervisor En. Nor Akramin bin Mohamad for his guidance and being a mentor throughout the project. Secondly, thanks to Mr. Hasbullah, Head of R&D department for giving me a chance to undergo my final year project in car parts manufacturing industry. I would also like to thank my co-supervisor who is always helpful and willing to share his expertise dealing with the project. Thanks also to all the members in R&D team that helped during the progression of research.
Then, thanks to my parents for giving encouragement, valuable assistance, and enthusiasm to me. I might not be able to finish this research properly without them. Besides, thanks to My friends who always support and give some advices to me throughout the research.
v
TABLE OF CONTENTS
Abstrak i
Abstract ii
Dedication iii
Acknowledgement iv
Table of Contents v
List of Tables viii
List of Figures ix
List of Abbreviations & Specialized Nomenclature xi
List of Symbols xii
CHAPTER 1: INTRODUCTION
1.1 Six Sigma Methodology 1
1.2 Problem Statement 2
1.3 Objectives 3
1.4 Scopes 4
1.5 Importance of Study 4
1.6 Report Outlines 5
CHAPTER 2: LITERATURE REVIEW
2.1 Introduction of Six Sigma 6
2.2 Six Sigma Methodology 7
2.3 DMAIC Background 8
2.3.1 Five Phases of DMAIC 8
2.3.1.1 Define Phase 9
2.3.1.1.1 How to pick a project? 9
2.3.1.1.2 How to define the scope of a project? 9
2.3.1.2 Measure Phase 10
2.3.1.3 Analyse Phase 10
vi
2.3.1.5 Control Phase 11
2.4 Six Sigma Applicable Tools and Techniques 11
2.4.1 Pareto Chart 13
2.4.2 SIPOC diagram 14
2.4.3 Quality Function Deployment (QFD) 14
2.4.4 Process Flowchart 15
2.4.5 ANOVA 16
2.4.6 Control Chart 16
2.4.7 Cause and Effect diagram 16
2.4.8 Design of Experiment (DOE) 17
2.4.9 Statistical Process Control (SPC) 17
2.5 Applications of Six Sigma methodology 18
CHAPTER 3: METHODOLOGY
3.1 Company Selection 19
3.2 Methodology of Project 20
3.2.1 Define 23
3.2.2 Measure 23
3.2.3 Analyse 25
3.2.4 Improve 26
3.2.5 Control 26
CHAPTER 4: RESULT & ANALYSIS
4.1 Define Phase 28
4.2 Measure Phase 32
4.2.1 Data Collection 32
4.2.2 Force on F1(i) 33
4.2.3 Force on F1(ii) 35
4.2.4 Force on F2 36
4.2.5 Calculation 38
4.3 Analyse Phase 39
4.3.1 Co-relation Analysis 39
4.3.2 Cause and Effect Diagram 40
vii
4.3.3.1 Normal Plot and Pareto Chart of Effect using 42 full factorial design
4.3.3.2 Main Effect Plot using Taguchi Design 43
4.4 Improve Phase 46
4.4.1 F1(i) 46
4.4.2 F1(ii) 47
4.4.3 F2 49
4.5 Control Phase 50
CHAPTER 5: CONCLUSION & RECOMMENDATION 53
REFERENCES 55
APPENDICES
A1 Gantt Chart of FYP I 59
A2 Gantt Chart for PSM 2 60
B Movement Force at F1(i) 61
C Movement Force at F1(ii) 61
D Movement Force at F2 62
E Movement Force at F1(i) after improvement 62
F Movement Force at F1(ii) after improvement 63
viii
LIST OF TABLES
1.1 Customer Complaint on Car Parts Problems 2
2.1 Statistical tools and descriptions for Six Sigma methodologies 12
3.1 Tools used in each phase of DMAIC 27
4.1 Customer complaints on varieties of car parts with different problems 28
4.2 Capability Study of F1(i) 34
4.3 Capability Study of F1(ii) 36
4.4 Capability Study of F2 37
4.5 Comparison between F1(i), F1(ii) and F2 38
4.6 Calculation for X-Bar chart and Range Chart 38
4.7 DOE Table 41
4.8 Descriptions on Factors’ options 42
4.9 F1(i) Comparison of Process Capability Study
before and after improvement 47
4.10 F1(ii) Process Capability Study Comparison chart
before and after improvement 48
ix
LIST OF FIGURES
1.1 Customer Complaints 3
1.2 Stay Ball and Retainer 3
2.1 Percentage distribution of 6 Sigma 7
2.2 DMAIC cycle key points 8
2.3 House of Quality template and Benefits 15
3.1 DMAIC cycle 20
3.2 Flowchart of DMAIC 22
3.3 Cpk upper spread 25
4.1 Stacked Column Chart for customer complaints 29
4.2 Pareto Chart for car parts 29
4.3 SIPOC diagram 31
4.4 Force exerting on rear-view mirror 32
4.5 Probability of detecting a shift in process average
for different subgroup sizes 33
4.6 X-bar Chart of F1(i) 33
4.7 Range Chart of F1(i) 34
4.8 X-Bar Chart of F1(ii) 35
4.9 Range Chart of F1(ii) 35
4.10 X-Bar Chart of F2 37
4.11 Range Chart of F2 37
4.12 F1(i) vs F1(ii) 39
4.13 F1(i) vs F2 39
4.14 F1(ii) vs F2 39
4.15 Cause and effect diagram 40
4.16 Normal Plot 43
x
4.18 Main Effect Plot for Mean 44
4.19 Main Effect Plot for SN ratios 44
4.20 Factors ranking 45
4.21 F1 (i) X-Bar Chart (Before) 46
4.22 F1 (i) X-Bar Chart (After) 47
4.23 F1 (ii) X-Bar Chart (Before) 48
4.24 F1 (ii) X-Bar Chart (After) 48
4.25 F2 X-Bar chart (Before) 49
4.26 F2 X-Bar chart (After) 49
xi
LIST OF ABBREVIATIONS & SPECIALIZED
NOMENCLATURE
ROI - Return of Investment
DMAIC - Define, Measure, Analyse, Improve, Control DMADV - Define, Measure, Analyse, Design, Verify DPMO - Defects per Million Opportunities
SIPOC - Supplier, Input, Process, Outcome, Customer
VSM - Value Stream Mapping
QFD - Quality Function Deployment
QC - Quality Control
ANOVA - Analysis of Variance DOE - Design of Experiment
SN - Signal-to-Noise
SPC - Statistical Process Control TQM - Total Quality Management R&R - Repeatability and Reproducibility USL - Upper Specification Limit
LSL - Lower Specification Limit UCL - Upper Control Limit LCL - Lower Control Limit
ABS - Acrylonitrile Butadiene Styrene QCP - Quality Control Plan
xii
LIST OF SYMBOLS
X - Sample Mean
- Sigma or Standard Deviation
- Mean
X - Grand Mean
R - Average Range
x
- Population Standard Deviation
n - Subgroup sizes
d2 - Factors for Central Line
A2 - Factors for Control Limits
D3 - Factors for Control Limits
D4 - Factors for Control Limits
N - Newton
cm3 - Volume
Cp - Process Capability
1
CHAPTER 1
INTRODUCTION
1.1 Six Sigma Methodology
The main objective of a company is to have a higher Return of Investment (ROI). Over emphasizing on product quality will involve cost and time and this will reduce the productivity of a company. So, to achieve a higher ROI. Cost and time is the first thing that comes in head, motivate worker’s attitude towards working, and reduce waste and rejection. The ongoing trend is not just to make profits but need to benefit the organisation and customer satisfaction. The internal benefit of an organization is the monetary where the external benefit is customer satisfaction. In order to achieve the balance score, the organization must reduce the waste and improve product quality, thus, fulfil the customer requirements. The internal management like waste, defects and other internal problem must reduce to satisfy the customer. Therefore, Six Sigma, Define-Measure-Analyse-Improve-Control (DMAIC) methodology was used to achieve all these objectives.
Six Sigma methodology is a quality improvement tools for continuous improvement in the process of an organization (Johnston et al., 2009; Su & Chou, 2008). There are 2 sub methodologies and have a total of 5 phases for each cycle which are DMAIC and DMADV. Define-Measure-Analyse-Design-Verify(DMADV)methodology is usually used to
2
Six Sigma uses statistics information to describe quantitatively how a process is performing. A process must not produce more than 3.4 defects per million opportunities (DPMO) to achieve six sigma which means 99.7% percentage yield is required and only 0.00034% of defects.
1.2 Problem Statement
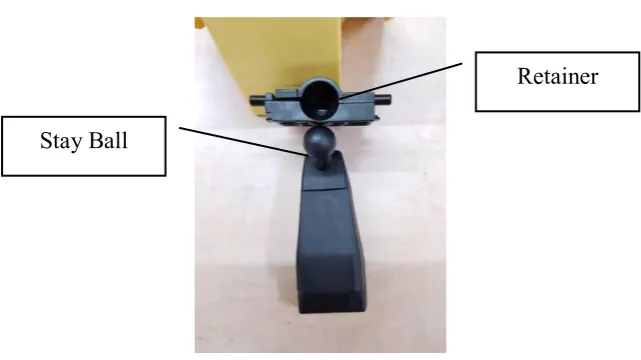
A good product that can penetrate the market is to fulfil three criteria which are Good Quality, Competitive Price and Good Service. One of the problem faced by the company is customer complaints. Table 1.1 and Figure 1.1 shows the number of customer complaints received which consists of 5 different car parts and three categories of problem. The number represents the number of customer complaints received in batches. Adjustment is the main problem here, all coming from Rear-view mirror with total customer complaints of 20 batches in a year. The car parts that received the highest number of complaint is also rear-view mirror with a total complaint of 22 batches, another 2 batches coming from function problem. A quality team was formed to investigate this problem. The adjustment problem came from the plastic moulded part from the rear-view mirror which is shown in Figure 1.2, the stay ball and retainer are joined to adjust the mirror position, stay ball part is attach to the car body and retainer part attach to the mirror. the customer complain that it is difficult to adjust the rear-view mirror especially on the side.
Table 1.1: Customer Complaint on Car Parts Problems Car
parts/Problems Others License Plate
Lamp
Rear-View
Mirror Side-View Mirror Signal Lamp Grand Total
Appearance 1 8 9
Function 1 1 2 4 1 9
Adjustment 20 20
3
Figure 1.1: Customer Complaints
Figure 1.2: Stay Ball and Retainer
1.3 Objectives
The main objective of this project is the application of Six Sigma DMAIC methodology to solve the problem by defining the problem, collect information and conduct analysis to achieve customer satisfaction and then maintain the quality.
Here are several sub-objectives to be achieved and make this project successful:
a) To identify the car part with problem that has the highest number of customer complaints. b) To analyse the root cause of the problem with highest number of customer complaints. c) To improve and maintain the product quality.
Retainer
[image:20.595.144.465.293.473.2]4
1.4 Scopes
This project involves a car parts manufacturing industry by using Six Sigma DMAIC methodology in a car parts manufacturing industry. The data collected were from October 2016 to September 2017 within a year. The focus will be given to the rear-view mirror (retainer and stay ball) refer to Figure 1.2, because these components are the parts that will control the movement of the mirror. Besides, Implementation of Six Sigma is time and cost constrained.
1.5 Importance of Study
5
1.6 Report Outlines
The entire research covers 5 main parts which are:
Chapter 1: Introduction
This chapter discusses about the background of study, which mentioned about the reasons why six sigma methodology, descriptions and importance of six sigma methodology. Problems are identified through customer complaints. Followed by Objectives to be attained and scopes which will help to narrow down the area of study. The importance of study also mentioned here to explain why the research is carried out.
Chapter 2: Literature Review
This section explains about simple summary and basic theories from the previous studies from journals and books. The five phases DMAIC are explained and described here. Besides, common tools that used in Six Sigma methodology are recommended and further explanation is made.
Chapter 3: Methodology
This part focuses on the method to carry out the research, tools used during progression of project in the 5 phases, Define, Measure, Analyse, Improve, Control. Besides, the reason to use the tools suggested also discussed in this chapter.
Chapter 4: Analysis and Discussion
This part mentioned about data collection, analysis, and improvement that has been made according to the result obtained through the 5 phases of DMAIC.
Chapter 5: Conclusion & Recommendation
6
CHAPTER 2
LITERATURE REVIEW
This chapter mainly describes about the theory and researches which have been explained, described and done by previous researcher years ago. Related information is being extracted as references and discussion based on their research about theory, background, five phases of DMAIC, methodology, tools and techniques used, advantages and application of Six sigma.
2.1 Introduction of Six Sigma
7
According to (Erbiyik & Saru, 2015; Su & Chou, 2008), the basics of six sigma is related to statistics and the level of quality increases when sigma level increases, sigma ( ) is the symbol for standard deviation which is a measurement unit for statistical dispersion and spreading.
[image:24.595.174.439.307.460.2]Six Sigma is a strategy to focused on customer satisfaction and also a methodology used to reduce the defects level to 3.4 defects per million in production, product design, management processes and delivery that strive to obtain the same result every time and utilizes the well-defined problem-solving approach via statistical tools. Figure 2.1 shows the percentage distribution of Six Sigma, to achieve Six Sigma, 99.7% percentage yield is required and only 0.00034% of defects.
Figure 2.1 Percentage distribution of 6 Sigma (Erbiyik & Saru, 2015)
Six Sigma approach concentrates on 3 topics, which is to increase satisfaction level of customer, reduce cycle times and reduce failures or defects.
2.2 Six Sigma Methodology