Int. J. Electrochem. Sci., 11 (2016) 2534 - 2549
International Journal of
ELECTROCHEMICAL
SCIENCE
www.electrochemsci.org
Corrosion Behavior of X80 Pipeline Steel under Thin Electrolyte
Layer of Acidic Soil Simulated Solution
Shuaixing Wang1,2,*, Daoxin Liu1, Nan Du2, Qing Zhao2, Jinhua Xiao2 1
Institute of Corrosion and Protection, Northwestern Polytechnical University, Xi’an 710072, China 2
School of Material Science and Technology, Nanchang Hangkong University, Nanchang 330063, China
*
E-mail: [email protected]
Received: 13 January 2016 / Accepted: 1 February 2016 / Published: 1 March 2016
Corrosion behavior of X80 steel under thin electrolyte layer (TEL) of acidic soil simulated solution were studied by utilizing polarization curves, EIS, SEM and XRD. In the bulk solution, cathodic electrochemical reaction governed the corrosion process of X80 steel, and the corrosion rate was higher. Under TEL, the corrosion of X80 steel was greatly affected by TEL thickness. Under TEL of 300 μm, the corrosion was still related to the cathodic electrochemical process. Under TEL of 145 μm, oxygen diffusion dominated the corrosion process, and the corrosion rate fluctuated with immersion time. However, the corrosion of X80 steel was jointly affected by the diffusion processes of oxygen and corrosion products under TEL of 70 μm. In this system, the corrosion rate increased continuously. After 96 h exposure, the corrosion extent of steel with TEL thickness was in the sequence of 70 μm > 300 μm > 145 μm. Complete corrosion product layer was easier to form in the thinner TEL.
Keywords: X80 steel; Acidic soil; Corrosion; Thin electrolyte layer (TEL); EIS
1. INTRODUCTION
In southeastern and south china, red clay soils are the dominant soils. Besides, the acid rain with pH of 2.3 ~5.9 often occurs in these regions [14]. It has been found that acidic red soils are extremely aggressive towards carbon steel [15], and acid rain can result in the failure of protective coating [16,17]. When red clay soil was leached by acid rain, the leaching solution will be formed through the ions exchange. The leaching solution can reach the coating/steel interface through the cracks of disbonded coating and form the trapped electrolyte. The trapped electrolyte between coating and the steel is found to be very thin [5, 10]. Electrochemical corrosion of steel under thin electrolyte layer (TEL) of leaching solution is distinctly different from that in the red soil, and also has great difference with that in the TEL of acid rain. For example, the small ohmic potential drop and non-uniform current distribution under TEL are expected to affect significantly the electrochemical mechanism for corrosion of steel [18]. It has been acknowledged that the corrosion of buried pipeline usually began and developed from the disbonded coating [5-11]. The thickness and chemical composition of TEL between the disbonded coating and steel have significant effect on the corrosion behavior of steel. Therefore, it is necessary to study the electrochemical corrosion mechanism of X80 steel under TEL of acidic soil leaching solution.
Currently, SCC and crevice corrosion of pipeline steel under disbonded coating in soil environment has been investigated by various electrochemical measurement techniques and computational simulation[5, 6, 8-10, 19-24]. Yan [9, 10] demonstrated that the local potential of X70 steel in a crevice simulating disbonded coating is independent on cathodic protection (CP) potential applied at the opening. Fu [19] found that X65 steel has a more negative Kelvin potential on the area of disbonded coating than that on ‘‘intact” area. The corrosion behavior of X65 steel under disbonded coating strongly depends on the oxygen partial pressure and local geometry. In addition, some scholars investigated the effect of acid rain on the corrosion of steel in acid soils [16, 25-26]. Wu [16] found that the extent of corrosion is highly dependent on the pH of acid rain, and that the soil itself is further acidified with the application of acid rain. However, to date, there has been limited work investigating the corrosion behavior of pipeline steel under thin electrolyte layer of leaching solution form soil. Only the electrochemical corrosion behavior of X70 steel in a thin layer of near-neutral pH and high pH soil solutions were studied by Fu [27] and Yan [28].
In this work, the corrosion behavior of X80 steel under a thin electrolyte layer of acidic soil simulated solution was characterized by polarization curves and electrochemical impedance spectroscopy (EIS). The influence of TEL thicknesses on the corrosion mechanism of X80 steel was analyzed. It was anticipated that this research provides an essential insight into corrosion of X80 steel under disbonded coating in acidic soil environment.
2. EXPERIMENTAL
2.1 Materials and solution
These specimens are successively abraded with SiC emery papers, rinsed with distilled water for 2 min, ultrasonicated in alcohol for 10 min, and dried in an air flow.
[image:3.596.57.536.228.279.2]Yingtan (28°15/ N, 116°55/ E) is regarded as a representative region of acidic red clay soil in South China. The simulating solution is prepared according to the analysis data of Yingtan soil. The main chemical compositions is given in Table 2. Besides, the solution pH is adjusted to 4.5±0.2 by adding sulfuric acid according to the acidity and the main active ion (SO42-) of acid rain in this region.
Table 1. Chemical composition (wt.%) of X80 steel
C Si Mn P Mo Nb Ti Cr Ni Cu Al Fe
[image:3.596.56.542.338.387.2]0.036 0.197 1.771 0.012 0.184 0.110 0.019 0.223 0.278 0.220 0.021 bal.
Table 2. Chemical composition of acidic soil (Yingtan soil) simulated solution
Compounds NaCl CaCl2 MgSO4·7H2O Na2SO4 NaHCO3 KNO3
Content (g/L) 0.0468 0.0111 0.0197 0.0142 0.0151 0.0293
2.2 Determination of TEL thickness
Figure 1 is a schematic diagram of experiment arrangement for thin electrolyte layer which widely used by many scholars [29-31]. A digimatic micrometer (INSIZE 6353-25C, unit. ± 2μm) with a fine Pt-needle is fixed at a position right above the electrode. When Pt-needle is adjusted to touch the electrode surface, there will be a sudden value on the ohmmeter. The position of the micrometer is recorded. Afterwards the micrometer is moved backward, and the electrolyte is poured into the cell to form a electrolyte film on the electrode. The ohmic meter will show a sudden ohmic value when the Pt-needle is moved to touch the electrolyte layer surface. And the position of the micrometer is recorded again. The thickness of electrolyte layer can be calculated from the two value of micrometer. This arrangement allows the measurement of TEL thickness with an accuracy of 2 μm. Besides, to keep the constant of TEL thickness for a long time during electrochemical measurements, the cell is placed inside the desiccator.
2.3 Electrochemical test
[image:4.596.91.503.200.358.2]
Polarization curves are measured potentiodynamically frome -2.0 V (vs. SCE) to 1.25 V (vs. SCE) at a scan rate of 1 mV/s. EIS spectra for X80 steel during 96 h exposure in the electrolye layers are acquired at open-circuit potential over the frequency range of 105 ~ 10-2 Hz using an AC signal amplitude of 10 mV. The equivalent circuits are fitted using the Zsimpwin software. All tests are performed at 25 ± 2 °C. All tsets are repeated by three duplicate specimens to confirm reproducibility of the results, and the average of the three measurements is reported in this work.
Figure 1. Schematic diagram of experiment arrangement for thin electrolyte layer [29-31].
2.4 Surface characterization
After 96 h exposure, the morphology of corroded X80 steel is observed by KH-7700 three-dimensional microscope and scanning electron microscopy (SEM, QUANTA-200). Besides, the phase composition of corrosion product is investigated by X-ray diffraction (XRD, Bruker D8-Advance) with a scan range from 20° to 80° (in 2θ).
3. RESULTS AND DISCUSSION
3.1 Polarization curves
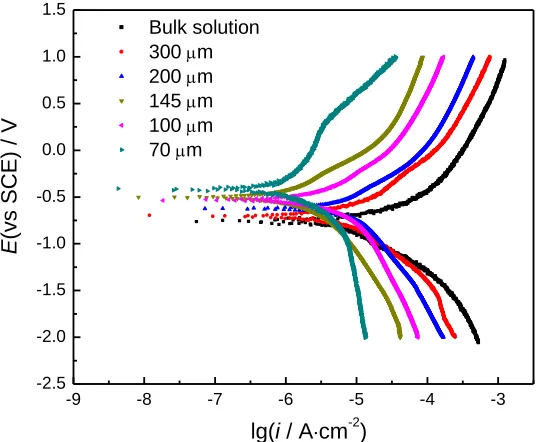
Figure 2 presents the polarization curves of X80 steel in acidic soil simulated solutions and TEL with various thicknesses after 1 h. Table 3 gives the corresponding fitting results. As shown in Figure 2 and Table 3, X80 steel had lowest corrosion potential (Ecorr) and biggest cathodic current
density in bulk solution. For TEL with different thickness, the corrosion rates of X80 steel were closely related to the TEL thickness. When TEL thickness decreased from 300 μm to 145 μm, both the cathodic current density and corrosion current density (icorr) of X80 steel decreased. The cathodic
current density obviously increased and the Ecorr increased if TEL thickness decreased from 145 μm to
-9 -8 -7 -6 -5 -4 -3
-2.5 -2.0 -1.5 -1.0 -0.5 0.0 0.5 1.0 1.5
E
(vs SCE) / V
lg(i / A·cm-2)
[image:5.596.166.436.79.300.2]Bulk solution 300 m 200 m 145 m 100 m 70 m
[image:5.596.49.545.384.455.2]Figure 2. Polarization curves of X80 steel under TEL with various thicknesses after 1 h exposure.
Table 3. Polarization fiiting results of X80 steel under TEL with various thicknesses
System bulk solution 300μm TEL 200μm TEL 145μm TEL 100μm TEL 70μm TEL
Ecorr (V, SCE) -0.782 -0.705 -0.628 -0.534 -0.504 -0.341 icorr (μA·cm-2) 1.698 0.436 0.562 0.144 0.234 0.168
3.2 Evans model
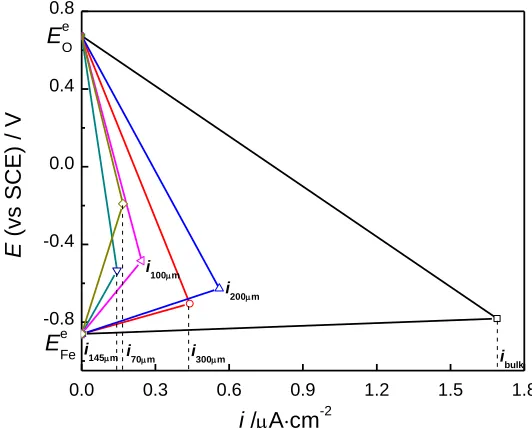
In order to determine the control factor of corrosion rate for X80 steel in bulk solution and TEL with various thicknesses, it was attempted to make Evans diagram by the experimental results in Figure 2 and Table 3. Generally, corrosion of steel in soils is an electrochemical process. The corrosion rate of steel is determined by the cathodic process and anodic process, according to Evans theory. It has been acknowledged [8, 32-33] that the anodic process of corrosion for X80 steel is the dissolution of Fe (Eq.1), the cathodic reaction of corrosion includes the depolarization of H+ (Eq. 2) and oxygen (Eq. 3) in the acidic soil environment.
Fe -2e → Fe2+ (1)
2H+ + 2e → H2 (2)
O2 + 4H+ + 4e → 2H2O (3)
Accroding to Nernst equation (Eq.4, 5, 6) , the equilibrium potential of the reactions can be determined.
2 / = 0.684 + 0.0296 lg 2 (V, SCE)
e
Fe Fe Fe
E a (4)
2
e
/ = 0.244 0.0591 pH (V, SCE)
H H
2 2
e
/ = 0.985 0.0591 pH (V, SCE)
O H O
E (6)
Where, the pH and DO concentration of simulated solution were about 4.0 and 4.12 ppm, respectively. Besides, it was assumed that the metal corrodes if the concentration of metal ion in the solution was greater than 10-6 mol·L-1 in potential-pH diagram. So, 2
Fe
a could be considered as 10
-6
mol·L-1. The aboving calculations showed that 2/
e Fe Fe
E ,
2 e
/
H H
E and
2/ 2
e O H O
E were -0.8613 V , -0.4804 V
and 0.7486 V, respectively. It can be found that 2
2 2 e e / / / e corr O
Fe Fe H H OH
E E E E , which showed that oxygen-consuming corrosion initially ocuurred when X80 steel was immersed into acidic soil simulated solution. Hydrogen evolution corrosion began only when oxygen concentration was down to some extent. That was, the depolarization of oxygen dominated the cathodic process of corrosion of X80 steel. So Evans diagram for X80 steel under TEL with various thicknesses was obtained and showed in Figure 3. As shown in Figure 3, the corrosion of X80 steel was controlled by the cathodic process in bulk solution and thicker TEL (300 – 145 μm). The corrosion current density was biggest under TEL of 200 μm. TEL thickness decreased, the anodic polarization degree increased. The corrosion of X80 steel was jointly controlled by cathodic process and anodic process under TEL of 70 μm. In this system, the corrosion current density of X80 steel was smaller.
0.0 0.3 0.6 0.9 1.2 1.5 1.8 -0.8
-0.4 0.0 0.4 0.8
EeO
i bulk i100m
i 70m i145m i
300m
E
(vs
SCE
) / V
i /A·cm-2 i200m
[image:6.596.164.430.369.583.2]EeFe
Figure 3. Evans diagram for X80 steel under bulk solution and TEL with various thicknesses 3.3 EIS behavior
[image:7.596.82.513.248.564.2]
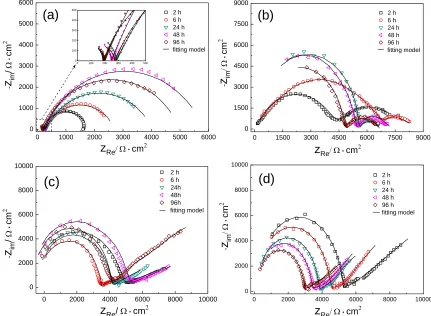
Under TEL, the high-frequency arcs were always present, but the low-frequency plots were affected by TEL thickness. Under TEL of 300 μm (Figure 3b), Nyquist plots of X80 steel were still composed of two capacitive arcs during the whole exposure, indicating that the corrosion process was still controlled by electrochemical activation reaction. Whereas, the almost 45° line, the typical characteristics of Warburg impedance, appeared in the low-frequency region of Nyquist plots for X80 steel under TEL of 145 μm ~ 70 μm. It indicated that the corrosion of X80 steel was changing to the diffusion control, including the diffusion process of oxygen or corrosion products [30, 35, 37]. Besides, the integrity of high-frequency arc for EIS plots obviously increased with decreasing TEL thickness, showing that complete corrosion product layer was easier to form in the thinner TEL.
Figure 4. Nyquist plots of X80 steel under TEL with various thicknesses for 96h. (a) bulk solution; (b) 300 μm TEL; (c) 145 μm TEL; (d) 70 μm TEL
According to the above analysis, equivalent electrical circuit in Figure 5a can be used to characterize the EIS data for X80 steel in bulk solution and TEL of 300 μm. Where, Rs represents the
electrolyte resistance. A pair of Cdl and Rct in parallel characterizes the low frequency loop, Rct is the
charge transfer resistance, Cdl represents the double layer capacitance at the metal-solution interface.
Qf and Rf correspond to the non-ideal capacitance and resistance of corrosion product layer,
respectively. In addition, there is Warburg impedance in EIS plot for X80 steel under TEL of 145 μm ~70 μm. So ZW is used to represent the diffusion resistance of oxygen and corrosion products, as
shown in Figure 5b. Where, Q is a constant phase element, Q = Y0-1/(jω)n, n is the frequency
0 1000 2000 3000 4000 5000 6000
0 1000 2000 3000 4000 5000 6000
0 100 200 300 400 500
0 100 200 300 400 500 -zim / · cm 2
zRe·cm2
2 h 6 h 24 h 48 h 96 h fitting model
(a)
0 1500 3000 4500 6000 7500 9000
0 1500 3000 4500 6000 7500 9000 -zim · cm 2
zRe·cm2
2 h 6 h 24 h 48 h 96 h fitting model
(b)
0 2000 4000 6000 8000 10000 0 2000 4000 6000 8000 10000 -zim / · cm 2
zRe/ ·cm2
2 h 6 h 24h 48h 96h fitting model
(c)
0 2000 4000 6000 8000 10000
0 2000 4000 6000 8000 10000 -zim · cm 2
zRe·cm2
dispersion factor and varies from 1 to 0. ZW= (jω)-0.5 Yw-1, Yw is a constant, the smaller Yw showed the
[image:8.596.89.507.151.274.2]bigger diffusion resistance of medium [30, 37]. As shown in Figure 4, the equivalent circuits fitted the experimental data well in most of the frequency range, indicating that the equivalent circuits of Figure 5 were suitable.
Figure 5. Equivalent circuits used to fit EIS for X80 steel under TEL of simulated red soil solution: (a) bulk solution and 300 μm TEL; (b) 145 μm TEL and 70 μm TEL
Table 4. Electrochemical parameters fitted from EIS for X80 steel under TEL with various thicknesses
System Exposure time (h) (Ω·cmRct 2 )
Cdl
(μF·cm-2)
Rf
(Ω·cm2)
Qf
(μF·cm-2) nf
YW (Ω-1·S1/2 ·cm-2)
Bulk solution
2 1280 64.78 562 29.33 0.2589 --
6 1175 83.59 828 58.88 0.2805 --
24 1864 45.9 1721 38.36 0.2713 --
48 1322 65.0 1204 32.82 0.2532 --
96 1661 49.58 1593 31.52 0.2242 --
300 μm TEL
2 3995 120.6 1679 31.56 0.3646 --
6 5327 140.8 1426 43.08 0.4295 --
24 5091 46.02 1367 10.64 0.3951 --
48 5195 41.47 2347 13.27 0.3783 --
96 4398 49.77 1956 13.12 0.3584 --
145 μm TEL
2 5021 58.73 1018 26.70 0.5362 0.00119
6 3996 84.62 719 26.84 0.6348 0.00276
24 4741 84.99 1938 42.54 0.5694 0.00345
48 5620 74.90 2177 30.03 0.5441 0.00240
96 5094 86.04 2675 16.24 0.4818 0.000176
70 μm TEL
2 6491 37.22 521 22.72 0.7794 0.000919
6 4617 38.39 1136 41.03 0.7169 0.000696
24 4250 81.77 1342 36.21 0.6963 0.000279
48 4068 45.33 1806 22.09 0.7388 0.000290
96 3785 107.3 2157 44.71 0.7397 0.000258
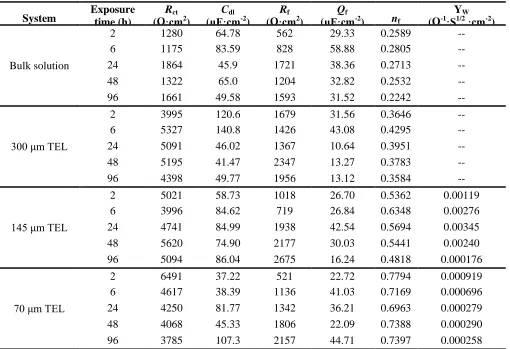
Table 4 shows the fitting component values for EIS. Generally, -1 ct
R is taken as a parameter to
characterize the corrosion rate [30, 31, 37]. Figure 6 presents the evolution of -1 ct
[image:8.596.46.556.367.716.2]
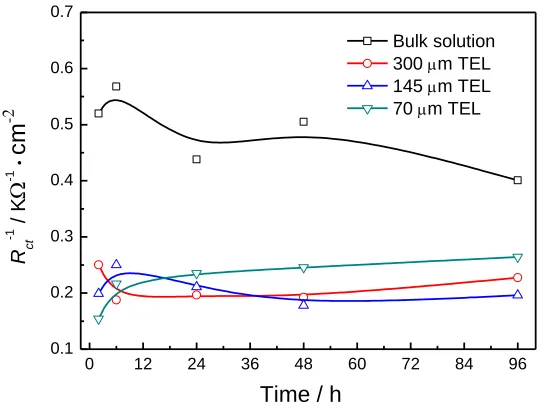
TEL with various thicknesses. As shown in Figure 6, the corrosion rate of X80 steel in bulk solution was significantly bigger than that of in TEL, and -1
ct
R fluctuated with immersion time. The corrosion
rate of X80 steel under TEL was closely dependent on the TEL thickness. Under TEL of 300 μm, -1 ct R
showed a rapid decrease in the initial stage (2~6 h), and then slightly fluctuated with immersion time.
-1 ct
R increased greatly at first and then showed a decrease trend with time when TEL was 145 μm.
Whereas, -1 ct
R increased continuously with the increase of immersion time under TEL of 70μm. After
96 h exposure, the corrosion rate of X80 steel under TEL with different thickness was ranked as 70 μm > 300 μm > 145 μm.
In addition, Rf and nf can display the features of the corrosion products. The value of n is about 0.5~1.0 for the protective corrosion product layer [32, 36]. As shown in Table 4, nf was small, indicating that the compact of corrosion product on X80 steel in the bulk solution was low. Under TEL of 300 μm and 145 μm, Rf and nf obviously fluctuated with corrosion time, which showed that the formation and dissolution of corrosion product layer alternately occurred on the surface of X80 steel. Moreover, Rf increased gradually with immersion time, and nf was bigger than 0.5, which indicated that the corrosion product layer under TEL of 70 μm was in a stable formation process and had a certain protective.
0 12 24 36 48 60 72 84 96
0.1 0.2 0.3 0.4 0.5 0.6 0.7
R ct
-1 / K
-1 ·
cm
-2
Time / h
[image:9.596.165.437.364.565.2]Bulk solution 300 m TEL 145 m TEL 70 m TEL
Figure 6. Evolution of -1 ct
R with immersion time for X80 steel under TEL with various thicknesses
3.4 Corrosion morphology
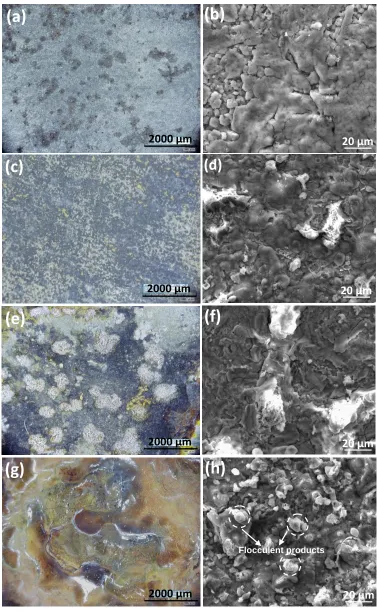
Figure 7. OM image (a, c, e, g) and SEM image (b, d, f, h) of X80 steel under TEL with various thicknesses after 96 h exposure. (a, b) bulk solution, (c, d) 300 μm TEL, (e, f) 145 μm TEL, (g, h) 70 μm TEL.
(g)
2000 μm 2000 μm
(e)
2000 μm
(c)
(a)
2000 μm
(d)
20 μm 20 μm
(b)
(f)
20 μm
(h)
Flocculent products
[image:10.596.114.491.72.684.2]
Under TEL of 300 μm, many black corrosion products appeared on X80 steel surface, but was still not completely contiguous (Figure 7c). With the decrease of TEL thickness, the corrosion product layer became more compact but layered. Under TEL of 145 μm, the corrosion products exhibited the distribution of double layers. There were many white snowflake-like corrosion products and few red rust in the external layer, and black corrosion products in the bottomed layer ( Figure 7e). Besides, Figure 7f showed that the bottomed corrosion product layer was homogeneous and compact. Under TEL of 70 μm, the corrosion products were still layering. The external corrosion product was mainly yellow rust (Figure 7g). The flocculent particles in the external layer and the uniform corrosion products in the bottomed layer could also be found in Figure 7h, which showed that the corrosion products under 70 μm TEL had good protective effects. Interestingly, the OM and SEM images of X80 steel under different TEL were consistent with the variation laws of Rf and nf fitted by EIS.
3.5 Composition of corrosion products
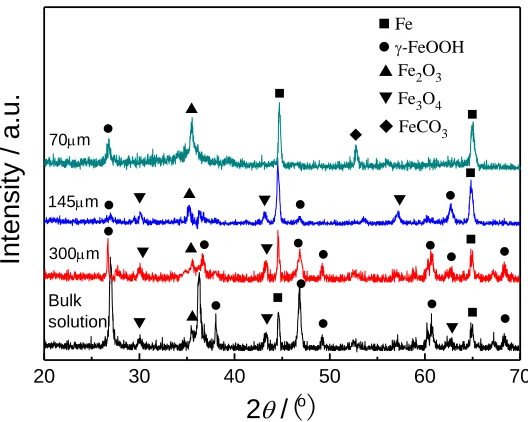
XRD patterns of corrosion product for X80 steel exposed in the TEL with various thicknesses for 96 h are shown in Figure 8. In bulk solution, the phase composition of corrosion product on X80 steel was mainly γ-FeOOH and Fe3O4. The composition and content of corrosion product under TEL were closely related to TEL thickness. Under TEL of 300 μm, the main phase composition of corrosion product was still γ-FeOOH and Fe3O4, but the number and magnitude of the diffraction peaks were obviously less than that in bulk solution. With the decrease of TEL, γ-FeOOH reduced significantly, and Fe2O3 had a increasing tendency. Under TEL of 70 μm, the corrosion products were composed of Fe2O3 and a few γ-FeOOH. Besides, there was a small amount of FeCO3 under TEL of 70 μm. Since Fe3O4 and FeOOH had reducibility [38], so the protective effects of corrosion products in bulk solution and thicker TEL was low.
20 30 40 50 60 70
2
/
(
o)
Fe
-FeOOH
Fe2O3
Fe3O4
FeCO3
Int
en
sit
y
/
a.
u.
70m145m
[image:11.596.167.431.490.701.2]Bulk solution 300m
4. DISCUSSION
4.1 Analysis of corrosion control mechanism
As shown in Figure 4a, double capacitive loops in EIS showed that the corrosion of X80 steel in bulk solution was controlled by the electrochemical activation reaction. Evans diagram (Figure 3) showed that the corrosion of X80 steel was controlled by cathodic process. Oxygen and proton ion (H+) have been recognized as the most common cathodic depolarizers in corrosion process of steel in acidic soils. Although oxygen-consuming corrosion initially occurred, hydrogen evolution corrosion also could happen when oxygen concentration was down to some extent. Therefore, the corrosion of X80 steel in bulk solution was controlled by cathodic electrochemical reaction, including the reduction of H+ and the ionization reaction of oxygen.
Under TEL, the corrosion control mechanism for X80 steel was closely related to the TEL thickness. Generally, TEL could be divided into the troposphere and the diffusion layer. The oxygen concentration in the troposphere was a constant value, but the oxygen in the diffusion layer had a concentration gradient. The change of TEL thickness mainly affected the thickness of the diffusion layer [27, 29-30]. For the thicker TEL, the thickness of the diffusion layer and the diffusion process of oxygen will not be affected if TEL thickness changes. Assuming that the cathodic process was governed by diffusion of oxygen, the cathodic current density in thicker TEL should not be changed theoretically. The cathodic current density decreased with the decrease of TEL thickness from 300 μm to 145 μm in Figure 2, which showed that the corrosion of X80 steel in this status was not controlled by diffusion of oxygen. Besides, EIS of X80 steel under TEL of 300 μm still displayed the capacitive arcs in Figure 4b, and the corrosion X80 steel under TEL of 300 ~ 200 μm was governed by cathodic process (Figure 3). These phenomena together showed that the corrosion of X80 steel was still mainly related to the cathodic electrochemical reaction under TEL of 300 μm.
When TEL thickness decreased from 145 μm to 100 μm, the cathodic current density increased greatly, which showed TEL thickness might be less than the thickness of the diffusion layer in this status. The thinner TEL meaned the shorter diffusion path of oxygen. It was generally believed that the corrosion rate of metal was equal to the limit diffusion current of oxygen when the corrosion of metal was controlled by the diffusion of oxygen (Eq. 7) [34]. As shown in Table 3, corrosion current ratio ( i100 μm / i145 μm = 1.51) was basically consistent with the inverse ratio of TEL thickness (145 μm / 100 μm=1.45). Besides, Warburg impedance appeared on the low-frequency region of EIS plots for X80 steel under TEL of 145 μm (Figure 4c), which fully indicated the diffusion of oxygen dominated the corrosion of X80 steel under TEL of 145 μm.
2
2 corr
[ ]
L O
O
i i nFD
(7)
Where, 2
O
D and [O2] are the diffusion coefficient and the concentration of the dissolved oxygen in the electrolyte layer respectively, and is the diffusion layer thickness, n is the number of the electrons involved in the oxygen reduction reaction, and F is the Faraday constant.
diffusion mode of oxygen (one-dimensional or two-dimensional diffusion) [29, 30, 39].Under TEL of 70 μm, the diffusion of oxygen at the electrode surface might shift from a two-dimensional to one-dimensional. There was more oxygen involved in the reduction process at two-dimensional diffusion, so the cathodic current density under TEL of 70 μm was lower than that of under TEL of 100 μm. Besides, the hydration of metal ions and the diffusion of corrosion product would be greatly affected when TEL thickness changed [30, 37]. In the thinner TEL, the diffusion of corrosion products became more difficult, the extent of anodic polarization increased, the corrosion of X80 steel was jointly controlled by cathodic process and anodic process (Figure 3). In this system, the corrosion rate mainly depends on the diffusion resistance of oxygen and corrosion products, as shown in Warburg impedance in Figure 4d and lower Yw in Table 4.
4.2 Discussion of corrosion behavior
The comprehensive results of polarization curves, EIS, OM, SEM and XRD showed that X80 steel in bulk solution and TEL with various thicknesses had different corrosion behavior.
In the bulk solution, the corrosion of X80 steel was controlled by the cathodic electrochemical reaction. Although the depolarization process of oxygen was weak, the reduction process of H+ still could be in progress. Besides, the transmission of metal ions and corrosion products in bulk solution was relatively easy, so the anodic process and cathodic process could happen continuously, the corrosion rate was bigger. As corrosion progressed, Fe2+ generated by anodic reaction could react with the OH- and dissolved oxygen in aqueous phase (Eq.8, 9, 10, 11). An incomplete corrosion product layer, γ-FeOOH and Fe3O4, formed on the surface of X80 steel. The corrosion products could hinder the transmission of metal ion and oxygen, which made the reaction resistance increase, resulting in the decrease of corrosion rate after 24 h exposure. While, the active ions (H+, Cl-, et al) in simulated solution would dissolve some corrosion product. Micro-holes and micro-cracks would be formed on the corrosion product layer, as shown in Figure 7b. The faults on corrosion product layer provided the channels for the transmission of active ions to the metal substrate, which resulted in the consecutive corrosion.
Fe2+ + 2H2O→ Fe(OH)2 +2H+ (8)
4Fe(OH)2 + O2+ 2H2O→ 4Fe(OH)3 (9)
Fe(OH)3 -H2O → FeOOH (10)
3FeOOH + H+ + e → Fe3O4 + 2H2O (11)
corrosion product layer occurred alternately on the steel as the corrosion effect of active ions in electrolyte layer, resulting in the fluctuation of corrosion rate for X80 steel under TEL of 300 μm, as shown in Figure 6.
Under TEL of 145 μm, the diffusion of oxygen dominated the corrosion process of X80 steel. In this status, the diffusion path of oxygen was relatively short, the oxygen reached to electrode surface increased, and so the cathodic process of corrosion could be carried out smoothly, resulting in a rapid increase of corrosion rate in 6h. As corrosion progressed, the corrosion products could not be effectively diffused and covered on the electrode surface, a compact and bilayer corrosion product layer was gradually formed (Figure 7c, 7d), which inhibited the anodic process. Besides, the corrosion product layer increased the diffusion resistance of oxygen, the cathodic process weakened. The combined effects resulted in the decrease of corrosion rate in the later stage, as shown in Figure 6.
Under TEL of 70 μm, the shorter diffusion path of oxygen made X80 steel corrode rapidly in the initial stage (6 h). Meanwhile, a complete corrosion product layer was quickly formed as the diffusion of Fe2+ and corrosion product was greatly inhibited in this status. Corrosion product layer increased the extent of anodic polarization. The corrosion process of X80 steel was gradually controlled by a combination of cathodic process and anodic process, that was, the diffusion of oxygen and corrosion products. However, the thinner electrolyte layer simultaneously made the transmission of active ions to be easier. The accumulation of active ions on the local location of electrode surface intensified the unevenness of the surface potential, so that local corrosion could occur continuously. Therefore, corrosion rate ( -1
ct
R ) of X80 steel under 70 μm TEL increased continuously, but increased
slowly in the later stage, as shown in Figure 6. Besides, Fe2+ might react with HCO3- in electrolyte and formed FeCO3 (Eq.13) as the decrease of depolarization effect of oxygen in the later stage. Moreover, Fe2O3 became the main corrosion product in this status, as shown in Figure 8. Generally, Fe2O3 was more stable, the protective effect of FeCO3 was better than that of FeOOH [38], and the bilayer corrosion product layer in this status was more compact, so X80 steel could be passivated, as shown in Figure 2.
2FeOOH → 2Fe2O3 + H2O (12)
Fe2+ + HCO3- → FeCO3 + H+ (13)
5. CONCLUSION
(1) In the acidic soil simulated solution, the corrosion of X80 steel was controlled by the charge-transfer process. Under TEL, the corrosion mechanism of X80 steel was dependent on TEL thickness. Under TEL of 300 μm, the corrosion process was still related to the cathodic electrochemical reaction. As TEL reduced to 145 μm, the diffusion process of oxygen dominated the corrosion process of X80 steel. Whereas, the corrosion process of X80 steel was jointly controlled by cathodic process and anodic process under TEL of 70 μm, including the diffusion process of oxygen and corrosion products.
μm and 145 μm, the corrosion rate of X80 steel fluctuated with immersion time. Under TEL of 70 μm, the corrosion rate increased continuously but increased slowly in the later stage. After 96 h exposure, the corrosion extent of X80 steel with the TEL thickness was in the sequence of 70 μm > 300 μm > 145 μm.
(3) In the bulk solution, an incomplete corrosion product layer, γ-FeOOH and Fe3O4, was formed on the surface of X80 steel. With the decrease of TEL thickness, the corrosion product layer became more compact but layered, γ-FeOOH reduced significantly. Under TEL of 70 μm, the bilayer corrosion products, a few of Fe2O3, γ-FeOOH and FeCO3, was formed.
ACKNOWLEDGEMENTS
The authors are grateful to the National Natural Science Foundation of China (No. 51161021) for support to this work.
References
1. A. V. Borovikov, Metallurgist, 47 (2003) 415-418.
2. J. Niu, L. H. Qi, Y. L. Liu, L. Ma, Y. R. Feng, J. X. Zhang, Trans. Nonferrous. Met. Soc. China, 19 (2009) 573-578.
3. A. C. Toncre, Mater. Performance, 23 (1984) 22-27.
4. F. Gan, Z. W. Sun, G. Sabde, D. T. Sabde, Corrosion, 50 (1994) 804-816.
5. A. Eslami, B. Fang, R. Kania, B. Worthingham, J. Been, R. Eadie, W. Chen, Corros. Sci., 52 (2010) 3750-3756.
6. Z. Wang, J. Wang, E.H. Han, W. Ke, M. Yan, J. Zhang, C. Liu, Acta Metall. Sin., 48 (2012) 1267-1272.
7. E.S. Meresht, T.S. Farahani, J. Neshati, Eng. Fail. Anal., 18 (2011) 963-970. 8. B. Zhao, C. Du, X. Li, Z. Liu, X. Chen,Y. Li, Sci. Technol. Rev., 31 (2013) 72-79. 9. M. C. Yan, J. Q. Wang, E. H. Han,W. Ke, Corros. Eng. Sci. Technol., 42 (2007) 42-49. 10. M. C. Yan, J. Q. Wang, E. H. Han, W. Ke, Corros. Sci., 50 (2008) 1331-1339.
11. F. M. Song, D. W. Kirk, J. W. Graydon, Mater. Performance, 42 (2003) 24-26. 12. S. Papavinasam, R. W. Revie, Corros. Rev., 26 (2008) 295-371.
13. A. Eslami, R. Kania, B. Worthingham, G.V. Boven, R. Eadie, W. Chen, Corrosion, 69 (2013) 1103-1110.
14. R. Xu, A. Zhao, Q. Li, X. Kong and G. Ji, Geoderma, 115 (2003) 75-84.
15. M. C. Yan, C. Sun, J. Xu, J. H. Dong, W. Ke, Corros. Sci., 80 (2014) 309-317.
16. Y.H. Wu, T.M. Liu, C. Sun, J. Xu, C.K. Yu,Corros. Eng. Sci. Technol., 45 (2010) 136-141. 17. K. Mori, K. Tachi, M. Muramats, K. Torita, Pro. Org. Coat., 36 (1999) 34-38.
18. S. A. Arun, L. Uziel, H. P. Joe, J. Electrochem. Soc., 157 (2010) C9-C17. 19. A. Q. Fu, Y. F. Cheng, Corros. Sci., 51 (2009), 914-920.
20. C.F. Dong, A.Q. Fu, X.G. Li, Y.F. Cheng, Electrochim. Acta, 54 (2008), 628-633.
21. X. Chen, C. W. Du, X. G. Li, P. Liang, L. Lu, Int. J. Miner. Metall. Mater., 103 (2007) 9-13. 22. J.J. Perdomo, I. Song, Corros. Sci., 42 (2000) 1389-1415.
23. J.J. Perdomo, M.E. Chabica, I. Song, Corros. Sci., 43 (2001) 515-532.
24. Y.Q. Song, C.W. Du, X.G. Li, J. Univ. Sci. Technol. Beijing, 13 (2006), 37-43. 25. Y.-S. Choi, J.-G. Kim, Mater. Sci. Technol., 19 (2003) 1737-1745.
26. I. Matsushima, Corros. Eng., 51 (2002) 621-629.
28. M. C. Yan, J. Q. Wang, E. H. Han, C. Sun, W. Ke, Acta Metall. Sin., 50 (2014) 1137-1145. 29. M. Stratmann, H. Streckel, Corros. Sci., 30 (1990) 681-696.
30. Y. L. Cheng, Z. Zhang, F. H. Cao, J. F. Li, J. Q. Zhang, J. M. Wang, C. N. Cao, Corros. Sci., 46 (2004) 1649-1667.
31. T. Zhang, C. Chen, Y. Shao, G. Meng, F. Wang, X. Li, C. Dong, Electrochim. Acta, 53 (2008) 7921-7931.
32. S. X. Wang, D. X. Liu, N. Du, Q. Zhao, S. Y. Li, J. H. Xiao, Int. J. Electrochem. Sci., 10 (2015) 4393-4404.
33. Z. Liu, X. Li, Y. Zhang, C. Du, Acta Metall. Sin. (Engl. Lett.), 22 (2009) 58-64.
34. C. N. Cao, Principles of Electrochemistry of Corrosion, Third Edition, Chemical Industry Press, Beijing, 2008 (in Chinese).
35. M. C. Yan, C. Sun, J. Xu, W. Ke, Int. J. Electrochem. Sci., 10 (2015) 1762-1776. 36. L. Hamadou L, A. Kadri, N. Benbrahim, Appl. Surf. Sci., 252 (2005) 1510-1519.
37. X. N. Liao, F. H. Cao, A. N. Chen, W. J. Liu, J. Q. Zhang, C. N. Cao, Trans. Nonferrous Met. Soc. China, 22 (2012) 1239-1249.
38. X. H. Nie, X. G. Li, C. W. Du, Y. Z. Huang, H. Du, J. Raman Spectrosc., 40 (2009) 76-79. 39. M. Stratmann, H. Streckel, Corros. Sci., 30 (1990) 697-714.

![Figure 1. Schematic diagram of experiment arrangement for thin electrolyte layer [29-31].](https://thumb-us.123doks.com/thumbv2/123dok_us/1834546.139526/4.596.91.503.200.358/figure-schematic-diagram-experiment-arrangement-electrolyte-layer.webp)