R E S E A R C H
Open Access
Hot spot or not: a comparison of spatial statistical
methods to predict prospective malaria infections
Jacklin F Mosha
1*, Hugh JW Sturrock
2, Brian Greenwood
3, Colin J Sutherland
3, Nahla B Gadalla
3, Sharan Atwal
3,
Simon Hemelaar
3,4, Joelle M Brown
2,5, Chris Drakeley
3, Gibson Kibiki
6, Teun Bousema
3,4,
Daniel Chandramohan
3and Roland D Gosling
2Abstract
Background:Within affected communities,Plasmodium falciparuminfections may be skewed in distribution such that single or small clusters of households consistently harbour a disproportionate number of infected individuals throughout the year. Identifying these hotspots of malaria transmission would permit targeting of interventions and a more rapid reduction in malaria burden across the whole community. This study set out to compare different statistical methods of hotspot detection (SaTScan, kernel smoothing, weighted local prevalence) using different indicators (PCR positivity, AMA-1 and MSP-1 antibodies) for prediction of infection the following year.
Methods:Two full surveys of four villages in Mwanza, Tanzania were completed over consecutive years, 2010-2011. In both surveys, infection was assessed using nested polymerase chain reaction (nPCR). In addition in 2010,
serologic markers (AMA-1 and MSP-119antibodies) of exposure were assessed. Baseline clustering of infection and serological markers were assessed using three geospatial methods: spatial scan statistics, kernel analysis and weighted local prevalence analysis. Methods were compared in their ability to predict infection in the second year of the study using random effects logistic regression models, and comparisons of the area under the receiver operating curve (AUC) for each model. Sensitivity analysis was conducted to explore the effect of varying radius size for the kernel and weighted local prevalence methods and maximum population size for the spatial scan statistic. Results:Guided by AUC values, the kernel method and spatial scan statistics appeared to be more predictive of infection in the following year. Hotspots of PCR-detected infection and seropositivity to AMA-1 were predictive of subsequent infection. For the kernel method, a 1 km window was optimal. Similarly, allowing hotspots to contain up to 50% of the population was a better predictor of infection in the second year using spatial scan statistics than smaller maximum population sizes.
Conclusions:Clusters of AMA-1 seroprevalence or parasite prevalence that are predictive of infection a year later can be identified using geospatial models. Kernel smoothing using a 1 km window and spatial scan statistics both provided accurate prediction of future infection.
Keywords:Spatial methods, Malaria, Transmission, Hotspots, Micro-epidemiology, Serology, PCR, Africa,Plasmodium falciparum
* Correspondence:[email protected] 1
National Institute for Medical Research (NIMR), Mwanza Medical Research Centre, Mwanza, Tanzania
Full list of author information is available at the end of the article
Background
Malaria transmission in endemic countries is heteroge-neous over multiple spatial scales [1,2]. At the micro scale,P. falciparuminfections are frequently clustered in relatively few households that consistently have signifi-cantly more infections than others [3,4]. Many factors can contribute to this increased risk of malaria exposure, including design of housing, the proximity to mosquito breeding sites, host genetic factors, poor access to treat-ment, maternal education, wealth, and other as yet un-defined characteristics [3,5-8]. At sites with very low levels of transmission, such as those found in Swaziland, cases of symptomatic malaria detected at health facilities can help in identification of a hotspot, as additional asymptomatic cases can be found living in close proxim-ity to the index case [9]. In areas of moderate transmis-sion intensity, malaria hotspots may provide a reservoir of infected human hosts that can maintain some trans-mission year round. The individuals in such hotspots are thus likely to have acquired anti-parasite immunity and to carry parasites without clinical symptoms. In the wet season, when the mosquito population increases, these clusters of asymptomatic carriers may be responsible for seeding transmission to the rest of the community, in-cluding less immune people who are more likely to suf-fer symptomatic infections [7]. Thus in these settings, hotspots are difficult to identify using the distribution of clinical (symptomatic) malaria cases alone.
The most used geospatial method to detect clusters of infection is the spatial scan statistic [10-12]. Measures of exposure which have been explored using spatial scan statistics include prevalence of infection, incidence of clinical malaria and serological markers of malaria ex-posure [13-18]. While this approach allows identification of clusters using statistical hypothesis testing, it may ig-nore more subtle small-scale spatial heterogeneity and clusters that do not fit within circular or elliptical win-dows [19]. An alternative method that has been used to detect clustering of infection is distance-weighted preva-lence of infection, whereby infection prevapreva-lence in neighbours is used as a proxy measure for household level exposure [20,21]. This method allows for a smoother estimation of risk in space than spatial scan statistics.
This study seeks to determine which geospatial method best describes a malaria transmission hotspot by compar-ing methodologies uscompar-ing cross-sectional data collected during the first year of the study to predict the distribution of infections found in the second year.
Methods
Study site
Misungwi district (lat 2.85000 S, long 33.08333 E) is lo-cated 60 km from Mwanza town in the north-west of
Tanzania at an altitude of 1,178 m above sea level (see Figure 1). The district is rural with moderately intense malaria transmission; the overall prevalence of infection in the region is estimated to be 31.4% by microscopy in children 6 -59 months (Tanzania HIV and Malaria Indicator Survey 2008). The district has two annual rainy seasons, the long rains between February and May, and the short rains between November and December. The dry and relatively hot season falls between June and September. Malaria inci-dence peaks one to two months after the rains start. The National Malaria Control Programme (NMCP) carried out indoor residual spraying (IRS) in the study area during the period from late November 2010 to late January 2011.
Data collection
A census of four villages in a single ward was carried out in the dry season, between August and early Novem-ber 2010. All data were collected using personalized digital assistants and every household was visited and mapped using a global positioning system (GPS). All in-dividuals in the ward were invited to participate in the study. The head of household gave information on the age, sex and insecticide-treated net (ITN) use of those who were not present. Individuals who consented to join the study were asked to provide a finger-prick sample of blood which was spotted onto Whatman® standard 3 mm filter paper for parasite detection and serological analysis. Subjects who reported having had fever within the previous 24 hours were tested for malaria using a histidine-rich protein 2 (HRP2) rapid malaria diagnostic test (RDT, Paracheck-Pf®, Orchid Biomedical Systems, Goa, India) and referred to a study clinician for manage-ment of their febrile illness.
A follow-up survey was carried out in the same study villages during August to November 2011, one year after the initial study. The same procedures were carried out during the second survey as during the baseline survey.
Molecular estimation ofP. falciparuminfection
DNA was extracted from filter papers using the Chelex® (Sigma, USA) extraction method described previously [22] in 96 deep-well plates. Parasite DNA was detected using nested PCR (nPCR) targeting the 18S rRNA gene as previously described [23].
Serology
Antibodies were eluted from filter paper spots and assayed for specific IgG responses to P.falciparum AMA-1 and MSP-119 by ELISA as described by Corran
and OD values normalised to these. To define sero-prevalence a mixture model was applied to the OD data which assumed two inherent Gaussian distributions; a narrow distribution or sero-negatives and a broader dis-tribution of seropositives. A cut-off was calculated as the mean plus 3 standard deviations of the narrow distribu-tion and was calculated separately for each antigen [25].
Cluster analysis
While there are a range of different methodological ap-proaches to identifying clusters of infection [12,26], here we focus on three geospatial cluster detection methods to explore baseline clustering of infection and serological markers and their ability to predict infection in the sec-ond year of the study. The unit of analysis was the indi-vidual, meaning that clustering of infected individuals was assessed rather than clustering of households with infection. Infection in the second year was defined as a positive nPCR result recorded as a binary variable.
Satscan analysis
Spatial analysis was performed to assess possible cluster-ing of nPCR-positive individuals. A spatial scan statistic was obtained using the Bernoulli model [11] and SaTS-can software (SaTSSaTS-can, version 8.2.1). This software applies multiple circular windows, which are plastic in both position and size, across the study area. Each distinct circle represents a possible cluster. For each cir-cle, the number of observed and expected infected
individuals are counted, with expected numbers calcu-lated assuming an even distribution of infections across the population. As multiple infected and non-infected individuals can be specified at each household, the spatial distribution of households is accounted for. A likelihood ratio test is used to compare the prevalence of infection within the circle to that outside it to identify significant clusters of higher than expected (hotspot) or lower than expected (coldspot) prevalence. The statis-tical significance of this hotspot is evaluated taking into account the multiple tests for the many potential cluster locations and sizes evaluated as well as the distribution of the population [10]. The maximum proportion of the population that a cluster could contain was set at 50%. This method has been extensively explored in studies of the micro-epidemiology of malaria [12,13,27-29].
Households were grouped into three categories: 1) hotspots (clusters of significantly higher than expected malaria prevalence); 2) coldspots (clusters of significantly lower than expected malaria prevalence); and, 3) all other households. Clusters were defined using three measures: 1) nPCR positivity; 2) antibody seropositivity to AMA-1; 3) antibody sero-positivity to MSP-119; and,
4) antibody seropositivity to AMA-1and/or MSP-119. So
[image:3.595.57.540.89.331.2]to whether the household lay within the radius of the hot or coldspot.
Kernel analysis
Kernel density estimation is a statistical procedure used to produce a smoothed estimate of density of events, such as individuals, across space [26]. For any given point, the density of events within a predefined window is estimated, with the influence of events weighted ac-cording to the distance from the centre of the window. The weight assigned to each event is derived from the kernel function applied. In this analysis a quadratic ker-nel function was used with an initial window radius of 1 km. A quadratic function allows importance of data from neighbouring households to be relative to the dis-tance to the index household. To obtain a smoothed es-timate of infection prevalence over the study region, a kernel density surface of numbers nPCR positive was di-vided by a kernel density surface of numbers examined. This resulted in each household having a value between 0 (least exposed households) and 1 (most exposed house-holds). Households for which data were only available in the second year were assigned a prevalence value based on infection in neighbouring households only.
Weighted local prevalence analysis
This method calculates parasite prevalence amongst all neighbours within 1 km of the index house, weighting the prevalence estimate according to the inverse of the distance of the neighbouring house to the index house [20]. While a form of spatial smoothing, an important distinction between weighted local prevalence and kernel smoothing is that individuals in the index household are not included in the weighted prevalence estimate. As for kernel prevalence estimates, the weighted local preva-lence for each household ranged from 0 (least exposed households) to 1 (most exposed households). As this method does not include infection status of individuals in the index household in the calculation of prevalence, no further action was required for those households with data from only the second year.
Statistical analysis
To compare the ability of different cluster detection methods to predict infection in the second year, mixed effect logistic regression models was used. The outcome of interest was infection status by nPCR (0/1) in the sec-ond year. The risk factors explored were nPCR, AMA-1, MSP-119 and AMA-1 and/or MSP-119 (hereon termed
combined seroprevalence) cluster score in the first year (generated via each of the three cluster detection methods). Simple summary contingency tables, graphs and scatter plots with Lowess curves were used to ex-plore the relationship with potential risk factors and
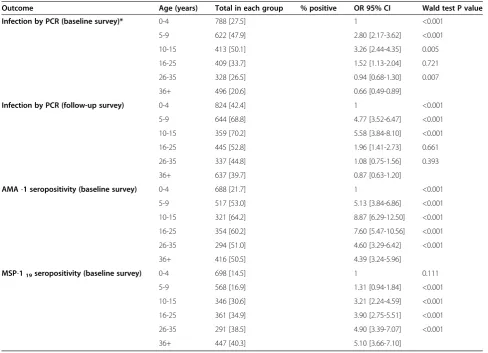
their associations with age. To explore the possibility of a non-linear relationship, risk factors were categorized into quartiles and a likelihood ratio test was used to as-sess which model (linear or categorical) was better. A household level random effect was included in the models to take account of correlation between individ-uals within the same household. All models were con-trolled for potential confounding by age, which due to an obvious non-linear relationship with infection was categorized before analysis into –zero to four years, five to nine years, ten to 15 years, 16-25 year, 26-35 years and over 36 years (Table 1).
To establish the effect of radius size on results ob-tained with the kernel and weighted local prevalence methods, models using different radii were built. In addition to the initial 1 km radius, radii of 500 m, 100 m and 0 m (i e, household) were explored. Models assum-ing individual level infection and serological status were also compared. Similarly, for the SaTScan analysis, max-imum population sizes of 20 and 10% were explored. To compare the predictive performance of using different methods and radii, the area under the receiver operating curve (AUC) was calculated for each model. AUC values were compared using DeLong’s test for paired ROC curves [30]. Statistical analysis was performed using STATA (version 12, College Station, TX, USA) and R (version 3.0.1) [31].
Results
Study subjects
In 2010, 668 households from randomly selected sub-villages participated in the first year survey, comprising a total of 3,801 individuals, 3,057 (80.4%) of whom were seen, consented to participate and provided a blood spe-cimen. Approximately half of the participants (n = 1,612, 52.7%) were male. The median age of the study popula-tion was 13 years (IQR = 5-30 years; range 1-99 years). The overall prevalence of P. falciparum by nPCR was 34.3%. In the second year survey, 697 households partic-ipated in the survey with 3,246 (85.4%) of eligible indi-viduals providing a blood specimen, 51.6% of whom were male. Distribution of age was similar to that of the first year survey.P. falciparumprevalence by nPCR was significantly higher at 51.9% than during the baseline survey (OR 1.95; 95% CI, 1.76-2.17; p <0.001).
Association of age and other individual factors with PCR positivity and seropositivity
8.87, 95% CI 6.29-12.5; P < 0.001). Seropositivity to MSP-119 showed a different relationship with age,
dis-playing a steady increase with age, with those aged >36 years having roughly five times the odds of being seropositive compared to those aged zero to four years (OR 5.10 95%, CI 3.66-7.10) (Table 1).
Prediction of infection in the second year survey nPCR prevalence in the baseline survey
Fifty-seven per cent of individuals who were nPCR posi-tive in the first year were also nPCR posiposi-tive in the second year whilst 47% who were negative in the first year were also negative in the second year (χ2
= 27.2; P <0.001). Guided by AUC values, clustering estimated using kernel analysis appeared to predict infection by nPCR in the sec-ond year more accurately than the weighted local preva-lence method (p = 0.016) (Table 2). While clustering estimated by SaTScan gave a higher AUC value than clus-tering by the weighted local prevalence method, there was no evidence for a difference in AUC (p = 0.12).
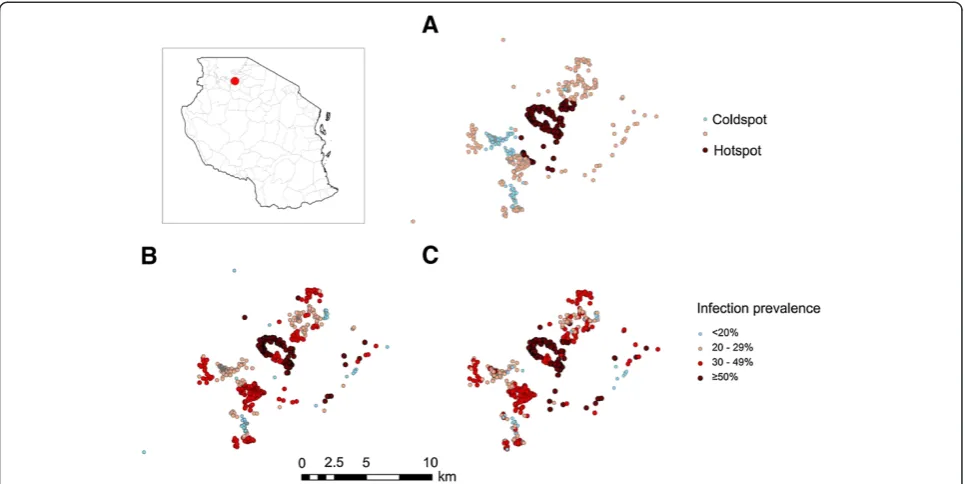
[image:5.595.55.544.99.452.2]Using SaTScan analysis to detect nPCR hotspots, one large cluster was identified with a radius of 2.88 km, covering 141 households and one small cluster was iden-tified with a radius of 0.1 km covering five households (Figure 1A). SaTScan analysis showed that individuals who were residing in a nPCR hotspot cluster in the first year had four times the odds of testing positive for mal-aria by nPCR in the second year than those residing in nPCR coldspots (OR 4.54 95% CI 2.68-7.72). The kernel and weighted local prevalence analyses showed a more complex distribution of hotspots (Figure 1B and C). Both clearly show the central hotspot detected by SaTS-can, but also show numerous other high transmission areas, more consistent with the micro-epidemiology of malaria. The kernel analysis also showed that individuals who were residing in the top quartile (areas with a high prevalence of infection by nPCR) had three times the odds of testing positive for malaria by nPCR in the sec-ond year compared to those living in the lowest quartile (OR 3.45, 95% CI 2.06-5.75).
Table 1 Age-dependency of malaria in the baseline and follow-up surveys
Outcome Age (years) Total in each group % positive OR 95% CI Wald test P value
Infection by PCR (baseline survey)* 0-4 788 [27.5] 1 <0.001
5-9 622 [47.9] 2.80 [2.17-3.62] <0.001
10-15 413 [50.1] 3.26 [2.44-4.35] 0.005
16-25 409 [33.7] 1.52 [1.13-2.04] 0.721
26-35 328 [26.5] 0.94 [0.68-1.30] 0.007
36+ 496 [20.6] 0.66 [0.49-0.89]
Infection by PCR (follow-up survey) 0-4 824 [42.4] 1 <0.001
5-9 644 [68.8] 4.77 [3.52-6.47] <0.001
10-15 359 [70.2] 5.58 [3.84-8.10] <0.001
16-25 445 [52.8] 1.96 [1.41-2.73] 0.661
26-35 337 [44.8] 1.08 [0.75-1.56] 0.393
36+ 637 [39.7] 0.87 [0.63-1.20]
AMA-1 seropositivity (baseline survey) 0-4 688 [21.7] 1 <0.001
5-9 517 [53.0] 5.13 [3.84-6.86] <0.001
10-15 321 [64.2] 8.87 [6.29-12.50] <0.001
16-25 354 [60.2] 7.60 [5.47-10.56] <0.001
26-35 294 [51.0] 4.60 [3.29-6.42] <0.001
36+ 416 [50.5] 4.39 [3.24-5.96]
MSP-119seropositivity (baseline survey) 0-4 698 [14.5] 1 0.111
5-9 568 [16.9] 1.31 [0.94-1.84] <0.001
10-15 346 [30.6] 3.21 [2.24-4.59] <0.001
16-25 361 [34.9] 3.90 [2.75-5.51] <0.001
26-35 291 [38.5] 4.90 [3.39-7.07] <0.001
36+ 447 [40.3] 5.10 [3.66-7.10]
Table 2 Odds of testing positive forP. falciparuminfection during the follow-up survey: results from three geospatial models defined by baseline infection, anti-AMA-1 antibody prevalence, and anti MSP-119antibody prevalence adjusted for age
Risk factor Number
tested
Malaria in second year n. %
OR 95% CI Wald test P-value
Area under the ROC curve
PCR individual infection in baseline survey*
Neg 1,763 827 [46.9] 1 <0.001 0.560
Pos 905 521 [57.6] 1.58 [1.31-1.83]
PCR prevalence
Satscan exposure category 792 319 [40.3] 1 0.181 0.620
coldspot 1,728 864 [50.0] 1.35 [0.87-2.09] <0.001 0.628
neither 726 500 [68.9] 4.54 [2.68-7.72] 0.966 0.597
hotspot 804 390 [48.5] 1 0.013
Kernel exposure quartiles 819 387 [47.2] 0.99 [0.60-1.64] <0.001
<14.9 818 331 [40.5] 0.53 [0.32-0.88] 0.165
15-21.3 805 575 [71.4] 3.45 [2.06-5.75] 0.042
21.4-27.1 816 420 [51.5] 1 0.003
>27.1 794 344 [43.3] 0.69 [0.41-1.16]
Weighted exposure quartiles 807 372 [46.1] 0.58 [0.35-0.98]
<18.9 799 520 [65.1] 2.21 [1.31-3.73]
19-23.2
23.3-26.5
>26.5
AMA-1 individual prevalence
No 1,262 594 [47.1] 1 <0.001 0.554
Yes 1,071 593 [55.4] 1.45 [1.21-1.72]
AMA-1 prevalence
Satscan exposure category 904 310 [34.3] 1 <0.001 0.647
coldspot 1,092 554 [50.7] 2.65 [1.69-4.15] <0.001 0.618
neither 1,250 819 [65.5] 5.84 [3.75-9.10] 0.002 0.609
hotspot 814 308 [37.8] 1 <0.001
Kernel exposure quartiles 813 414 [50.9] 2.26 [1.35-3.79] <0.001
<27.9 812 425 [52.3] 2.62 [1.57-4.39] 0.154
28-38.9 807 536 [66.4] 5.16 [3.06-8.69] <0.001
39-53.0 804 325 [40.4] 1 <0.001
>53.0 809 357 [44.1] 1.45 [0.86-2.44]
Weighted exposure quartiles 800 476 [59.5] 3.50 [2.07-5.91]
<18.9 803 498 [62.0] 3.33 [1.97-5.62]
19-23.9
24 -26.9
>26.9
MSP-119individual prevalence
No 1,730 924 [53.4] 1 0.196 0.541
Yes 681 341 [50.1] 0.88 [0.73-1.06]
Seropositivity to AMA-1 and MSP-119antibodies
Defining clusters of seroprevalence using AMA-1 and MSP-119 antibodies separately improved prediction of
nPCR positivity in the second year compared to using combined seroprevalence. SaTScan analysis revealed that individuals living in areas of high AMA-1 sero-prevalence (hotspots) in the first year had five times the odds of being nPCR positive in the second year com-pared to those who lived in AMA-1 coldspots (OR 5.84 95% CI 3.75-9.10), adjusting for age (Table 2). SaTScan
could not identify any significant clusters using com-bined seroprevalence.
[image:7.595.57.540.121.577.2]When clusters were identified by kernel analysis, those individuals living in households with the highest quartile of AMA-1 seroprevalence (hotspots) had a more than five times the odds of being nPCR positive in the second year than those in the lowest quintile (OR 5.16 95% CI 3.06-8.69), adjusting for age (Table 2). Using weighted local prevalence scores to distinguish clusters showed a similar pattern, those residing in the households in the
Table 2 Odds of testing positive forP. falciparuminfection during the follow-up survey: results from three geospatial models defined by baseline infection, anti-AMA-1 antibody prevalence, and anti MSP-119antibody prevalence
adjusted for age(Continued)
Satscan exposure category 1,703 992 [58.2] 1 0.040 0.591
coldspot 967 493 [51.0] 0.64 [0.41-0.98] <0.001 0.622
neither 576 198 [34.0] 0.21 [0.13-0.34] 0.773 0.625
hotspot 806 418 [51.9] 1 0.008 0.631
Kernel exposure quartiles 835 440 [52.7] 1.08 [0.65-1.78] <0.001
<12.9 808 538 [66.6] 2.02 [1.21-3.38] 0.715
13-17.3 797 287 [36.0] 0.34 [0.20-0.55] 0.006
17.4-25.4 805 415 [51.6] 1 <0.001
>25.4 813 430 [52.9] 1.10 [0.66-1.81]
Weighted exposure quartiles 802 533 [66.5] 2.08 [1.23-3.51]
<16.5 796 278 [34.9] 0.35 [0.21-0.57]
16.6-18.3
18.4-22.7
>22.7
MSP-119&/or AMA-1 individual prevalence
No 986 253 [25.6] 1 0.986 0.530
Yes 1,237 466 [37.7] 1.00 [0.78-1.29]
MSP-119&/or AMA-1 prevalence
Satscan exposure category - 400 [48.4] - -
-coldspot - 357 [44.6] - - 0.604
neither - 386 [47.0] - - 0.530
hotspot 827 540 [67.8] 1 0.082
Kernel exposure quartiles 800 402 [49.3] 0.63 [0.37 -1.07]
0.310
<44.5 822 380 [47.4] 0.77 [0.46-1.28] 0.001
44.6-51.4 797 372 [45.6] 2.44 [1.44-4.14] 0.507
51.5-59.3 816 502 [64.0] 1 0.063
>59.4 801 0.84 [0.49-1.42] 0.023
Weighted exposure quartiles 815 0.60 [0.36-1.03]
<16.5 784 1.86 [1.09-3.18]
16.6-18.3
18.4-22.7
>22.7
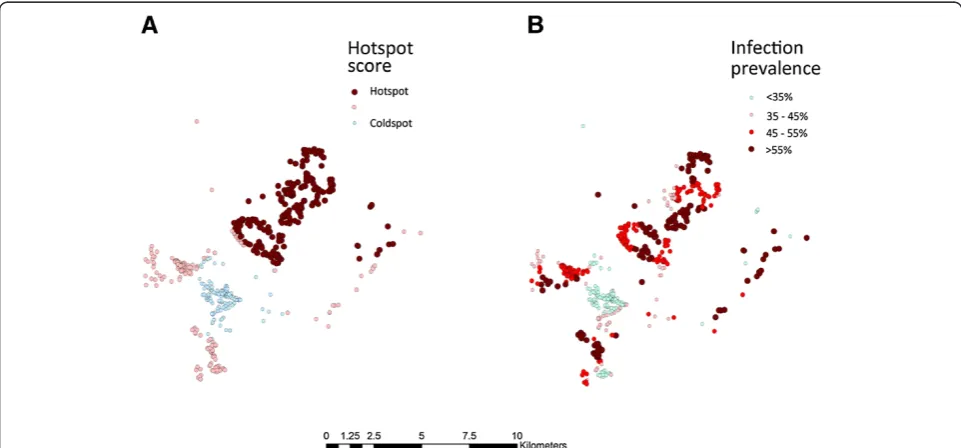
top quartile of AMA-1 seroprevalence (hotspots) had more than three times the odds of being nPCR positive than those residing in lowest quartile (OR 3.33 95% CI 1.97-5.62) (Table 2). Likewise the kernel analyses showed a more complex distribution of AMA-1 hotspots than SaTScan analysis (Figure 2). A comparison of the pre-dictive ability of different clustering methods showed that both SaTScan and kernel analysis yielded higher AUC values than the weighted prevalence method, how-ever, only the SaTScan method produced a significantly different result (p = 0.002 and p = 0.27 respectively).
Antibody responses to MSP-119showed a less clear
as-sociation with infection in the second year, with individ-ual age-adjusted seroprevalence at baseline showing no relationship with infection status in the second year. SaTScan analysis suggested that individuals living in MSP-119 hotspots were at lower risk of infection in the
second year. Both kernel and distance weighted preva-lence analysis also suggested individuals living in areas of highest MSP-1 seroprevalence were at lower risk of infection, however those living in areas of intermediate seroprevalence (third quartile) were at higher risk of subsequent infection.
Individual seropositivity at baseline to the combined seroprevalence of AMA-1 and/ or MSP-119 antibodies
showed no relationship with infection in the second year. Similar to results using just AMA-1, kernel analysis of combined seroprevalence showed that those individ-uals living in the highest quartile had more than two times the odds of being nPCR positive in the second
year than those residing in the lowest quintile (OR 2.44 95% CI 1.44-4.14). While a similar relationship was seen if hotspots were determined by weighted local preva-lence, overall predictive ability using this method was worse than when using kernels with an AUC value of 0.530 (Table 2). SaTScan was not able to find any hot-spots or coldhot-spots using combined seroprevalence.
Sensitivity analysis of kernel and SaTScan methods for determining the best radius to predict malaria in the second year of follow-up
Based on AUC values, the weighted local prevalence method to identify clusters was generally less predictive of infection in the second year than the SaTScan and kernel methods. Sensitivity analyses of these two methods were therefore conducted to determine the ra-dius size that best predicted infection in the second year. For the kernel method, using larger radii to identify clus-ters of nPCR tended to produced similar AUC values than smaller radii (Table 3). Using larger radii of 500 m and 1 km to identify clusters of AMA-1 seroprevalence, MSP-119 or the antigens combined, generally produced
[image:8.595.57.538.479.703.2]higher AUC values. Similar sensitivity analyses were done for SaTScan, whereby the maximum population size allowable was set to 20 and 10%. As for the kernel analysis, there was a general trend to suggest that a lar-ger maximum population size of 50%, which allows for larger geographic clusters, was more predictive of subse-quent infection than smaller maximum population sizes (Table 3).
Discussion
It has been suggested that if malaria transmission hot-spots can be identified, targeting interventions can have a improved impact on transmission [7]. A number of previous studies have explored the use of geospatial techniques to identify clusters of transmission markers such as infection or seropositivity to selected antigens [13,14,18,28,32,33]. These studies show that households with active and historic exposure tend to cluster to-gether geographically. It is less clear however, whether these clusters predict future infection and if so, which geospatial techniques and transmission indicators should be used for their detection. Using two consecutive years’ data, this study shows that clusters of infection and sero-positivity to AMA-1 are predictive of future infection and that kernel analysis and SaTScan are superior to the weighted local prevalence method of cluster detection.
Several authors have identified the existence of hot-spots at single time points, using a variety of different measures of transmission [13,18,28]. Fewer studies have shown that hotspots are stable over time. Using data from multiple years in Kenya, Bejonet al. applied spatial scan statistics to identify infection hotspots that were predictive of future hotspots up to seven years later [14]. Another study done in a highland of Kenya by Ernst et al. identified stable spatial clusters of malaria cases by SaTScan statistics over a period of four years [33]. Again using spatial scan statistics, Bousema et al. showed that
over the period of two years, clinical episodes of malaria cluster into hotspots [13]. This study is consistent with these findings, showing that hotspots of infection are predictive of future infection. The study also shows that being seropositive to AMA-1 or being in a hotspot of AMA-1 seroprevalence is predictive of future infection. As seropositivity to AMA-1 is indicative of recent expos-ure to P. falciparum, this finding adds further evidence that hotspots of transmission are stable over several years. The relatively low AUC values do, however, sug-gest the importance of other factors related to risk of in-fection that were not accounted for. In addition, the higher prevalence of infection seen in the second year, likely due to higher rainfall observed that year, led to some infections in non-hotspot households, which nega-tively impacts the AUC.
The relationship between hotspots of seropositivity to MSP-119 and future infection was less clear. Clusters
with high MSP-1 seroprevalence were found to be at lower risk of infection suggesting some protection at the neighbourhood level. However, whilst some studies have demonstrated a protective effect of antibodies to MSP-119, [34-37] at the individual level, this was not observed
[image:9.595.75.539.462.726.2]in this study. The reasons for these observations and the differences in the patterns seen with AMA-1 require fur-ther investigation but they may relate to the differing immunogenicity and half-life of the antibody response to these two antigens [38].
Table 3 Sensitivity analysis of kernel and SaTScan analysis of PCR and serology prevalence for prediction of infection in the second year
KERNEL SaTScan
Radius Window population size
Exposure category <1 m (Household) 100 m 500 m 1,000 m 10% 20% 50%
PCR prevalence quartiles 0.612 0.622 0.611 0.628 0.593 0.616 0.620
Area under ROC
Proportion of total nPCR positive in the highest quartile in second year΅ 30.1% 30.2% 33.1% 34.2% 27.1% 29.7% 29.7%
Proportion of the total study population included highest quartile 23.4% 22.7% 25.2% 24.8% 20.3% 22.4% 22.4%
AMA-1 prevalence quartiles 0.583 0.587 0.619 0.618 0.602 0.615 0.647
Area under ROC
Proportion of total nPCR positive in the highest quartile in second year΅ 26.6% 29.0% 31.8% 31.9 9.7% 28.9% 48.3%
Proportion of the total study population included highest quartile 22.6% 24.9% 24.8 24.9 6.72% 22.6% 38.0%
MSP-119prevalence quartiles 0.559 0.533 0.602 0.622 0.595 0.612 0.591
Area under ROC
Proportion of total nPCR positive in the highest quartile I second year 22.7% 22.8% 19.6% 17.1% 9.4% 11.8% 12.0%
Proportion of the total study population included in the highest quartile 24.9% 24.6% 24.5% 24.5% 13.7% 17.7% 17.8%
MSP-119&/or AMA-1 prevalence quartiles 0.575 0.580 0.585 0.604 - -
-Area under ROC
Proportion of total nPCR positive in the highest quartile in second year 28.7% 30.8% 31.1% 32.6%
Proportion of the total study population included highest quartile 24.6% 24.7% 24.9% 24.5%
In terms of methods to detect clusters, this study sug-gests that using spatial scan statistics or kernel analysis allows better characterization of hotspots than the weighted local prevalence method. This may be due to the fact that estimates of weighted local prevalence for each household are made using infection status of neigh-bours only. This likely leads to an inferior indication of hotspot location as individual or household level factors play an important role in risk of subsequent infection in that household. Sensitivity analyses, varying both the window size and maximum population size for kernel and SaTScan analysis respectively, suggests that gener-ally hotspots form over larger (1-3 km) scales. While this likely varies by setting, similarly sized hotspots have been detected by previous studies in similar transmission settings [13,14,20]. In lower transmission settings, trans-mission appears to cluster over increasingly small scales. A recent study by Searle et al. in Zambia, where infec-tion prevalence was estimated to be 23% by rapid diag-nostic test (RDT), showed that active case detection within a 500-m radius could identify 76% of all RDT-positive individuals [39]. A study in Swaziland, where transmission is extremely low (PCR-derived parasite prevalence <1%), suggested that infections tend to clus-ter within households of passively detected cases [9].
This study has several potential operational implica-tions for malaria control. Firstly, given the apparent sta-bility of hotspots, targeting clusters of infection and seropositivity to AMA-1 (and/or antigens with similar properties) with complete cure treatment and vector control could have a dramatic impact on transmission [7]. Secondly, kernel analysis and SaTScan appear to be optimal methods to detect hotspots. Currently, establish-ment of seropositivity to AMA-1 can only be done using assays that require samples to be processed in the la-boratory. Equally, while RDTs exist for determining in-fection status, these miss a large fraction of inin-fections, most of which are likely to be subpatent [40-42]. Previ-ous work has shown that these subpatent infections tend to cluster in hotspots, making RDTs inappropriate methods to detect hotspots [43]. In order to target inter-ventions at hotspots, therefore, the development of sen-sitive rapid diagnostics for infection and seropositivity to AMA-1 (or similar) is required. Alternatively, it may be possible to identify hotspots in the field by clustering of particular risk factors or passively detected cases. This is the focus of further research. In the meantime, in the setting of moderate malaria transmission around Lake Victoria, mass drug administration of entire villages may be required to interrupt transmission [43].
Limitations
This study used indirect measures to define household malaria exposure. Using more direct measures, such as
entomological inoculation rate (EIR) and other vector measures, may have led to different results. However, EIR can be challenging to measure in low-endemic set-tings. Thus, individual parasite prevalence was chosen as the measure of subsequent transmission for this study. In addition, indoor residual spraying (IRS) was applied between survey periods throughout the study area. While there is no supporting data, it is likely that house-holds that did not receive IRS were randomly distributed and therefore unlikely to introduce bias into the results. Lastly, the study continued for only two years, thus sta-bility of malaria hotspots could only be predicted for that time period. However, as stated, the fact that hot-spots of AMA-1 seroprevalence were predictive of future infection suggests transmission hotspots are stable over a longer time frame.
Conclusions
This study supports previous work showing that hotspots can be defined using geospatial methods and are stable over a period of at least one year. Hotspots can be de-tected either by using parasite prevalence or seropreva-lence of AMA-1 antibodies. It was also found that spatial scan statistics and kernel analysis were better at character-izing hotspots of transmission than the weighted local prevalence method. Given the lack of highly sensitive rapid diagnostic tests for infection and AMA-1 seroposi-tivity, routine detection of hotspots is challenging. Further work exploring simple methods to identify hotspots with existing tools is therefore required. Furthermore, while theorized, it has yet to be shown in the field that targeting interventions does indeed lead to greater reductions in transmission over an untargeted approach. Studies linking methods of hotspot detection with assessments of the sub-sequent impact of targeted interventions would be ex-tremely valuable.
Competing interests
The authors declare that they have no competing interests.
Authors’contribution
JFM was involved in the study design, supervised the implementation of the study and data collection, analysed data, drafted and revised the manuscript. HJWS was involved in data analysis, interpretation of the data, drafted and revised the manuscript. DC and RDG were involved in overall study design and supervision, interpretation of the data and revisions of the manuscript. TB, CJS and CD were involved in supervision of laboratory work, interpretation of the data and revision of the manuscript. BG, JMB and KG were involved in interpretation of the data and revisions of the manuscript. NG, SA and SH performed the real time PCR testing, serology testing and revised the manuscript. All authors have read and approved the final version of the manuscript.
Acknowledgements
data management. We acknowledge support of John Changalucha and the management team of NIMR Mwanza Centre.
Author details
1National Institute for Medical Research (NIMR), Mwanza Medical Research Centre, Mwanza, Tanzania.2The Global Health Group, University of California, San Francisco, CA, USA.3Faculty of Infectious and Tropical Diseases, London School of Hygiene and Tropical Medicine, London, UK.4Department of Medical Microbiology, Radboud University Nijmegen Medical Centre, Nijmegen, The Netherlands.5Department of Epidemiology and Biostatistics, University of California San Francisco, San Francisco, CA, USA.6Kilimanjaro Clinical Research Institute and Kilimanjaro Christian Medical College, Kilimanjaro, Moshi, Tanzania.
Received: 6 December 2013 Accepted: 6 February 2014 Published: 11 February 2014
References
1. Woolhouse ME, Dye C, Etard JF, Smith T, Charlwood JD, Garnett GP, Hagan P, Hii JL, Ndhlovu PD, Quinnell RJ, Watts CH, Chandiwana SK, Anderson RM: Heterogeneities in the transmission of infectious agents: implications for the design of control programs.Proc Natl Acad Sci USA1997,94:338–342. 2. Mwangi TW, Fegan G, Williams TN, Kinyanjui SM, Snow RW, Marsh K:
Evidence for over-dispersion in the distribution of clinical malaria episodes in children.PLoS One2008,3:e2196.
3. Gamage-Mendis AC, Carter R, Mendis C, De Zoysa AP, Herath PR, Mendis KN:Clustering of malaria infections within an endemic population: risk of malaria associated with the type of housing construction.Am J Trop Med Hyg1991,45:77–85.
4. Carter R, Mendis KN, Roberts D:Spatial targeting of interventions against malaria.Bull World Health Organ2000,78:1401–1411.
5. Ghebreyesus TA, Haile M, Witten KH, Getachew A, Yohannes M, Lindsay SW, Byass P:Household risk factors for malaria among children in the Ethiopian highlands.Trans R Soc Trop Med Hyg2000,94:17–21. 6. Lindsay SW, Jawara M, Paine K, Pinder M, Walraven GEL, Emerson PM:
Changes in house design reduce exposure to malaria mosquitoes.
Trop Med Int Health2003,8:512–517.
7. Bousema T, Griffin JT, Sauerwein RW, Smith DL, Churcher TS, Takken W, Ghani A, Drakeley C, Gosling R:Hitting hotspots: spatial targeting of malaria for control and elimination.PLoS Med2012,9:e1001165. 8. Midega JT, Smith DL, Olotu A, Mwangangi JM, Nzovu JG, Wambua J,
Nyangweso G, Mbogo CM, Christophides GK, Marsh K, Bejon P:Wind direction and proximity to larval sites determines malaria risk in Kilifi District in Kenya.Nat Comm2012,3:674.
9. Sturrock HJW, Novotny JM, Kunene S, Dlamini S, Zulu Z, Cohen JM, Hsiang MS, Greenhouse B, Gosling RD:Reactive case detection for malaria elimination: real-life experience from an ongoing program in Swaziland.
PLoS ONE2013,8:e63830.
10. Kulldorff M:A spatial -scan statistic.Community Statistic Theory Methods
1997,26:1481–1496.
11. Kulldorff M:SaTScan -Software for the spatial, temporal, and space-time scan statistics.Boston: Harvard Medical School and Harvard PilgrimHealth Care; 2010.
12. Pullan RL, Sturrock HJW, Soares Magalhaes RJ, Clements ACA, Brooker SJ: Spatial parasite ecology and epidemiology: a review of methods and applications.Parasitology2012,139:1870–1887.
13. Bousema T, Drakeley C, Gesase S, Hashim R, Magesa S, Mosha F, Otieno S, Carneiro I, Cox J, Msuya E, Kleinschmidt I, Maxwell C, Greenwood B, Riley E, Sauerwein R, Chandramohan D, Gosling R:Identification of hot spots of malaria transmission for targeted malaria control.J Infect Dis2010, 201:1764–1774.
14. Bejon P, Williams TN, Liljander A, Noor AM, Wambua J, Ogada E, Olotu A, Osier FHA, Hay SI, Farnert A, Marsh K:Stable and unstable malaria hotspots in longitudinal cohort studies in Kenya.PLoS Med2010, 7:e1000304.
15. Kreuels B, Kobbe R, Adjei S, Kreuzberg C, von Reden C, Bater K, Klug S, Busch W, Adjei O, May J:Spatial variation of malaria incidence in young children from a geographically homogeneous area with high endemicity.J Infect Dis2008,197:85–93.
16. Cook J, Kleinschmidt I, Schwabe C, Nseng G, Bousema T, Corran PH, Riley EM, Drakeley CJ:Serological markers suggest heterogeneity of
effectiveness of malaria control interventions on Bioko Island, equatorial Guinea.PLoS ONE2011,6:e25137.
17. Stone W, Bousema T, Jones S, Gesase S, Hashim R, Gosling R, Carneiro I, Chandramohan D, Theander T, Ronca R, Modiano D, Arca B, Drakeley C:IgG responses toAnopheles gambiaesalivary antigen gSG6 detect variation in exposure to malaria vectors and disease risk.PLoS ONE2012,7:e40170. 18. Bejon P, Turner L, Lavstsen T, Cham G, Olotu A, Drakeley CJ, Lievens M,
Vekemans J, Savarese B, Lusingu J, von Seidlein L, Bull PC, Marsh K, Theander TG:Serological evidence of discrete spatial clusters of Plasmodium falciparumparasites.PLoS ONE2011,6:e21711. 19. Aamodt G, Samuelsen SO, Skrondal A:A simulation study of three
methods for detecting disease clusters.Int J Health Geogr2006,5:15. 20. Olotu A, Fegan G, Wambua J, Nyangweso G, Ogada E, Drakeley C, Marsh K,
Bejon P:Estimating individual exposure to malaria using local prevalence of malaria infection in the field.PLoS ONE2012,7:e32929.
21. Olotu A, Fegan G, Wambua J, Nyangweso G, Awuondo KO, Leach A, Lievens M, Leboulleux D, Njuguna P, Peshu N, Marsh K, Bejon P:Four-year efficacy of RTS, S/AS01E and its interaction with malaria exposure.N Engl J Med
2013,368:1111–1120.
22. Plowe CV, Djimde A, Bouare M, Doumbo O, Wellems TE:Pyrimethamine and proguanil resistance-conferring mutations inPlasmodium falciparum dihydrofolate reductase: polymerase chain reaction methods for surveillance in Africa.Am J Trop Med Hyg1995,52:565–568. 23. Snounou G, Singh B:Nested PCR analysis of Plasmodium parasites.
Meth Mol Med2002,72:189–203.
24. Corran PH, Cook J, Lynch C, Leendertse H, Manjurano A, Griffin J, Cox J, Abeku T, Bousema T, Ghani AC, Drakeley C, Riley E:Dried blood spots as a source of anti-malarial antibodies for epidemiological studies.Malar J
2008,7:195.
25. Stewart L, Gosling R, Griffin J, Gesase S, Campo J, Hashim R, Masika P, Mosha J, Bousema T, Shekalaghe S, Cook J, Corran P, Ghani A, Riley EM, Drakeley C:Rapid assessment of malaria transmission using age-specific sero-conversion rates.PLoS One2009,4:e6083.
26. Pfeiffer DU, Robinson TP, Stevenson M, Stevens KB, Rogers DJ, Clements ACA:Analysis in Epidemiology.New York: Oxford University Press; 2008. 27. Oesterholt MJAM, Bousema JT, Mwerinde OK, Harris C, Lushino P, Masokoto
A, Mwerinde H, Mosha FW, Drakeley CJ:Spatial and temporal variation in malaria transmission in a low endemicity area in northern Tanzania.
Malar J2006,5:98.
28. Brooker S, Clarke S, Njagi JK, Polack S, Mugo B, Estambale B, Muchiri E, Magnussen P, Cox J:Spatial clustering of malaria and associated risk factors during an epidemic in a highland area of western Kenya.Trop Med Int Health2004,9:757–766.
29. Shabani J, Lutambi AM, Mwakalinga V, Masanja H:Clustering of under-five mortality in Rufiji Health and Demographic Surveillance System in rural Tanzania.Glob Health Action2010,3. doi: 10.3402/gha.v3i0.5264. 30. DeLong ER, DeLong DM, Clarke-Pearson DL:Comparing the areas under
two or more correlated receiver operating characteristic curves: a nonparametric approach.Biometrics1988,44:837–845.
31. Team RC:R: A language and enviroment for statistical computing.Vienna, Australia: R foundation for statistical computing; 2013. ISBN 3-900051-07-0, URL. 32. Drakeley CJ, Corran PH, Coleman PG, Tongren JE, McDonald SLR, Carneiro I,
Malima R, Lusingu J, Manjurano A, Nkya WMM, Lemnge MM, Cox J, Reyburn H, Riley E:Estimating medium- and long-term trends in malaria transmission by using serological markers of malaria exposure.
Proc Natl Acad Sci USA2005,102:5108–5113.
33. Ernst KC, Adoka SO, Kowuor DO, Wilson ML, John CC:Malaria hotspot areas in a highland Kenya site are consistent in epidemic and non-epidemic years and are associated with ecological factors.
Malar J2006,5:78.
34. Al-Yaman F, Genton B, Kramer KJ, Chang SP, Hui GS, Baisor M, Alpers MP: Assessment of the role of naturally acquired antibody levels to Plasmodium falciparummerozoite surface protein-1 in protecting Papua New Guinean children from malaria morbidity.Am J Trop Med Hyg1996, 54:443–448.
35. Egan AF, Morris J, Barnish G, Allen S, Greenwood BM, Kaslow DC, Holder AA, Riley EM:Clinical immunity toPlasmodium falciparummalaria is associated with serum antibodies to the 19-kDa C-terminal fragment of the merozoite surface antigen, PfMSP-1.J Infect Dis1996,173:765–769. 36. Conway DJ, Cavanagh DR, Tanabe K, Roper C, Mikes ZS, Sakihama N, Bojang
principal target of human immunity to malaria identified by molecular population genetic and immunological analyses.Nat Med2000, 6:689–692.
37. Perraut R, Marrama L, Diouf B, Sokhna C, Tall A, Nabeth P, Trape J-F, Longacre S, Mercereau-Puijalon O:Antibodies to the conserved C-terminal domain of thePlasmodium falciparummerozoite surface protein 1 and to the merozoite extract and their relationship with in vitro inhibitory antibodies and protection against clinical malaria in a Senegalese village.
J Infect Dis2005,191:264–271.
38. Corran P, Coleman P, Riley E, Drakeley C:Serology: a robust indicator of malaria transmission intensity?Trends Parasitol2007,23:575–582. 39. Searle KM, Shields T, Hamapumbu H, Kobayashi T, Mharakurwa S, Thuma PE,
Smith DL, Glass G, Moss WJ:Efficiency of household reactive case detection for malaria in rural southern Zambia: simulations based on cross-sectional surveys from two epidemiological settings.PLoS One
2013,8:e70972.
40. Okell LC, Ghani AC, Lyons E, Drakeley CJ:Submicroscopic infection in Plasmodium falciparum-endemic populations: a systematic review and meta-analysis.J Infect Dis2009,200:1509–1517.
41. Okell LC, Bousema T, Griffin JT, Ouedraogo AL, Ghani AC, Drakeley CJ: Factors determining the occurrence of submicroscopic malaria infections and their relevance for control.Nat Comm2012,3:1237.
42. Manjurano A, Okell L, Lukindo T, Reyburn H, Olomi R, Roper C, Clark TG, Joseph S, Riley EM, Drakeley C:Association of sub-microscopic malaria parasite carriage with transmission intensity in north-eastern Tanzania.
Malar J2011,10:370.
43. Mosha JF, Sturrock HJ, Greenhouse B, Greenwood B, Sutherland CJ, Gadalla N, Atwal S, Drakeley C, Kibiki G, Bousema T, Chandramohan D, Gosling R: Epidemiology of subpatentPlasmodium falciparuminfection:
implications for detection of hotspots with imperfect diagnostics.Malar J
2013,12:221.
doi:10.1186/1475-2875-13-53
Cite this article as:Moshaet al.:Hot spot or not: a comparison of spatial statistical methods to predict prospective malaria infections.Malaria Journal201413:53.
Submit your next manuscript to BioMed Central and take full advantage of:
• Convenient online submission
• Thorough peer review
• No space constraints or color figure charges
• Immediate publication on acceptance
• Inclusion in PubMed, CAS, Scopus and Google Scholar
• Research which is freely available for redistribution