City, University of London Institutional Repository
Citation
:
Riaz, A., Asad, M., Al-Arif, S. M., Alonso, E. ORCID: 0000-0002-3306-695X,
Dima, D. ORCID: 0000-0002-2598-0952, Corr, P. J. ORCID: 0000-0002-7618-0058 and
Slabaugh, G. G. (2018). DeepFMRI: And End-to-End Deep Network for Classification of
FRMI Data. 2018 IEEE 15th International Symposium on Biomedical Imaging (ISBI 2018),
pp. 1419-1422. doi: 10.1109/ISBI.2018.8363838
This is the accepted version of the paper.
This version of the publication may differ from the final published
version.
Permanent repository link:
http://openaccess.city.ac.uk/id/eprint/20026/
Link to published version
:
http://dx.doi.org/10.1109/ISBI.2018.8363838
Copyright and reuse:
City Research Online aims to make research
outputs of City, University of London available to a wider audience.
Copyright and Moral Rights remain with the author(s) and/or copyright
holders. URLs from City Research Online may be freely distributed and
linked to.
City Research Online:
http://openaccess.city.ac.uk/
[email protected]
DEEP FMRI: AN END-TO-END DEEP NETWORK FOR CLASSIFICATION OF FMRI DATA
Atif Riaz
Muhammad Asad
S M Masudur Rahman Al Arif
Eduardo Alonso
Danai Dima
Philip Corr
Greg Slabaugh
City, University of London, UK
ABSTRACT
With recent advancements in machine learning, the research community has made tremendous advances towards the clas-sification of neurological disorders from time-series func-tional MRI signals. However, existing classification tech-niques rely on hand-crafted features and classical machine learning models. In this paper, we propose an end-to-end model that utilizes the representation learning capability of deep learning to classify a neurological disorder from fMRI data. The proposed DeepFMRI model is comprised of three networks, namely (1) a feature extractor, (2) a similarity net-work, and (3) a classification network. The model takes fMRI raw time-series signals as input and outputs the predicted labels; and is trained end-to-end using back-propagation. Experimental results on the publicly available ADHD-200 dataset demonstrate that this innovative model outperforms previous state-of-the-art.
Index Terms— Deep learning, end-to-end model, fMRI classification
1. INTRODUCTION
In recent years, functional magnetic resonance imaging (fMRI) has emerged as a popular neuroimaging modality for classification of neurological disorders. Specifically, rest-ing state fMRI has emerged as a powerful tool to study the functional organization of the brain. Many studies [1–3] have shown promising outcomes in the classification of brain dis-orders like attention deficit hyperactivity disorder (ADHD), schizophrenia and Alzheimer’s disease by studying brain functional networks in resting state fMRI. fMRI data can be viewed as a 4D tensor such that the 3D volume of the brain is divided into small voxels or regions and the activity of each region is recorded for a certain duration. Two brain regions that show synchronous functional activity are assumed to be functionally connected. Functional connectivity is viewed as a pair-wise connectivity measurement that describes the strength of temporal coherence between the brain regions. A number of recent studies have shown functional connectiv-ity as an important biomarker for discrimination of different
We gratefully acknowledge the support of NVIDIA Corporation with the donation of the Titan X Pascal GPU used for this research.
brain disorders like ADHD [1], schizophrenia [3] and many more.
ADHD is one of the most common neuro-developmental and mental disorders affecting 5-10% of school going chil-dren [2], contributing to lifetime impairment [4], poor quality of life [5] and long-term burden on affected families [4, 5]. Like many other neurological disorders, the underlying mech-anism of ADHD is still unknown [2]. As there is no single confirmed diagnostic method available for ADHD, diagnosis is dependent upon observations conducted by medical practi-tioners or parents, typically over a period of months.
Several techniques have applied hand-crafted features for classification of ADHD from fMRI data, such as correlation [3], clustering [1] and graph [2] measures of functional con-nectivity. Discriminant features are selected and presented to a classical machine learning classifier for final prediction. However, in the machine learning literature, deep learning has proved to be a powerful paradigm to simultaneously learn dis-criminant features and a classifier [6].
End-to-end deep learning networks have been shown to outperform classical machine learning models in a number of domains like image classification, image segmentation and object recognition [6]. Generally speaking, an end-to-end trainable network refers to a single learning system where the predicted label of a machine learning process is predicted directly from the raw input, with all weights learned through back-propagation. Recently, a deep learning method named FCNet [7] has been proposed for classification of ADHD from fMRI data. The method uses a convolutional neural network (CNN) to predict functional connectivity of brain regions. However, after predicting functional connectivity using deep learning, the method uses classical machine learn-ing methods to extract discriminant features and an SVM classifier to predict classification labels.
To our knowledge, this paper presents the first end-to-end deep learning model for classification of a neurological disor-der from fMRI data. Particularly, we are interested to see if a deep learning model can be designed for the classification of a neurological disorder and if it is able to outperform classical machine learning models.
layers are fine-tuned during training to learn the features of in-dividual brain regions. During training, the end-to-end model learns weights to distinguish between the healthy control and ADHD subjects. Once the model is trained, unseen data is provided and the model predicts the classification label.
The contributions of this paper include: 1) a novel deep learning end-to-end model that simultaneously learns the most discriminant features and a classifier to classify fMRI data, and 2) an improved classification accuracy over the state-of-the-art on the ADHD-200 dataset.
2. METHODS
2.1. Data and preprocessing
The resting state fMRI data used in this work is provided by the ADHD-200 consortium [8]. The dataset is acquired by different imaging sites and is comprised of resting state fMRI data, MRI data, as well as phenotypic information. The con-sortium has provided a training dataset, and an independent testing dataset separately for each individual imaging site. In this work, we have used resting state fMRI data from three sites: NeuroImage (NI), New York University Medical Cen-ter (NYU) and Peking University (Peking). All imaging sites in the consortium have a different number of subjects. Ad-ditionally, imaging sites have different scan parameters and equipment, which makes the dataset complex and diverse for building any machine learning model. This data has been pre-processed as part of the connectome project1. The
preprocess-ing involved different steps where the brain is segmented into
90regions using the automated anatomical labeling (AAL)
atlas [9]. A more detailed description of the data and prepro-cessing steps appears on the connectome website. Each seg-mented region is represented by a time-series signal that cap-tures the level of blood oxygenation (BOLD signal). These
90time series signals are the input to DeepFRMI.
2.2. End-to-end model
In this paper, we propose an end-to-end deep learning model for classification of ADHD that takes fMRI signals as input
and predicts a label (1 for ADHD subject and0 for healthy
control) as output. The proposed work is motivated by a re-cently published method called FCNet [7]. FCNet is used to extract functional connectivity from fMRI time-series sig-nals, but it suffers from the following drawbacks: i) it is not an end-to-end model, and ii) it relies on classical machine learn-ing methods like feature selection uslearn-ing elastic net and a sup-port vector machine for classification. Our DeepFMRI model architecture can be divided into three modules: i) feature ex-tractor, ii) similarity measure, and iii) classification network. DeepFMRI employs multiple FCNets (with shared parame-ters) for calculating functional connectivity for any pair of
1www.preprocessed-connectomes-project.org/adhd200/ . . . . . .
. Ma
p p in g l a y e r P r ed ic ti on R1 R2 R90 C on v 1 P ool B a tc h N or m L -R e L U C
onv 2 Pool
B a tc h N or m L -R e L U C onv 3 B a tc h N or m L -R e L U C
onv 4 Con
v 5 P ool F ul ly c onne c te d F ul ly c onne c te d F ul ly c onne c te d F ul ly c onne c te d B a tc h N or m R89 . . R3 a) Feature extractor network b) Similarity measure network c) Classification network
d) Feature extractor network e) Similarity measure network F ul ly c onne c te d (f) S of tm ax Network 4005 Network 4004 Network 02 Network 01 Network 01 Network 02 Network 03 Network 89 Network 90 F ul ly con ne c te d F ul ly c onne c te d + s of tm ax
Fig. 1. The architecture of the proposed end-to-end model. a)
represents a set of90feature extractor networks where each
network is applied to each individual regionR. All networks
share same parameter set. b) represents a set of4005
simi-larity measure networks. Each network’s input contains ab-stracted features of two brain regions. All networks share the same parameter set. c) is the classification network compris-ing of fully connected layers and a softmax layer. d) repre-sents the details of layers in feature extractor network. Sim-ilarly, e) represents layer architecture of similarity measure network, and f) represents the detail of layers of the individ-ual block in the classification network (the two blocks in the classification network do not share parameters).
brain regions. The FCNets are fine-tuned and combined with a classification network to provide a fully end-to-end model that can be trained using back-propagation. We describe the details of each individual network below.
2.2.1. The feature extractor
This convolutional neural network extracts features from
in-dividualbrain region time-series signals and is comprised of multiple layers that are common in CNN models to learn ab-stract representations of the individual time-series signal. The network is designed to accept time-series signals of length
172 and is comprised of multiple layers (presented in Fig.
1c). For all convolutional layers, a kernel size of3 is used
and the number of filters are32, 64, 96, 64, 64 for layers Conv1,Conv2,Conv3, Conv4,Conv5, respectively. All pooling layers pool temporally with pool length of2. The last
fully connected layer in the network has32nodes.
2.2.2. The similarity measure network
[image:3.612.330.544.76.215.2]the last layer is connected to a softmax layer with dense con-nections. These layers are presented in Fig 1e.
Similarity measures are fed to a mapping layer with fol-lowing operation:
M(i) =w1v1i+w2vi2, (1)
wherevi
1andvi2are the outputs ofithsimilarity measure net-work,w1andw2are the weights such thatw1+w2= 1, here we usew1= 1andw2= 0. Instead of initializing weights of the feature extractor network and similarity measure network randomly, we use weights of a pre-trained FCNet [7].
2.2.3. Classification network
This neural network produces the final classification results. The input to this network is the output of the mapping layer
features (M) representing functional connectivity. The
net-work is comprised of multiple layers where the last layer is connected to a softmax classifier with fully connected layers. The network produces the final prediction. Next, we describe architectural considerations and training of DeepFMRI.
2.2.4. Shared parameters architecture
The architecture of the feature extractor network and simi-larity measure network is the same as FCNet. However, the FCNet architecture cannot be applied directly to construct an end-to-end network as it is designed to work on only two brain regions. In DeepFMRI, the same feature extraction steps are applied to individual brain regions, and all pairs of brain re-gions are passed through the same similarity measure net-work. This is realized by employingnffeature extractor
net-works andnssimilarity measure networks. Each feature
ex-tractor network is applied to an individual brain region (nf =
90), converting individual time-series data into an abstract
representation. All the feature extractor networks share the same parameters and updates are applied to these shared pa-rameters during training. The similarity measure network is applied to all combinations of pairs of brain regions, so ns= 4005 (nf×(nf−1)/2). All the similarity measure net-works are implemented with the constraint that the netnet-works share the same parameters and updates are applied to these shared parameters. The approach is similar to a Siamese net-work [10], however, typically Siamese netnet-works are designed to work on image pairs.
3. EXPERIMENTS AND RESULTS
[image:4.612.318.552.107.175.2]The proposed DeepFMRI model is evaluated on the ADHD-200 dataset. The dataset was contributed by different imaging sites. Each imaging site provided separate training and test-ing dataset. For evaluation of our method on individual site, we train our end-to-end model on the training dataset of each imaging site and test on the corresponding test dataset of that individual site. There are four categories of subjects
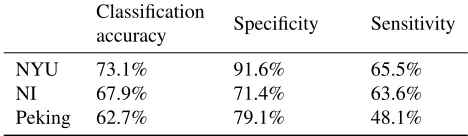
Table 1. Results from the proposed end-to-end network showing classification accuracy, specificity and sensitivity.
Classification
accuracy Specificity Sensitivity
NYU 73.1% 91.6% 65.5%
NI 67.9% 71.4% 63.6%
Peking 62.7% 79.1% 48.1%
in the dataset: healthy control, ADHD combined, ADHD
hyperactive-impulsive and ADHD inattentive. Here, we
combine all ADHD types in one category to investigate clas-sification between healthy control and ADHD.
The network is trained end-to-end. For initialization of the feature extractor and similarity measure networks, we use weights from a pretrained FCNet in our work [7], and these
weights are updated through fine-tuning. The end-to-end
model is trained with the following loss:
L=−1
n n X
1
[yilog( ˆyi) + (1−yi)log(1−yˆi)], (2)
wherenis the number of training samples,yiis the ground
truth label of subject (1for ADHD subject and0for healthy
control) andyˆiis the prediction by the proposed network. As the feature extraction and similarity measure networks are initialized with a pre-trained FCNet, we employ different learning rates for i) feature extraction and similarity measure networks (10−5), and ii) the classification network (10−4). We evaluate DeepFMRI with data from three imaging sites (NYU, NI and Peking). The number of training subjects in
each sites are 226,48 and85 respectively. The results are
presented in Table 1. The results show that NYU yields the best result. Table 2 compares our results with the state-of-the-art. The results show that our method outperforms the average accuracy results of competition teams (data from the competition website), highest accuracy for any individual site (from [11]), correlation-based functional connectivity results and clustering based results. Our method also performs well in comparison with the state-of-the-art FCNet method [7]. For correlation results, functional connectivity is calculated through correlation, followed by the elastic net as feature se-lection and an SVM as the classifier.
Finally, in order to study the differences between the healthy control group and the ADHD group, we visualize their respective functional connectivity difference patterns using the NYU dataset and present the results in Fig. 2. The results show that in ADHD, the frontal lobe functional connectivity is altered the most in ADHD in this dataset.
4. CONCLUSIONS
(L) Hippo (R) Hippo (L) Pa.G (R) Pa.G (L) Amygdala(R) Amygdala
(L) S.T .P (R) S.T .P (L) M.T .P (R) M.T .P (L) O.C (R) O.C (L) C.N (R) C.N (L) Putamen (R) Putamen (L) G.P (R) G.P (L) Thalamus (R) Thalamus (L) C.S (R) C.S (L) Cu (R) Cu (L) L.G (R) L.G (L) S.O (R) S.O (L) M.O (R) M.O (L) I.O (R) I.O (L) F .G (R) F .G (L) S.F .G-Dl (R) S.F .G-Dl (L) S.F .G-O (R) S.F .G-O (L) M.F .G-L (R) M.F .G-L (L) M.F .G-O (R) M.F .G-O (L) I.F .G-Or (R) I.F .G-Or (L) T ri (R) T ri (L) I.F .G-O (R) I.F .G-O (L) S.F .G-Me (R) S.F .G-Me (L) S.F .G-MeO (R) S.F .G-MeO (L) G.R (R) G.R (L) A.C.G (R) A.C.G (L) R.O (R) R.O (L) Insula (R) Insula (L) T .T.G (R) T .T.G (L) S.T .G (R) S.T .G (L) M.T .G (R) M.T.G (L) I.T.G (R) I.T.G P.G(L) P.G(R) (L) S.M.A (R) S.M.A (L) M.C (R) M.C (L) P .C.G (R) P
.C.G (L) Po.G (R) Po.G (L) S.P .L (R) S.P .L (L) I.P .L (R) I.P .L
(L) Sl.G (R) Sl.G (L) A.G (R) A.G (L) Pr
ecuneus
(R) Pr ecuneus
(L) Pa.L (R) Pa.L
Medial Te mporal Subc ortica l O cc ip ita l Fro nta l Te m po ra l Parie tal (p
re) m otor
[image:5.612.75.291.71.295.2]Fig. 2. Visualization of connectivity difference between healthy control and ADHD group for NYU dataset. For the sake of the clarity, only the top 200 connections (based on the connectivity strength) are presented.
Table 2. Comparison of the proposed DeepFRMI method with the average results of competition teams, the highest accuracy achieved for the individual site, correlation based functional connectivity method, clustering based results [1] and state-of-the-art FCNet method [7]. The highest accuracy for NI was not quoted by [11].
NI Peking NYU
Average accuracy [8] 56.9% 51.0% 35.1%
Highest accuracy [11] – 58% 56%
Clustering method [1] 44% 58.8% 24.3%
Correlation 52.0% 52.9% 56.1%
FCNet [7] 60.0% 62.7% 58.5%
DeepFMRI 67.9% 62.7% 73.1%
classification of ADHD from fMRI data. The proposed model takes raw time-series signals of fMRI as input and learns to predict the classification label directly from the raw input values. We were interested to see if the classification task in fMRI can be solved by an end-to-end network. Accord-ing to our literature study, it is the first attempt to apply an end-to-end network for classification of a neurological disor-der. The proposed end-to-end network contains several layers common in deep learning literature. Experimental results on the ADHD-200 dataset demonstrate that utilizing such model outperforms the current state-of-the-art.
5. REFERENCES
[1] Atif Riaz, Eduardo Alonso, and Greg Slabaugh, “Phe-notypic Integrated Framework for Classification of
ADHD using fMRI,” inInternational Conference Image
Analysis and Recognition. Springer, 2016, pp. 217–225.
[2] Soumyabrata Dey, A Ravishankar Rao, and Mubarak Shah, “Attributed graph distance measure for automatic detection of attention deficit hyperactive disordered sub-jects,”Frontiers in Neural Circuits, vol. 8, 2014.
[3] Junghoe Kim, Vince D Calhoun, Eunsoo Shim, and
Jong-Hwan Lee, “Deep neural network with weight
sparsity control and pre-training extracts hierarchical features and enhances classification performance: Evi-dence from whole-brain resting-state functional connec-tivity patterns of schizophrenia,” NeuroImage, vol. 124, pp. 127–146, 2016.
[4] Valerie A Harpin, “The effect of adhd on the life of an individual, their family, and community from preschool to adult life,” Archives of disease in childhood, vol. 90, no. suppl 1, pp. i2–i7, 2005.
[5] Joel T Nigg, “Attention-deficit/hyperactivity disorder
and adverse health outcomes,” Clinical psychology
re-view, vol. 33, no. 2, pp. 215–228, 2013.
[6] Yann LeCun, Yoshua Bengio, and Geoffrey Hinton,
“Deep learning,” Nature, vol. 521, no. 7553, pp. 436–
444, 2015.
[7] Atif Riaz and et al., “FCNet: A Convolutional Neural Network for Calculating Functional Connectivity from
functional MRI,” in International Workshop on
Con-nectomics in Neuroimaging. Springer, 2017, pp. 70–78.
[8] ADHD-200, ,” http://fcon_1000.projects.
nitrc.org/indi/adhd200/.
[9] Tzourio-Mazoyer and et al., “Automated anatomical
labeling of activations in SPM using a macroscopic anatomical parcellation of the MNI MRI single-subject brain,” NeuroImage, vol. 15, no. 1, pp. 273–289, 2002.
[10] Jane Bromley, Isabelle Guyon, Yann LeCun, Eduard S¨ackinger, and Roopak Shah, “Signature Verification
using a “Siamese” Time Delay Neural Network,” in
Ad-vances in Neural Information Processing Systems, 1994, pp. 737–744.
[11] Marta Nu˜nez-Garcia, Sonja Simpraga, Maria Ange-les Jurado, Maite Garolera, Roser Pueyo, and Laura Igual, “FADR: Functional-Anatomical Discriminative
Regions for Rest fMRI Characterization,” in
[image:5.612.56.301.461.555.2]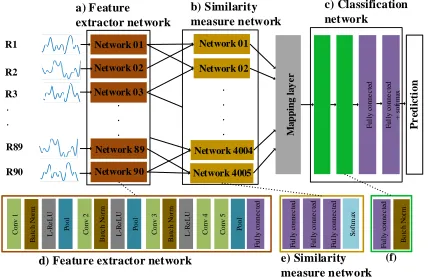
![Table 2. Comparison of the proposed DeepFRMI methodwith the average results of competition teams, the highestaccuracy achieved for the individual site, correlation basedfunctional connectivity method, clustering based results [1]and state-of-the-art FCNet](https://thumb-us.123doks.com/thumbv2/123dok_us/1388361.91985/5.612.75.291.71.295/comparison-methodwith-competition-highestaccuracy-correlation-basedfunctional-connectivity-clustering.webp)
