Erik Salo, University of Starthclyde Dr David McMillan, University of Starthclyde Prof Richard Connor, University of Stirling
Manuscript for SPE Offshore Europe 2019, 3-6 September 2019, Aberdeen, UK
Abstract
Free text and hand-written reports are losing ground to digitization fast, however many hours of effort are still lost across the industry to the manual creation and analysis of these data types. Work orders in particular contain valuable information from failure rates to asset health, but at the same time present operators with such analytical difficulties and lack of structure that many are missing out on the value completely. This research challenges the current mainstream practice of manual work order analysis by presenting a methodology fit for today’s context of efficiency and digitization.
A prototype text mining software for work order analysis was developed and tested in a user-oriented approach in cooperation with industrial partners. The final prototype combines classical machine learning methods, such as hierarchical clustering, with the operator’s expert knowledge obtained via an active learning approach. A novel distance metric in this context was adapted from information-theoretical research to improve clustering performance.
Using the prototype tool in a case study with real work order data, analytical effort for certain datasets was reduced by 90% - from two working weeks to a day. In addition, the active learning framework resulted in an approach that end users described as “practical” and “intuitive” during testing. An in-depth review was also conducted regarding the uncertainty of the results – a key factor for implementation in a decision-making context.
The outcomes of this work showcase the potential of machine learning to drive the digitization of not only new installations, but also older assets, where as a result the large amount of unstructured historical data becomes an advantage rather than a hindrance. User testing results encourage a wider uptake of machine learning solutions in the industry, and particularly a shift towards more accessible in-house analytical capabilities.
Introduction
Operations and maintenance (O&M) costs can make up a significant proportion of the total lifetime costs of an asset, for example up to 35% in offshore wind (Artigao et al., 2018). Since the 1970s, in an effort to reduce these costs, maintenance processes have come through various stages of digitalization which have increased in scope and complexity with the increase in computational power and evolution of data processing methods (Kans, 2009). Newer assets are being set up with state-of-the-art data collection and analysis already embedded in their design and operation. At the same time, there remain thousands of legacy assets in wind but also many other offshore industries where the level of data processing comes from a previous era of digitization. Operators of such assets often use only part of their data; much of it is collected to follow procedure, but never exploited for value.
timestamps, asset and part codes, technician IDs and one or two free text fields (shorttext, i.e. task title, and less commonly a separate longer description). This paper focuses on the shorttext fields which hold the operator’s unique insights not available in any other records and present these in the most concise and consistent form available.
The value of work order texts is in the information they provide about both regular an irregular tasks, including the ones often missed by other records. For example, a generator replacement causing days to weeks of downtime and costing £300K is usually well known to the operator and prominent in the O&M budget. On the opposite extreme, a fuse replacement costs little in terms of parts, however it still requires a visit to the asset involving the relevant safety procedures and access constraints as well as lost production. In between the two extremes are a wide array of small but frequent tasks that are not prominent individually, but in their tens or hundreds make up a significant O&M expenditure. Combined with cost and labour time information, work orders can provide unique site-specific insights into failure rates, O&M cost and effort distribution.
One of the major barriers to a wider exploitation of textual data is its fundamental difference from other data types: the industry is used to analyzing data in a numerical (vector) space. For example, most assets are equipped with condition monitoring or SCADA systems. A straightforward calculation based on a few operating parameters can provide average parameter values and so define an expected asset behavior in given conditions. Points that are “further” from the average are less likely to represent that expected behavior, up to the point where we are able to identify anomalous behavior or a different operating mode. Points that appear in a dense cluster with many other similar ones provide more confidence in their meaning (be it normal or anomalous behavior) than points positioned between clusters. These qualities of a vector space provide useful tools to quantify asset behavior and importantly also the uncertainty related to it. However, in case of a set of maintenance task descriptions written by technicians in free text, what is the “average sentence” or how “far” is one description from others? How do we obtain the same quantitative insight from text as we do from numerical data? This study addresses these questions in order to extract actionable information such as failure rates from a work order database.
Data quality issues and lack of standardization add further complications. Human inputs introduce stochastic variations such as transcription errors as well as differences in terminology, abbreviations and acronyms used across sites (Hodkiewicz and Ho, 2016). The operator often lacks a component and failure taxonomy for each individual asset type, which prevents them from both analyzing existing data as well as collecting properly classified data in the first place (Carroll et al., 2016; Königstein et al., 2007; MacLean, 2017). The complexity results in prolonged analysis times ranging from 2 weeks to a month per dataset, which an operator often cannot afford (MacLean, 2017; Onyx Insight, 2018), causing many to miss out on the value of the data completely.
We have previously shown the significant potential of text mining methods to address the above issues: to streamline work order analysis, improve operators’ access to data and provide added O&M insights. Our proof-of-concept demonstrated a time saving of nearly 90% while quantifying the small but frequent tasks that are otherwise difficult to track (Salo, 2017; Salo et al., 2018). Although our research originates in the wind energy industry where this problem has recently been highlighted by operators (MacLean, 2017), similar needs to improve access to textual data have been discussed in other sectors such as mining and drilling operations in oil & gas (Antoniak et al., 2016; Castiñeira et al., 2018; Hodkiewicz and Ho, 2016; Kowalchuk, 2019; OMDEC, 2008). Further, there are no inherent limitations or barriers between different asset types that would prevent the universal application of text mining methods across all industries which use similar data.
3) the analysis was made accessible for the operator by means of a GUI and its usability validated based on end user feedback.
Methodology
The aim of the prototype developed here was to convert work order shorttexts into outputs that are actionable in two ways: from an overview perspective and from a per-task perspective. The first (overview) aim was to generate a Pareto chart, from which the operator can derive failure rates of each component and accordingly the spare parts and labour time used for repairs. To do so it was necessary to determine which tasks (described in a large number of different ways) in the history of a site had the same effective meaning. All meaningfully equivalent expressions could be grouped together and considered as different occurrences of the same procedure and, importantly, counted. The counts of all different categories made up a Pareto chart. The second (per-task) aim was to elicit a standard task nomenclature and so improve the quality of existing data as well as future task assignments. As each Pareto category is described by a single representative label, all tasks within a category could be mapped to that standard label and so the nomenclature across the entire dataset could be standardised. The ability to compare raw data and the assigned labels side-by-side was also considered a prerequisite for the transparency and verifiability of results.
The underlying text mining methodology was based on our previous proof-of-concept (Salo et al., 2018). Though originally developed with partners in the wind energy sector, we aimed to create a technology- and platform-agnostic prototype that can analyze any set of work orders which contains a shorttext field. This robustness was validated at each stage of development by testing the process with a range of available data sources, originating from network assets to wind turbines and other types of generators. To ensure wide compatibility, the prototype took inputs in the .xls or .xlsx table format which all major CMMS platforms can export data to. Ouputs were also given in .xls.
Pre-processing.
The first step in of the methodology was data cleaning and pre-processing, which used the same principles as in previous work. Records with empty shorttext fields were discarded from analysis. For data cleaning, punctuation was removed except for slashes which are sometimes used in abbreviations; numbers and single letters were removed, unless part of known component ID formats such as (e.g. “107k”) or maintenance intervals (“3-monthly”); multiple whitespaces were removed; all text was converted to lower case. Next, stopwords were removed – that includes all words which the user had specified as uninformative, too common, or otherwise excessive.
To prepare for following steps, the texts were then tokenized (Miner, 2012). Each unique text (known in text mining literature as “document”) was separated at whitespaces into individual words or “tokens”. All unique tokens were gathered in a dictionary. If at this point or during following steps a term was found to have synonyms, different spellings or abbreviations, then all these were grouped together in the dictionary to form a semantic “concept” and all terms within a concept were represented by the most accurate one. Each concept was assigned a unique numerical index. All tokens in the documents were then mapped to the corresponding concepts. Each document could so be represented in the text form as a sequence of concepts, or in the numerical form as a sequence of indices. The sequence of numerical values forms a document vector, an important concept in text mining that enables various calculations that a plain text representation does not.
Clustering.
clustering and classification (Aggarwal and Zhai, 2012; Feldman and Sanger, 2006). Classification algorithms learn to map input data to desired outputs based on a predefined set of training data and aim to replicate that mapping on new data that may be incomplete. However, they do not work well with inputs not represented in the training data. Clustering, on the other hand, is an exploratory process that attempts to find inherent structure or relationships in data without prior example. As the aim of this work was to develop a robust and adaptable solution which could be applied to new and unknown datasets, clustering was the appropriate choice.
Clustering is a machine learning process that aims to group together data points – in this case terms or texts – that are similar, and separate those that are different. The perfect clustering result would be a dataset where each cluster contains all true matches, without any misses (false negatives) or including any false positives. Common clustering algorithms like k-means operate in a vector space (coordinate system), where each data point has a position determined by its coordinates. Clusters can be imagined as denser “swarms” of similar points in a space, which the algorithm attempts to define by drawing cluster boundaries. However, texts and especially words cannot be naturally mapped in a space like this as they do not have absolute coordinates. Traditionally, the calculation of differences between text strings has been relative and restricted to pairwise comparisons. Though methods such as the k-means can be adjusted for text clustering (Aggarwal and Zhai, 2012), the issue remains that these methods require a predefined number of clusters. One solution that can both handle text data and does not require the number of clusters as an input is agglomerative hierarchical clustering. It is a robust algorithm and often used for its exploratory capabilities (Aggarwal and Zhai, 2012), and was therefore the choice for this work. This process begins with each point in a separate cluster, compares the clusters according to a distance metric and continues to merge the most similar pairs of observations until all observations are in a single large cluster. That large cluster is then cut into smaller “true” clusters according to a threshold value – the highest allowed distance value at which two objects can still be considered similar. This value is specified by the user. The clusters are still formed according to distance, similar points together and different ones apart, only the clusters are bounded according to pairwise distance and not absolute position in a space.
Various metrics are used to calculate the distances between pairs of observations for clustering. On a character level, the Levenshtein distance has been widely used to evaluate the similarity of two strings by counting the minimal number of edits (character additions, deletions, replacements) required to change one string to the other. On a document level, to cluster a set of text vectors, the Euclidean and Jaccard distances have been widely used (Banchs, 2013). We introduce the Connor metric (SED) (Connor et al., 2011) for use in both term and document clustering, which to our knowledge is a novel application in the maintenance domain.
(Feldman and Sanger, 2006). Ongoing testing results were therefore used as a foundation for a further literature review on uncertainty in operational analysis. Sensitivity, specificity and ROC curves were considered as possible measures of uncertainty in this context, while ways to elicit this information from active learning inputs were explored.
Active learning.
The clustering steps described above were cases of unsupervised learning, where the user specifies certain parameters but the process runs without further interaction. Semi-supervised clustering is an approach that uses a small amount of training data to enhance the learning process of an otherwise independent clustering algorithm (Basu et al., 2004). A further improvement is active learning – an iterative process where the most uncertain data points at each clustering step are presented to the user, assuming the human decision-maker will always provide the correct solution based on which the algorithm can learn. Correct selection of queries can reduce both the required amount of input to reach a satisfactory result and the overall number of data points needed to define the entire set of cluster memberships (Eriksson et al., 2011; Nogueira et al., 2012; Wagstaff and Cardie, 2000; Xiong et al., 2017).
Most active learning approaches, such as in (Nogueira et al., 2012), rely on intrinsic measures to prioritise queries to the user. The distance metrics used to select queries are susceptible to inaccuracy if a wide variety of abbreviations and spelling mistakes are present in the dataset, which was known to be an issue. Therefore to develop a more robust solution, the prototype was designed such that the operator could iterate manually between verification and clustering as appropriate.
Important observations were made when reviewing the clusters after each unsupervised stage that allowed an approximation of uncertainty to emulate the query selection process. The clusterer was effective at grouping together very similar observations and separating very different ones, but marginal cases appeared regularly as false positives in incorrect clusters. Therefore as expected, marginal cases carried the highest uncertainty and were a verification priority (Nogueira et al., 2012). These presented difficulties for the clusterer, but during verification were easiest for the user to identify. By tagging false positives, the user was effectively able to prioritise queries and carry out verification in a single step. Although the result was not an automated process, it was nevertheless a semi-supervised approach that can be viewed as a modification of active clustering with user-selected queries.
The user’s feedback was used to adjust clustering results in the form of pairwise constraints: must-links (those elements that mean the same thing and must belong in the same cluster) and cannot-links (those which are different). The affinity matrix approach was adopted from (Xiong et al., 2017), although constraint values were altered to represent the range of distance metric values relevant to this study: 0 for a must-link and 1 for a cannot-link constraint.
Case study.
Data from a major onshore wind farm in Scotland was used as a case study to illustrate the work order analysis process. This specific dataset was chosen based on the availability of an existing benchmark – a previous fully manual attempt to standardize and quantify the free text information in the form of a Pareto chart, which took the operator two weeks (10 working days) (MacLean, 2017). The dataset covered approximately 4 years of wind farm operation and included around 3400 work orders. Only work order shorttexts were extracted within scope of this case study. It is likely that a more insightful analysis could be achieved in a “data fusion” approach by leveraging other information in the dataset such as timestamps, part codes (Arif-uz-zaman et al., 2016), however that was assumed to be a separate capability an operator would develop.
were grouped together on the subsystem level or higher. Each type of statutory inspections was kept as a separate category. Generic minor repairs like fuse changes were classified based on task, regardless for example of which exact fuse in the cabinet was changed. All services on a system level were kept as separate categories.
Results and discussion
This section presents the results of the prototype development, illustrated by examples from the case study.
Case study.
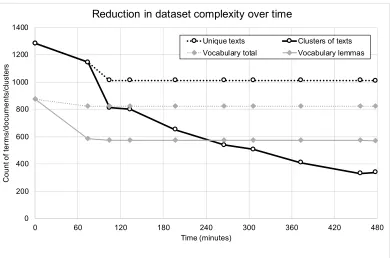
The text mining workflow using the prototype tool can roughly be divided into four usage phases as determined through practical testing. Figure I presents a significant reduction in data complexity during the process, in which the four phases are identifiable:
1. Vocabulary processing - first 74 minutes. Stopwords were identified and removed and the data
was cleaned. The user identified 50 unique stopwords, the majority of which were asset IDs and prepositions. The optimal distance metric, threshold and linkage for hierarchical clustering were determined empirically, in an iterative manner. The Connor metric was chosen with a distance threshold of 0.44, using complete linkage. The effort was distributed roughly equally between parameter selection and manual adjustment of results, hence the presentation as a single parcel of work in the figure.
2. Parameter estimation for text clustering – 31 minutes (74 to 105). Clustering parameters for the
full text clustering were chosen iteratively as above. The final settings were Jaccard metric with complete linkage and a threshold of 0.2. The clustering step achieved the single most significant reduction in dataset complexity, although with frequent false positives found in clusters. During this phase, the user identified two more stop words and several cases where dictionary clusters needed to be merged, resulting in a slight reduction in dictionary size.
3. Manual adjustment and verification – 5h 52min (105 to 456). The large amount of data, combined with a relatively large number of false positives from clustering, caused a slight lag in the user’s processing speed at the beginning of this stage. However, with the given verification strategy as explained below, it is more convenient to detect false positives than look for false negatives. Therefore, the initial lag was followed by a consistent decrease in dataset complexity.
4. Selection of cluster descriptions - 22 minutes (456 to 478). For all clusters with more than one
Figure I. The reduction of dataset complexity during analysis, presented as a reduction in the number of different terms and texts. Dotted lines show the baseline reduction from data cleaning and stopword removal (in case of text clusters, the effect of vocabulary treatment is also included). Solid lines show the total effect of automated and manual processing on each parameter.
The direct value of the process is in the time saving. The analysis in Figure I lasted 8 hours (one working day). Compared to the manual benchmark, the combination of machine learning methods and active learning enabled a 90% reduction in operator’s time. This is also a 6% improvement over our previous work in which the same dataset took 8.5 hours to analyze (Salo et al., 2018). In terms of algorithm performance, the clustering processes each lasted on the order of seconds on a modest 1.5 GHz Intel i5 machine with 4 GB RAM. When tested with mixed data during development (results not shown), a clustering step lasted up to 4 minutes for a diverse set of 12000 records when a large amount of active learning inputs was present. Therefore at least for shorttexts, computation time is insignificant compared to human input. Since most single-site datasets contain under 20000 records, we do not expect any scalability issues due to computational power limitations.
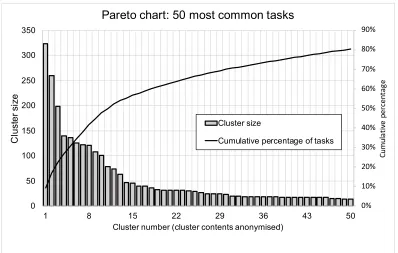
As a result of the analysis, the original maintenance information was summarized in 338 unique descriptions (clusters) instead of the original 1283 and in 571 dictionary concepts (word clusters) instead of 876. Of these two indicators, the reduction in work order clusters was both greater and more important for the operator, as this effectively determines the extent of data standardization. A Pareto chart showing the distribution of work orders according to the standardized nomenclature is presented in Figure II. Cluster contents remain anonymized due to confidentiality reasons. However, it can be said that the categories shown contain three main types of tasks (in the order of prominence): services and inspections; diagnostic work; minor corrective maintenance. The latter are particularly important to meet the research aim - to help the operator to quantify the small but frequent tasks that are otherwise difficult to track. As each column in the Pareto chart contains all similar tasks carried out on one type of equipment, the failure rate and spare parts consumption of that type of equipment can be determined from it. Major replacements were also present in the less frequent clusters.
0 200 400 600 800 1000 1200 1400
0 60 120 180 240 300 360 420 480
C
o
u
n
t o
f
te
rm
s/
d
o
cu
m
e
n
ts/
cl
u
st
e
rs
Time (minutes)
Reduction in dataset complexity over time
Unique texts Clusters of texts
Figure II. Anonymized Pareto chart of the findings (top 50 categories presented of 339 total).
Active learning.
The first active learning solution was a simple yes/no interface used to verify single pairs of terms or texts in a sequence. Using a simple yes/no interface, a person was found capable of a continuous verification rate of around 1000 pairs of words per hour (less in case of long sentences). This style of verification was effortless to use, however, it presented scalability issues. The number of pairwise comparisons in a dataset is given by equation (1), where N is the number of pairwise comparisons and n is the number of observations in the dataset.
(1) N = n*(n-1)/2
For the case study dataset of 876 terms, 383000 comparisons would be required for full verification of the vocabulary. At the same time, positive matches were sparse in the dataset, only 630 of all pairs or a prevalence of 0.16%. Therefore a sampling approach was not effective at any sufficiently low sampling rate. In either case, the required number of verifications exceeded practical time limits.
The pairwise yes/no interface was then replaced with a graphical interface that presented the entire set of terms or documents as a list, with a parallel view of individual elements in a cluster. This allowed whole clusters, as well as individual elements, to be selected together for verification. Upon a merging or separation decision by the user, the collected verification data was extended from a single pair of elements to all combinations of pairs among selected instances. This setup had two advantages. Firstly, simultaneous verification of multiple pairs increased the amount of usable verification data created. Secondly, the user was able to focus the verification effort on specific regions of a dataset where the likelihood of true matches was considered higher (mostly empirically or alphabetically).
This revised interface was described as “intuitive” and “practical” after 2 hours of training by operators who participated in the case study. The ability to save both user inputs and results was considered an advantage that can provide further time saving on repeated analysis. Some results saved for one dataset can be applied to others with minimal changes. For example, a dictionary arranged for a specific taxonomy or company jargon can be applied on different datasets within the same company.
As Figure I demonstrates, the majority of user input still went into verifying the document clustering results. This indicates a scope for further research into effective use of human input, possibly by active
0% 10% 20% 30% 40% 50% 60% 70% 80% 90% 0 50 100 150 200 250 300 350
1 8 15 22 29 36 43 50
Cu m ul at iv e pe rc en ta ge C lu st e r si ze
Cluster number (cluster contents anonymised) Pareto chart: 50 most common tasks
Cluster size
query selection for highest uncertainty reduction (Xiong et al., 2017) or expected improvement in confidence (Nogueira et al., 2012). There is potential to extend the effects of learning from observed data (verified recurring pairs) to unobserved data, for which a review is provided in (Gopal and Yang, 2014).
Uncertainty.
While the above results demonstrate a significant standardisation in the dataset, it is important to distinguish that a higher dimensionality reduction does not guarantee a higher quality result. An equal degree of reduction can be achieved by clustering data either correctly or incorrectly. From an operator’s point of view, two important forms of uncertainty were identified during data analysis: that of the size of each Pareto category, and that of a given document truly belonging into the cluster to which it was assigned.
The hierarchical clustering algorithm offers no guarantee or indication of correctness (Feldman and Sanger, 2006) and there is no direct way to calculate the uncertainty based on existing clustering results (Xiong et al., 2017). Of indirect methods, bootstrapping can be used evaluate the uncertainty in hierarchical clustering (Suzuki and Shimodaira, 2004). However, as a highly iterative process it is computationally expensive and was considered unsuitable for use in active learning where repeated calculation of uncertainty is required in most approaches. It is therefore a more suitable solution for an operator to evaluate the uncertainty in the final results. A cluster validation based on the silhouette measure is proposed in (Liu and Graham, 2018), but the authors also highlight a principal weakness of such intrinsic measures: they depend on the quality of the distance matrix and the underlying distance metric, which again cannot be guaranteed. Therefore some manual verification is inevitable.
The receiver operating characteristic (ROC) curve is a practical way to visualize uncertainty information. (Fawcett, 2006). A ROC curve describes a distance metric across a range of threshold values in terms of sensitivity (the proportion of true positives detected and placed in clusters by a metric at a given threshold) and specificity (the proportion of true negatives detected). These parameters can be used to evaluate the expected clustering quality and choose an optimal clustering threshold (Connor et al., 2015; Connor and Cardillo, 2016). The curve can be constructed based on data gathered during clustering verification as in (Fawcett, 2006), assuming that a uniform sample across the dataset can be provided. However, this assumption could not be verified in the present work, where the type of verification depended on user preference and consequently there was a risk of verification bias as discussed in (Fluss et al., 2009).
With the chosen method of verification, false positives (i.e. those members which the algorithms had placed in a cluster incorrectly) were relatively easy for the user to detect in a cluster, normally having to compare 2-12 entries at a time in order to remove the incorrect ones. False negatives (i.e. true matches missed by the algorithms) were more difficult to detect, as to do so the user needed to compare a cluster to all the rest, resulting in several hundred comparisons and making them more likely to miss some. Therefore, false negatives were more likely to occur than false positives. A total of 164 documents (4.8%) were left in single clusters, mainly unique tasks or those described in insufficient detail. Due to possible verification errors, some of these could be false negatives, and so the given categories could be marginally larger than shown. However, the expected increase would not exceed 1-2 instances per cluster, as more would have been readily detected during verification. In spite of a lack of validated measure of uncertainty, the accuracy of failure rates calculated from this analysis was therefore considered reasonable for practical use, assuming the operator verifies the results ad-hoc.
Conclusion
Furthermore, the prototype received an empirical confirmation of usability from test users in the wind energy industry. We did not detect any limitations or noticeable changes in performance or accuracy with regard to asset type, which demonstrates that the methodology is widely applicable across industries where data is stored in the work order shorttext format.
References
Aggarwal, C.C., Zhai, C., 2012. Mining text data. Springer.
Antoniak, M., Dalgliesh, J., Verkruyse, M., Lo, J., Company, C.S., 2016. SPE-181015-MS Natural Language Processing Techniques on Oil and Gas Drilling Data 6–8.
Arif-uz-zaman, K., Cholette, M.E., Li, F., Ma, L., Karim, A., 2016. A Data Fusion Approach of Multiple Maintenance Data Sources for Real-World Reliability Modelling, in: Proceedings of the 10th World Congress on Engineering Asset Management (WCEAM 2015). pp. 69–77. https://doi.org/10.1007/978-3-319-27064-7
Artigao, E., Martín-Martínez, S., Honrubia-Escribano, A., Gómez-Lázaro, E., 2018. Wind turbine reliability: A comprehensive review towards effective condition monitoring development. Appl. Energy 228, 1569–1583. https://doi.org/10.1016/j.apenergy.2018.07.037 Banchs, R.E., 2013. Text Mining with MATLAB. Springer, New York. https://doi.org/10.1007/978-1-4614-4151-9
Basu, S., Bilenko, M., Mooney, R.J., 2004. A probabilistic framework for semi-supervised clustering. Proc. 2004 ACM SIGKDD Int. Conf. Knowl. Discov. data Min. - KDD ’04 59. https://doi.org/10.1145/1014052.1014062
Carroll, J., McDonald, A., McMillan, D., 2016. Failure rate, repair time and unscheduled O&M cost analysis of offshore wind turbines. Wind Energy 19, 1107–1119. https://doi.org/10.1002/we.1887
Castiñeira, D., Toronyi, R., Saleri, N., 2018. Machine Learning and Natural Language Processing for Automated Analysis of Drilling and Completion Data. https://doi.org/10.2118/192280-ms
Connor, R., Cardillo, F.A., 2016. Quantifying the Specificity of Near-Duplicate Image Classification Functions. 11th Int. Jt. Conf. Comput. Vision, Imaging Comput. Graph. Theory Appl.
Connor, R., Mackenzie-leigh, S., Cardillo, F.A., Moss, R., 2015. Identification of MIR-Flickr Near-duplicate Images A Benchmark Collection for Near-duplicate Detection, in: VISIGRAPP. pp. 565–571.
Connor, R., Simeoni, F., Iakovos, M., Moss, R., 2011. A bounded distance metric for comparing tree structure. Inf. Syst. 36, 748–764. https://doi.org/10.1016/j.is.2010.12.003
Connor, R., Vadicamo, L., Rabitti, F., 2017. High-dimensional simplexes for supermetric search. Lect. Notes Comput. Sci. (including Subser. Lect. Notes Artif. Intell. Lect. Notes Bioinformatics) 10609 LNCS, 96–109. https://doi.org/10.1007/978-3-319-68474-1_7 Eriksson, B., Dasarathy, G., Singh, A., Nowak, R., 2011. Active Clustering: Robust and Efficient Hierarchical Clustering using Adaptively
Selected Similarities. Proc. 14th Int. Conf. Artif. Intell. Stat. 15, 1–19. https://doi.org/10.1583/1545-1550(2007)14[585:DRTIVD]2.0.CO;2
Fawcett, T., 2006. An introduction to ROC analysis 27, 861–874. https://doi.org/10.1016/j.patrec.2005.10.010 Feldman, R., Sanger, J., 2006. The Text Mining Handbook. Cambridge University Press, Cambridge.
https://doi.org/10.1017/CBO9780511546914
Fluss, R., Reiser, B., Faraggi, D., Rotnitzky, A., 2009. Estimation of the ROC curve under verification bias. Biometrical J. 51, 475–490. https://doi.org/10.1002/bimj.200800128
Gopal, S., Yang, Y., 2014. Transformation-based Probabilistic Clustering with Supervision. Proc. Thirtieth Conf. Uncertain. Artif. Intell. 270–279.
Hodkiewicz, M., Ho, M.T.-W., 2016. Cleaning historical maintenance work order data for reliability analysis. J. Qual. Maint. Eng. 22, 146–163. https://doi.org/10.1108/JQME-04-2015-0013
Kans, M., 2009. The advancement of maintenance information technology: A literature review. J. Qual. Maint. Eng. 15, 5–16.
Königstein, H., Müller, H., Kaiser, J., 2007. RDS-PP – Transition from the KKS to an international standard. VGB Powertech 87, 64–72. Kowalchuk, P., 2019. Implementing a Drilling Reporting Data Mining Tool Using Natural Language Processing Sentiment Analysis
Techniques. https://doi.org/10.2118/194961-ms
Liu, D., Graham, J., 2018. Simple Measures of Individual Cluster-Membership Certainty for Hard Partitional Clustering. Am. Stat. 1–10. https://doi.org/10.1080/00031305.2018.1459315
MacLean, G., 2017. Minutes of meeting.
Miner, G., 2012. Practical text mining and statistical analysis for non-structured text data applications. Academic Press.
Nogueira, B.M., Jorge, A.M., Rezende, S.O., 2012. HCAC: Semi-supervised Hierarchical Clustering Using Confidence-Based Active Learning. Springer, Berlin, Heidelberg, pp. 139–153. https://doi.org/10.1007/978-3-642-33492-4_13
OMDEC, 2008. SAP enhancements improve coal plant maintenance practices. Power Eng. 112, 72–74.
Onyx Insight, 2018. ‘Digitisation’ of O&M data is the first step to ‘digitalisation’ of O&M - ONYX InSight [WWW Document]. URL https://onyxinsight.com/2018/09/18/digitisation-of-om-data-is-the-first-step-to-digitalisation-of-om/ (accessed 2.14.19). Salo, E., 2017. Analysis of SAP work order data by turbine technology type for onshore wind. university of Strathclyde.
Salo, E., McMillan, D., Connor, R., 2018. Value from free-text maintenance records: converting wind farm work orders into quantifiable, actionable information using text mining. Anal. Oper. Wind Farms.
Suzuki, R., Shimodaira, H., 2004. An application of multiscale bootstrap resampling to hierarchical clustering of microarray data: How accurate are these clusters. 15th Annu. Int. Conf. Genome Informatics, Posters Softw. Demonstr. 1–2.
https://doi.org/10.1126/science.1161925
Wagstaff, K., Cardie, C., 2000. Clustering with Instance-level Constraints. Proc. Seventeenth Int. Conf. Mach. Learn. 1103–1110. https://doi.org/10.1109/CCECE.1993.332311