Abstract:Abstract: This study presents a method to model population growth of spatial units by incorporating measures of road network centrality instead of conventional statistical models of population growth. The proposed model enables the estimation of population growth based on the changes in the urban form represent by the changes in the road network and their centralities. The model has been calibrated and validated for the city of Colombo, Sri Lanka. The proposed model for simulating population growth rate by utilizing Closeness Centrality values and the rate of natural population growth as endogenous variables recorded an accepted level of predictability (R2= 0.87 and MdAPE < 10%). The method demonstrated in this research is an effective tool for understanding and directing the efficient allocation of intelligent road network infrastructure, urban planning and population modeling.
Index Terms: network centrality analysis, population growth, simulation, spatial planning.
I. INTRODUCTION
Accessibility determines the relative attraction of an area which in turn determines the growth and distribution of population [1], [2]. The concept of „land-use transport feedback cycle‟explains how accessibility affects the location of activities which in turn affects the distribution and growth of population [1]. Clark‟s modelis one of the pioneer models that was developed to model population distribution and growth [2]. Clark‟s model shows the population distribution as a function of central density and distance from the center [2]. However, it fails to capture the influence of accessibility on population distribution and ignores the effects of the sub centers [1]. The major problem is that the accessibility measure used in these models rely on the identification of a single city center.Other noticeable models in the field of population modeling include the Gaussian formulation, the inverse power function introduced by Smeed in 1961and the quadratic exponential equation introduced by Latham and Yeates in 1970.
Emerging urban region in the world consists of multiple nuclear results a poly centric model of spatial form. These models have been criticized in such thatthe models fail to efficiently capturethe variation of accessibility in large urban
Revised Manuscript Received on July 20, 2019.
Amila Buddhika Jayasinghe, Department of Town and Country Planning, University of Moratuwa, Sri Lanka. [email protected]
Nima Yoezer Tenzin, Department of Town and Country Planning, University of Moratuwa, Sri Lanka. [email protected]
C. Chethika Abenayake, Department of Town and Country Planning, University of Moratuwa, Sri Lanka. [email protected]
P.K.S. Mahanama, Department of Town and Country Planning, University of Moratuwa, Sri Lanka. [email protected]
regions [10].
In such context, this study contributesto overcoming these limitations by capturing the impact of accessibility over multiple centers by utilizing the Network Centrality Assessment (NCA) in the proposed model.NCA is a new and a powerful analytical method, which has been developed based on the Graph theory to compute levels of centrality in a network [3]. Centrality has been shown to have a strong correlation with employment density [4], Building density [5][6], distribution of spatial forms [5] and trip attraction [3]. Thus, the link between centrality and population growth & distribution can be highly anticipated.
Conventional statistical methods for forecasting populationincludes the linier, exponential and logarithmic functions of population growth. Nevertheless, determining the best growth model to represent context specific spatial scenario is highly challenging. In those conventional methods, population forecast is usually reduced to a simple statistical analysis without considering the spatial aspects of population distribution [7].It also fails to efficiently capture the effect of internal migration [8]. However, there is a need to integrate other spatial variables of population distribution [9] into in these conventional models to for developing a method that can predict growth based on spatial variables. Understanding the spatial trajectory of population growth is important as their trajectory will determine the urban economic efficiency, the expenditure on new infrastructure, the transport costs and consequent urban pressures on the environment [7]. This context urges to develop an alternative model for predicting population growth. This study attempts to incorporate network centrality of an area into the conventional statistical model of population growth to derive a new population growth model based on centrality of the road network.
II. MODELFORMULATION
The total population of an area at time t+n can be expressed as;
Pt+n = Pt + (B-D) + (I-E) (1) Where,
Pt, is the population of a given region at time t
Pt+n, is the population of the same region after „n‟ numberof years
B, is the births during „n‟ numberof years
D,is the deaths during „n‟ numberof years
Simulation of Population Growth and
Distribution based on Centrality of Road
Network
I, is the Immigration„n‟ numberof years
E, is the Emigrations„n‟ numberof years
The Equation1 can also be expressed in terms of birthrate, death rate and the net migration rate.
Pt+n = Pt + Pt(BRavg-Davg)n+ Pt(NetMR)n (2) Where,
Pt, is the population of a given region at time t
Pt+n, is the population of the same region after „n‟ numberof years
BRavg, is the average birthrate for „n‟ numberof years Davg, is the average death rate for „n‟ numberof years NetMR, is the average net migration rate for „n‟ numberof
years
N, number of years
The reproduction rate(r) is the difference between birth and death rate and is also known as the growth rate.
ravg = BRavg– Davg (3)
Substituting Equation 3 into Equation 2, The Equation 4 can be derived.
Pt+n = Pt +Pt(ravg)n + Pt(NetMR)n (4)
SubtractingEquation 4 by Pt, The Equation 5 can be derived 𝑃𝑡+𝑛
𝑃𝑡 = 1 + 𝑟𝑎𝑣𝑔 𝑛 + (𝑁𝑒𝑡𝑀𝑅)𝑛 (5)
Let, 𝑁𝑒𝑡𝑀𝑅 𝑛 = 𝑀into Equation 5, The Equation 6 can be derived.
𝑃𝑡+𝑛
𝑃𝑡 = 1 + 𝑟𝑎𝑣𝑔 𝑛 + 𝑀 (6)
The net migration rate cannot be computed directly, hence,M need to be computed first.
𝑀 = 𝑃𝑡+𝑛
𝑃𝑡 − 1 − 𝑟𝑎𝑣𝑔 𝑛 (7)
If𝑃𝑡+𝑛
𝑃𝑡 > 1then there is an increased population; an
increased residential attraction, thus, it is an in-migration.
If 𝑃𝑡+𝑛
𝑃𝑡 < 1then there is a decreased population; a reduced
residential attraction, thus, it is an out-migration. Hence, If M >0, then 𝑃𝑡+𝑛
𝑃𝑡 > 1 and if M < 0, then 𝑃𝑡+𝑛
𝑃𝑡 < 1.
In this study „M‟ is hypothesized as a function of the closenesscentralization of an area. Centralization of the area measures the relative residential attraction based on the changes in centrality values (C) over a time period. Accordingly, if 𝐶𝑡+𝑛− 𝐶𝑡
𝐶𝑡 increases, then there is an
out-migration. If 𝐶𝑡 +𝑛− 𝐶𝑡
𝐶𝑡 decreases, then there is an
in-migration.Therefore, M can be said to be a function of
centralization of an area (Equation 8).
𝑀 = 𝑓 𝐶𝑡+𝑛−𝐶𝑡
𝐶𝑡
(8)
Where,𝐶𝑡 = 𝐶𝐶𝑡
𝐶𝐶𝑡 , is the Centralization values of a given
region at time t
Where, CCt, is the Closeness Centrality measure of a given region at time t
𝐶𝑡+𝑛 = 𝐶𝐶𝑡+𝑛
𝐶𝐶𝑡+𝑛, is the Centralization values of a given region
after „n‟ numberof years
Where, CCt+n, is the Closeness Centrality measure of a given region after „n‟ numberof years
Equation 9 can be derived by converting Equation 8 into a linear form.
𝑀 = 𝑎 + 𝑏 𝐶𝑡+𝑛−𝐶𝑡
𝐶𝑡 (9)
Values for a and b can be obtained by solving the equation using a linear regression modelling. Equation 10 can be derived by substitute M in the Equation 9
𝑃𝑡+𝑛
𝑃𝑡 = 1 + 𝑟𝑎𝑣𝑔 𝑛 + 𝑎 + 𝑏
𝐶𝑡+𝑛−𝐶𝑡
𝐶𝑡 (10)
III. METHOD AND MATERIALS
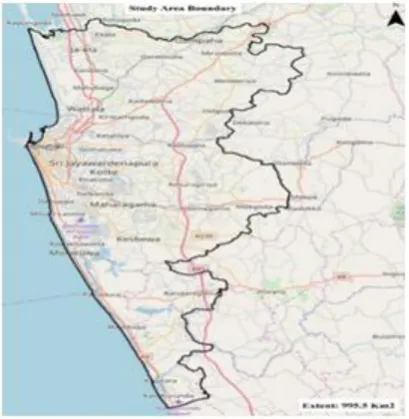
A. Study Area
[image:2.595.325.530.453.663.2]The study isconducted in Colombo Metropolitan Area, Sri Lanka (area of 995.52 Km2). The study area comprises of 433 GNDs. GNDs (Grama Niladhari Division) are the smallest administrative units in Sri Lanka.
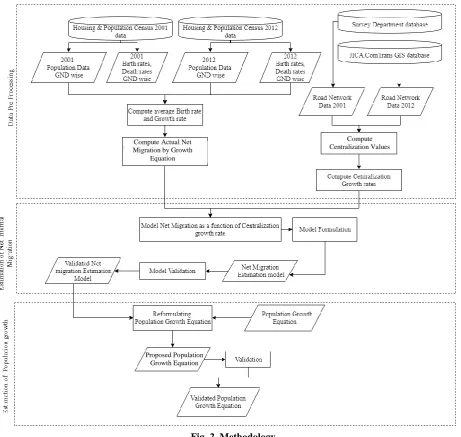
Fig. 2. Methodology
(Note: GND: Grama Niladhari Division; JICA:Japan International Cooperation Agency)
B. Data Description
The data utilized for this study are of two kinds; road network and population growth rateswhich includes the birth and death rate.
Table-I.Data Description
Data type Year Source
Road network data- polyline shapefile
2001,2012 Open Street Map(OSM) data, 2012
Population data 2001, 2012 Census and Statistics Department, Sri Lanka
C. Computing Closeness Centrality and Closeness Centralization Values by GND
Closeness centrality is“the notion of accessibility of a location [road segment] and it measures how close the location [road segment] to all others along the shortest path”[11], [12].
𝐶𝑖 = (𝑁−1)
𝑑𝑖𝑗
𝑗 ∈𝑁 ,𝑗 ≠𝑖 (11)
Where,
𝐶𝑖, is closeness centrality of road segment„i‟ N , is total number of road segments in a network 𝑑𝑖𝑗, is distance between road segment„i‟ and „j‟ along the shortest path
The study utilized the Spatial Design Network Analysis (sDNA) tool in Geography Information System (GIS) environment to compute the closeness centrality (refer figure 3). The tool computes closeness centrality when a „network graph‟ file is inserted as the input. This study prepared the network graph by employing „road-segments‟ graph method.When converting the real-world road network into the graph the graph, „road centerlines,‟ i.e., vector line data that represent the geographic center of the rights-of-way on the given road segment was
utilized.
Compute Centralization Values Compute Actual Net
Migration by Growth Equation
[image:3.595.41.288.605.685.2]The study utilized OSM road network polyline shapefile data to derive the graph. At first the OSM data was rectified by utilizing v.clean to in Grass GIS environment to reduce the topological errors.
Fig.3. Flow chart for computing closeness centrality values
D. Model Calibration and Validation
For model (i.e. Equation 10)calibration purpose, the study employed regression analysis and utilized „Forward Multiple Regression‟ analysis. The study utilized R2 and Median Absolute Percent Error (i.e., MdAPE) to test the goodness-of-fit when selecting the best model.
IV. ANALYSIS
Regression analysis indicated that the population growth can be explained by utilizing centrality parameters with more than 87% (R2 = 0.87) accuracy. The model summary is given in table IIand the goodness of fit of the population growth model is depicted infigure 3. As per the results Equation 9 can be detailed as Equation 12 more precisely.
𝑀 = 0.148 + 0.762 𝐶𝑡+𝑛−𝐶𝑡
𝐶𝑡 (12)
With the above precision the Equation 10 can be further derailed as Equation 13.
𝑃𝑡+𝑛
𝑃𝑡 = 1 + 𝑟𝑎𝑣𝑔 𝑛 + 0.148 + 0.762
𝐶𝑡+𝑛−𝐶𝑡 𝐶𝑡
(13)
Accordingly, the results revealed has proved the hypothesis that average net migration can be modeled by closeness centrality values. Hence, it can be recommended to model the future population of a given spatial unit by incorporating closeness centrality into the conventional population growth models as indicated in Equation 14.
𝑃𝑡 +𝑛= 𝑃𝑡+ 𝑃𝑡∗ 𝑟𝑎𝑣𝑔 ∗ 𝑛 + 0.148 ∗ 𝑃𝑡+ 0.762 ∗ 𝑃𝑡∗ 𝐶𝑡+𝑛−𝐶𝑡
𝐶𝑡 (14)
Table-II.Model Summary for Estimating Net Internal Migration
Specifications Co-Efficie nt values
Value T
Value
P value
Variablesa Constant -0.148 -47.569 0.000
b 0.762 0.875b 77.209 0.000
F Value 5961.241
Presence of Multicollinearity
Tolerance 1.000 VIF 1.000
Goodness of Fit
Calibrationc
R2 0.766
Adjusted R2 0.766 MdAPE 33.26% Validationd
R2 0.877
Adjusted R2 0.877
MdAPE 39.75% Note:
a Predictor Variables;
C: Centralization growth rate
b: beta values c: random 80 % of the sample (n=1823)
d: random 20% of the sample(n= 433)
Fig.4. Goodness of fit of the Population Growth Model
Table-III. Accuracy of the Population Growth Model
Goodness of Fit
R2 0.86
MdAPE 7.68%
N 2256
V. CONCLUSIONANDRECOMMENDATIONS
The key contribution of this study is a developed methodology to model population growth and distribution by substituting the net migration rate variable with the closeness centrality variable in the standard statistical model. In the conventional practice computing net migration for micro spatial units is a challenging task. Closeness centrality variable which is derived from the network centrality assessment of road network, overcomes this limitation as a directly accessible, micro level, spatial variable.
The primary case study validation of the proposed model conducted in Colombo, Sri Lanka reviled a higher degree of accuracy (MdAPE=7.68%; R2=0.87). Further validation to the proposed model piratically with reference to diverse urban regions are highly recommend.
This method can be effectively utilized to predict the changes in population based on the changes in accessibility. Further, in an urban planning application the proposed model can be used to predict the population growth rates of the envisaged centers. It can also be utilized to predict population distribution along a new road corridor. Alternatively, it canalso be utilized fordetermining the road network improvements and accessibility improvement that are necessary to achieve the target population of a given urban agglomeration.
ACKNOWLEDGMENT
Authors would like to acknowledge the Senate Research Committee (SRC) Grant, University of Moratuwa, Sri Lanka (No SRC/LT/2019/28) and SRC Conference & Publishing Support Grant for funding.
REFERENCES
1. M. Wegener, “Overview of Land-Use Transport Models,” Handbook of Transport Geography and Spatial Systems, vol. 5, 2004, pp. 127 - 146. 2. C. Clark, “Urban Population Densities,” Journal of the Royal Statistical
Society. Series A (General), vol. 114, no. 4, pp. 490-496, 1951. 3. A. Jayasinghe, K. Sano and K. Rattanaporn, “Application for developing
countries: Estimating Trip attraction in urban zones based on centrality,” Journal of Traffic and transport engineering, vol. 4, no. 5, pp. 464 -476, 2017.
4. C. D. Kang and M. Jang, “The effects of urban greenways on the geography of office sectors and employment density in Seoul, Korea,” Urban Studies, vol. 53, no. 5, pp. 1022-1041, 2015.
5. M. Batty, “Space Syntax and Spatial Interaction: Comparisons, Integrations, Applications (PhD Thesis),” University College London, London, 2017.
6. J. Peponis, D. Allen, S. French, M. Scoppa and J. Brown, “Street connectivity and urban density: spatial measures and their correlation,” in 6th International Space Syntax Symposium, Istanbul, 2007. 7. G. Song, M. Yu, S. Liu and S. Zhang, “A dynamic model for population
mapping: a methodology integrating a Monte Carlo simulation with vegetation-adjusted night-time light images,” International Journal of Remote Sensing, vol. 36, no. 15, pp. 4054-4068, 2015.
8. T. Li, “Predicting Future Spatial Distributions of Population and Employment for South East Queensland: A spatial disaggregation approach (PhD Thesis),” School of Geography, Planning and Environment Management, The University of Queensland, Brisbane, 2010.
9. B. Bajat. N. Krunić, M. Kilibarda and M. S. Petrović, “Spatial Prediction of Human Population Change,” in AGILE 2011, Utah, 2011. 10. E. Decker, A. Kerkhoff, A., & M. Moses, “Global Patterns of City Size
Distributions and Their fundamental drivers”. PLoS ONE. vol 2, no 9, p. 934, 2007
11. S. Porta, et al., “Street Centrality and the Location of Economic Activities in Barcelona,” Urban Studies, 2012. Vol 49, no 7, pp 1471-1488.
12. A. Jayasinghe, K. Sano, C.C. Abenayake, and P.K.S. Mahanama, “A novel approach to model traffic on road segments of large-scale urban road networks.” MethodsX, 2019, Vol 1, no 6, pp 1147-63.
AUTHORSPROFILE
Dr. Amila Buddhika Jayasinghe is a senior lecturer at the Department of Town & Country Planning, University of Moratuwa, Sri Lanka. His research works are focused on urban simulation, open source GIS applications, transport network analysis and public transportation in developing countries. Dr. Jayasinghe is a charted town planner.
Nima Yoezer Tenzin is a Graduate student of Department of Town & Country Planning, University of Moratuwa, Sri Lanka. He is from Bhutan and his main research interests are network analysis, urban modelling and GIS applications for urban & regional planning, big data & data science for urban planning.
Dr. C. Chethika Abenayake is a senior lecturer at Department of Town & Country Planning, University of Moratuwa, Sri Lanka. Her research works are focused on environmental assessments, planning theory and methods. Dr. Abenayake is a charted town planner and a professionally qualified environmental planner.