Abstract— This paper introduces a new decision tree algorithm Diabetes Prediction Algorithm (DPA), for the early prediction of diabetes based on the datasets. The datasets are collected by using Internet of Things (IOT) Diabetes Sensors, comprises of 15000 records, out of which 11250 records are used for training purpose and 3750 are used for testing purpose. The proposed algorithm DPA yielded an accuracy of 90.02 %, specificity of 92.60 %, and precision of 89.17% and error rate of 9.98%. further, the proposed algorithm is compared with existing approaches. Currently there are numerous algorithms available which are not complete accurate and DPA helps.
Keywords: Accuracy, Decision Trees, Error Rate, Kaggle, Machine Learning, Specificity, IoT.
II. INTRODUCTION
Diabetes is an amazingly normal incessant ailment from which almost 8.5 percent of the world populace endures; 422 million individuals around the world need to battle with diabetes. The present systems and instruments for diabetic issue examination and determination depend on the managed methodologies, which need additional and right preparing tests. The preparation tests must be accumulated and ensured with the investigate measurements sorts, which implies that the style conveyance must be considered. As expressed, the class precision is basically based at the right preparing tests [1]. Be that as it may, a couple of systems proposed to find concealed factors inside the dataset that isn't completely examined. So, the incredible classifier wishes total tutoring tests. Hardly any examination utilized semi-administered class and un-regulated contemplating procedure to decrease the issues of the data gathering. This might diminish the issues of managed acing inconvenience, anyway the precision and complexity lopsidedness issue emerge [2]. The significant mission of classifier is it need to lessen the cycles and over-fitting issues. The tree based completely set of principles may likewise endure by methods for such issues [3]. Patients will be started using an IoT-connected glucose monitoring device with built-in alarms. Every night, patient blood sugar falls dangerously low while she sleeps. The alarm sounds, but she can’t hear it
Revised Version Manuscript Received on 05 August, 2019.
Viswanatha Reddy Allugunti, Research Scholar, VIT University, Vellore, Tamil Nadu, India.
Dr. Elango NM, Professor, VIT University, Vellore,Tamil Nadu, India.
Dr Kishor Kumar Reddy C, Associate Professor, Stanley College of Engineering & Technology for Women, Hyderabad, Telegana, India
because her low glucose levels have rendered her unconscious.
Omnipresent detecting empowered by Wireless Sensor Network (WSN) advances are changing the manner in which human services was being conveyed. This empowers us to quantify, induce and comprehend wellbeing markers, utilizing sensors and wearable innovations. The multiplication of these gadgets makes the Internet of Things (IoT), wherein sensors and actuators mix consistently in social insurance biological system, and the data is shared crosswise over stages so as to build up a typical working picture (COP) . Writing recommends that patients, just as social insurance suppliers both, will be profited by IoT in not so distant future gave it is actualized appropriately. A few clients of social insurance IoT are portable restorative applications or wearable gadgets that enable patients to catch their wellbeing information. Clinics use IoT to monitor the area of restorative gadgets, faculty, and patients.
Earlier approaches like Random Forest with accuracy of 85.55%, Bagging with accuracy of 85.33%, Decision Tree with accuracy of 85.09%, Artificial Neural Networks with accuracy of 84.53%, Boosting with accuracy of 84.09%, Naïve Bayes with accuracy of 81.01%, Support Vector Machines with accuracy of 87.6 are proposed by multiple authors [4-7].
IoT Diabetic sensors are best to collect the Glucose and various parameters of the information and these sensors uses the IoT gateways to collect MQTT data from the various diabetic sensors with in the hospital and send this it cloud and store this data as datasets. Our paper introduces a new decision tree algorithm names Diabetics Prediction Algorithm (DPA) based on the Machine learning, uses dataset collected using IOT Diabetes Sensors. Initially, the algorithm is trained with 75% of the data and further tested with 25% of the data [8]. In the proposed algorithm, division points are evaluated whenever there is a change in the class label. To choose the best division point, attribute selection measure information gain is adopted. The performance measure of the proposed algorithm is evaluated using accuracy, specificity, precision and error rate. Further, the proposed algorithm is compared with existing published algorithms [4-7] [9-11].
Internet of Things Based Early Detection of
Diabetes Using Machine Learning Algorithms:
Dpa
Our specific contributions in this paper are listed below:
a.The model is capable to predict diabetics based on the following attributes: Pregnancies, Plasma Glucose, Diastolic Blood Pressure, Triceps Thickness, Serum Insulin BMI , Diabetes Pedigree, Age followed by class label: Diabetes, No Diabetes more effectively.
b.A detailed evaluation against other prediction decision tree algorithms is performed that provide a fair comparison to show the effectiveness of the new model.
c.The new model is computationally efficient and makes it suitable for small devices such as android environment.
d.The proposed model is evaluated with various performance measures such as accuracy, specificity, precision and error rate.
The rest of the paper is organized as follows: chapter 2 introduces Diabetics Prediction Algorithm, chapter 3 illustrates the working procedure of proposed algorithm, chapter 4 focuses on results and discussion and chapter 5 concludes the paper followed by references.
Diabetics Prediction Algorithm
Procedure for evaluating the split points and decision tree generation
a.Read the training dataset T
b.Sort T in ascending order and choose the initial attribute along with the associated class label.
c.Evaluate the Division Points, as shown in equation 1. i. Initially check for change in the class label.
ii. If there is a change in the class label, evaluate the Division Point and the midpoint of changed class labels is the Division Point. For instance, Let V be the initial record and Vi be the second record then division point will be as follows:
Division Point = Mid-Point (V, Vi) (1) d.Choose the Division Point 1 and apply information gain attribute selection measure and evaluate the information gain value and continue this for all the Division Points obtained for initial attribute and the procedure is as follows:
i. Initially, consider attribute and along with its associated class label and evaluate attribute information gain and it is shown in formula (2).
(2)
Where Pi is the probability of class entropy belonging to class i. Logarithm is base 2 because information gain is a measure of the expected encoding length measured in bits.
ii. Further, consider class label and evaluate class information gain and is as follows:
Class information gain is a measure in the information theory, which characterizes the impurity of an arbitrary collection of examples. If the target attribute takes on M different values, then the class entropy relative to this M-wise classification is defined in formula (3).
(3)
Where Pi is the probability of class information gain belonging to class i. Logarithm is base 2 because entropy is a measure of the expected encoding length measured in bits.
Now, compute the information gain: it is the difference of class entropy and attribute entropy and is shown in formula (4).
(4) e.The maximum Information Gain is the best Division
attribute and becomes the root node, shown in formula 5.
Best Division Point = Maximum (Entropy) (5)
f. Finally, if the number of attributes are N, we will get N best division points for individual attributes. As decision tree is a binary tree, there will be only one root node and for this reason, among the N Information Gain values choose one best Information Gain value to form the root node.
g.Now, consider the maximum Information Gain value attribute as the root node and take its split point and divide the tree in binary format i.e. keep the values which are lesser to split point at the left side of the tree and keep the values which are greater and equals to the right side of the tree, and continue the process till it ends with a unique class label.
II. ILLUSTRATION
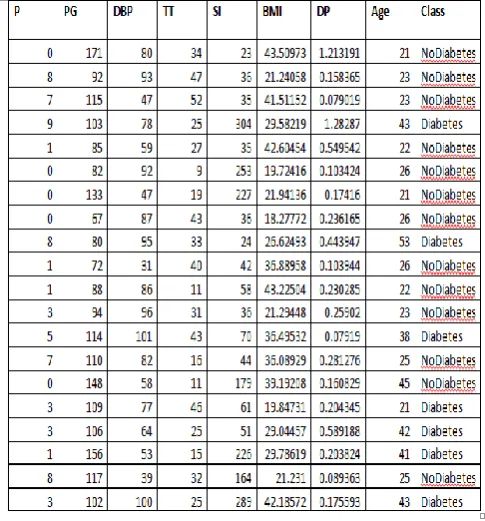
[image:2.595.315.558.475.736.2]Table 1 shows the sample dataset collected using IOT Diabetes Sensors. In the table P indicates Pregnancies, PG indicates Plasma Glucose, DBP indicates Diastolic Blood Pressure, TT indicates Triceps Thickness, SI indicates Serum Insulin, DP indicates Diabetes Pedigree.
Table 1. Data set collected using IOT Diabetes Sensors
N
j
M
i
i i
j P P
P Entropy Attribute
1 1
2 log
Mi
i
i
P
P
Entropy
Class
1 2
log
Entropy
Attribute
Entropy
Class
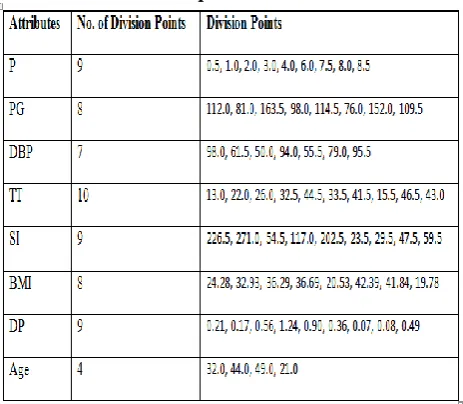
Initially Division Points are computed for the data shown in Table 1. The computed Division Points are shown in Table 2.
Table 2: Computed Division Points
Based on the Division Points and Information Gain values, rules are generated as follows and the generated decision tree is shown in Figure 1.
1: If [ (H < 32.0) and (F < 20.539154) and (F < 19.785736)] Then (prediction = NoDiabetes)
2: If [ (H < 32.0) and (F < 20.539154) and (F >= 19.785736)] Then (prediction = Diabetes)
3: If [ (H < 32.0) and (F >= 20.539154)] Then (prediction = NoDiabetes)
4: If [ (H >= 32.0) and (D < 13.0)] Then (prediction = NoDiabetes)
5: If [ (H >= 32.0) and (D >= 13.0)] Then (prediction = Diabetes)
[image:3.595.313.552.305.658.2] [image:3.595.62.193.457.666.2]H (7) |--- < 32.0 | F (5)
| |--- < 20.539154 | | F (5)
| | |--- < 19.785736 | | | NoDiabetes | | |--- >= 19.785736 | | | Diabetes | |--- >= 20.539154 | | NoDiabetes |--- >= 32.0
| D (3) | |--- < 13.0 | | NoDiabetes | |--- >= 13.0 | | Diabetes
Fig. 1: Decision Tree generated for the data shown in Table 1.
III. RESULTS AND DISCUSSION
For the experimentation, dataset with 15000 records and 8 attributes are collected using IOT Diabetes Sensors. Initially, the algorithm is trained with 75% of the data and further tested with 25% of the data. In the proposed algorithm, division points are evaluated whenever there is a change in the class label. To choose the best division point, attribute
selection measure information gain is adopted. The algorithm is coded using Net Beans IDE and executed in intel i3 processor, 4 GB RAM.
The accuracy of the proposed model Diabetes Prediction Algorithm (DPA), shown in Table 3, is compared with the existing approaches: Random Forest, Bagging, Decision Tree, Artificial Neural Networks, Boosting, naïve Bayes and Support Vector Machines respectively. The proposed model yielded an accuracy of 90.02 %, better when compared with previous approaches. The pictorial representation of accuracy comparison is shown in Figure 2. The error rate of the proposed model Diabetes Prediction Algorithm (DPA), shown in Table 4, is compared with the existing approaches: Random Forest, Bagging, Decision Tree, Artificial Neural Networks, Boosting, naïve Bayes and Support Vector Machines respectively. The proposed model yielded an accuracy of 9.98 %, better when compared with previous approaches. The pictorial representation of accuracy comparison is shown in Figure 3.
Table 3 Accuracy comparison with existing approaches
Model name
Error Rate (%)
Random Forest (RF)
14.442Bagging
14.667Decision Tree (DT)
14.91ANN
15.468Boosting
15.902Naïve Bayes (NB)
18.99SVM
12.4DPA
6.2Table 4 Error Rate comparison with existing approaches
Figure 3 Error Rate comparison with existing approaches
Further, proposed DPA is compared with Decision Stump, Hoeffding Tree, Naïve Bayes and Simple Logistic Algorithms using the data collected from IOT Diabetes Sensors in terms of accuracy, and the results are shown in Table 5. Here, we used WEKA tool for finding the accuracies of existing algorithms.
Table 5: Accuracy Comparison with other algorithms using Weka
Model Name
Accuracy (%)
Decision Stump 78
Hoeffding Tree 87.36
Naïve Bayes 79.36
Simple Logistic 79.14
DPA 90.02
Further, proposed DPA is compared with Decision Stump, Hoeffding Tree, Naïve Bayes and Simple Logistic Algorithms using the data collected from IOT Diabetes Sensors in terms of error rate, and the results are shown in Table 6. Here, we used WEKA tool for finding the error rate of existing algorithms.
Table 6: Error Rate Comparison with other algorithms using Weka
Model Name
Error Rate (%)
Decision Stump 22
Hoeffding Tree 12.64
Naïve Bayes 20.64
Simple Logistic 20.85
DPA 9.98
Further, proposed DPA is compared with Decision Stump, Hoeffding Tree, Naïve Bayes and Simple Logistic Algorithms using the data collected from IOT Diabetes Sensors in terms of precision, and the results are shown in Table 7. Here, we used WEKA tool for finding the precision of existing algorithms.
Table 7: Precision Comparison with other algorithms using Weka
Model Name
Precision (%)
Decision Stump 84.5
Hoeffding Tree 87.2
Naïve Bayes 78.9
Simple Logistic 78.6
DPA 89.12
Further, proposed DPA is compared with Decision Stump, Hoeffding Tree, Naïve Bayes and Simple Logistic Algorithms using the data collected from IOT Diabetes Sensors in terms of specificity, and the results are shown in Table 8. Here, we used WEKA tool for finding the specificity of existing algorithms.
Table 8: Precision Comparison with other algorithms using Weka
Model Name
Specificity (%)
Decision Stump
78.0
Hoeffding Tree
87.4
Naïve Bayes
79.4
Simple Logistic
79.1
DPA
92.60
IV. CONCLUSIONS
WEKA tool. Further, DPA algorithm is compared with existing published algorithms. Overall, DPA algorithm is outperforming when compared with all the approaches and yielded an accuracy of 90.02 %, error rate of 9.98%, precision of 89.12% and specificity of 92.60%.
REFERENCES
1. Akolekar, Ranjit, ArgyroSyngelaki, Rita Sarquis, Mona Zvanca, and Kypros H. Nicolaides. "Prediction of early, intermediate and late pre‐ eclampsia from maternal factors, biophysical and biochemical markers at 11–13 weeks."Prenatal diagnosis 31, no. 1 (2011): 66-74. 2. Alssema, M., D. Vistisen, M. W. Heymans, G. Nijpels, C.
Glümer, P. Z. Zimmet, J. E. Shaw et al. "The Evaluation of Screening and Early Detection Strategies for Type 2 Diabetes and Impaired Glucose Tolerance (DETECT-2) update of the Finnish diabetes risk score for prediction of incident type 2 diabetes." Diabetologia 54, no. 5 (2011): 1004-1012.
3. Farran, Bassam, Arshad Mohamed Channanath, KazemBehbehani, and Thangavel Alphonse Thanaraj. "Predictive models to assess risk of type 2 diabetes, hypertension and comorbidity: machine- learning algorithms and validation using national health data from Kuwait—a cohort study." BMJ open 3, no. 5 (2013): e002457.
4. Faust, Oliver, Rajendra Acharya, Eddie Yin-Kwee Ng, Kwan-Hoong Ng, and Jasjit S. Suri. "Algorithms for the automated detection of diabetic retinopathy using digital fundus images: a review." Journal of medical systems 36, no. 1 (2012): 145-157
5. Huang, Guang-Bin, Hongming Zhou, Xiaojian Ding, and Rui Zhang. "Extreme learning machine for regression and multiclass classification." Systems,Man, and Cybernetics, Part B: Cybernetics, IEEE Transactions on 42, no. 2 (2012): 513-529
6. Jensen, Morten Hasselstrøm, ZeinabMahmoudi, Toke Folke Christensen, Lise Tarnow, Edmund Seto, MetteDencker Johansen, and Ole Kristian Hejlesen. "Evaluation of an algorithm for retrospective hypoglycemia detection using professional continuous glucose monitoring data." Journal of diabetes science and technology 8, no. 1 (2014): 117-122.
7. Kalaiselvi, C., and G. M. Nasira. "Classification and Prediction of Heart Disease from Diabetes Patients using Hybrid Particle Swarm Optimization and Library Support Vector Machine Algorithm."
8. Karthikeyan, T., and K. Vembandasamy. "A Novel Algorithm to Diagnosis Type II Diabetes Mellitus Based on Association Rule Mining Using MPSO- LSSVM with Outlier Detection Method." Indian Journal of Science and Technology 8, no. S8 (2015): 310-320.
9. Karthikeyan, T., and K. Vembandasamy. "A Refined Continuous Ant Colony Optimization Based FP- Growth Association Rule Technique on Type 2 Diabetes." International Review on Computers and Software (IRECOS) 9, no. 8 (2014): 1476-1483.
10. Kuo, R. J., S. Y. Lin, and C. W. Shih. "Mining association rules through integration of clustering analysis and ant colony system for health insurance database in Taiwan." Expert Systems with Applications 33, no. 3 (2007): 794-808.