Software
Patterns and Architecture
Under Examination Hammer
An Approach to the Consolidation of Interdisciplinary KnowledgeA Thesis Submitted for the Degree of Doctor of Philosophy
of the
Australian National University
Hassan Almari
I declare that the work in this thesis is entirely my own and that to the best of my knowledge it does not contain any materials previously published or written by another person except where otherwise indicated.
Special Thanks
To all my family members who gave me moral support and encouragement in the entire process of this study; utmost appreciation is extended to my parents, who gave me courage and laid a firm
foundation for my education and success. I also appreciate my brothers and sisters for their ultimate encouragement and care. Thanks go, also, to my sons for their perseverance whilst I was away or busy. They missed out on paternal love. Last, I admire Jamilh's (my lovely wife's) positive attitudes and for being at the bedrock of every success I have ever achieved. When I was down
Acknowledgements
I take this opportunity to highly praise my remarkable supervisor, Dr. Clive Boughton, for his continuous support, advice, friendship, and patience. He has acted as my mentor, guiding me through the rugged terrain of academia, starting with my master’s program in 2008. He has provided me with his support, not only in regard to my studies, but also in regard to my work and personal matters. Essentially, it was his unrelenting efforts in providing feedback whenever needed, which enabled me to come up with a well-crafted project.
I would also like to recognise the efforts made by Dr. Henry Gardener and Dr. Athman Bouguettaya for their support and help during my surveys/distribution processes within this project.
Throughout this journey, there is also a number of people who provided me with guidance and ideas. To name but a few, I wish to salute my friends Dr. Carol Boughton for her editing and advice, Dr. Shayne Flint for being a wise and helpful friend during my work, and Dr. Ziyad Alshaikh for his recommendations during my first year of this research.
Equally, I salute all the people within the Saudi Ministry of Defence for their support dur-ing my research, especially Saudi Air Force for their hospitality and willdur-ingness to share their knowledge with me regarding software development.
My research has been a long journey, which has been full of obstacles; therefore, it would be disappointing if I fail to mention Dr. Sergey Denisov for his advice and professional help during this thesis’ formatting; Dr. Vashkar Chowdhury for his statistical advice and statistics proofreading; Ms Sharen and Mr. Angelo Victor Mercure for their overall proofreading; and Dr. Jasur Abdullaev for his advice, and support during the final phase of this thesis.
I wish to state that my transitional endeavour, from the military environment to education, has not been a bed of roses, as it has been full of ups and downs. Nevertheless, the experience and knowledge I have gained motivated me to appreciate Australian National University for giving me the opportunity to conduct my research. Specifically, I appreciate my fellow graduate students Mazen Alismail, and Dr Alexander Krumphols for their excellent discussions, which opened new ideas and possibilities for me. I cannot finish without mentioning members of staff working in the Research School of Computer Science for their support and guidance.
Abstract
Software engineering is normally perceived, and even defined, based upon applicability of scientific and technical knowledge, in order to provide solutions to different challenges. The bright side of engineering concepts in general, is the continuous process of acquiring knowledge and skills needed to develop and make adjustments to various systems, in respect to helping humankind.
An important phase of this process is”Architecting”, which is the big picture of any in-tended systems. While good architecture leads to successful systems, bad architecture can result in misfortune.
In this thesis, my proposition is to investigate, in depth, both theoretical (academic) and industry domains, regarding the way in which they treat Software Pattern (SP), Software Archi-tecture (SA), and Software ArchiArchi-tecture Evaluation (SAE) techniques.
I argue that the process ofcreating, evaluating, and documentingSPs and SA with no com-mon guidelines, standards, and frameworks, will result in unused and conflicted information within their areas, which finally will impact the software engineering field. While the employ-ment of interdisciplinary knowledge (such as SPs, modelling techniques, description languages, evaluation methods, standards, and frameworks), could elevate SAdevelopment and validation methodologies, and increase its utilisation within the software engineering community.
The goal here is to help build better systems, which could be improved by developing suit-able SA, and evaluate its qualities by proper methods and tools, before further development, which should save time as well as money.
Therefore, after a long process of analysing the current-state-of-the-art,I have introduced in this thesis novel findings concerning descriptions, relationships, documentation, and utilisation in relation to SA, SAE, and SPs, through employing several investigatory techniques, including comparisons between reliable references, questionnaires, field study, and case study.
The investigation of SPs resulted in creating a database as a partial solution, in order to minimise their confusion within the literature, concerning their definitions, categorisations, and relationships with different quality attributes Quality Attribute (QA)s; also, to introduce the information in a proper fashion for users, which includes the required data that supports com-parisons between pattern references, and to facilitate their selection processes.
The issues, gaps, limitations, inconsistencies, and conflicts within current SA, QAs, and SPs discovered by this study, such as their poor description and the ignorance of them by developers during software development, has led to important recommendations, as well as suggestions for future research.
The required information from different sectors (government, academia and industry) re-garding SPs, SA, SAE, and modelling languages, has been gathered, and analysed through two surveys and a field study.
improveand generalise theMoreno et al.[2008] performance model.
Contents
Special Thanks v
Acknowledgements vii
Abstract ix
List of Figures xx
List of Tables xxvi
Abbreviations xxvii
Preface xxxiii
I Introduction 1
1 Overview 3
1.1 Introduction . . . 4
1.2 Initial motivation and research aim . . . 4
1.2.1 Contributing Factors to the Problem Domain of this Thesis . . . 6
1.3 Methodology and Research Design . . . 6
1.3.1 Research Method . . . 6
1.3.2 Research Activities . . . 7
1.3.3 Research Life Cycle . . . 7
1.4 Thesis Scope and Structure . . . 8
1.4.1 Introduction (PART I) . . . 11
1.4.2 Contribution (PART II) . . . 11
1.4.3 Wrapping up (PART III) . . . 12
1.5 Publications . . . 12
1.6 Summary of Contributions . . . 13
2 Background 15 2.1 Introduction . . . 16
2.2 Initial research . . . 18
2.3 Software Architecture Description . . . 27
2.3.1 Brief Analysis of SA description methods . . . 27
2.3.2 Views of SA description . . . 33
2.3.3 Formal methods and languages . . . 35
2.3.3.1 Common formal methods and languages . . . 37
2.3.3.2 Applicability of formal methods in the software Life Cycle . . . 38
2.3.3.3 Degree and scope of Formal methods . . . 38
2.3.3.4 ADLs as example of formal description . . . 39
2.3.4 ACME in brief . . . 41
2.3.4.1 ACME design trade-offs . . . 42
2.3.5 Conclusion . . . 43
2.4 Model driven approaches and Architecture . . . 43
2.4.1 Model driven software development . . . 44
2.4.1.1 Importance of domains in MDSD . . . 47
2.4.2 Introduction to MDA . . . 48
2.4.2.1 MDA Framework . . . 49
2.4.3 Object Oriented (OO)-method . . . 51
2.4.3.1 Key aspects of OO-method with respect to SA, SPs, and QAs . . . 52
2.4.3.2 Mapping OO-Processes to MDA-Processes . . . 53
2.4.3.3 Extra features of OO-methods missing from MDA . . . 54
2.4.4 eXecutable and Translatable UML (X TUML) as an example of model automation approach 54 2.4.5 Key aspects of MDSD approaches with respect to SA, SPs, and QAs . . . 55
2.5 Evaluating Software Architecture . . . 64
2.5.1 Evaluating software architecture in general . . . 64
2.5.2 Comparisons between current common architecture evaluation approaches . . . 65
2.5.2.1 Scenario-based evaluation methods . . . 66
2.5.2.2 Measuring techniques . . . 74
2.5.3 Analysis of Specific Evaluation Techniques . . . 77
2.5.3.1 Software Engineering Institute (SEI) -- Bass approach . . . 78
2.5.3.2 Satisfying QAs through the use of SPs,Babar et al.[2005] . . . 82
2.5.3.3 Mapping between SEI Tactics approach andBabar et al.[2005] Pattarn approach 84 2.5.3.4 Exploring quality attributes using architectural prototypingBardram et al.[2005] 85 2.5.3.5 Garlan approaches . . . 87
2.5.3.6 Model-driven performance analysisBecker[2008] andMoreno et al.[2008] . . 89
2.5.3.7 Evaluating SA using Metrics --Zayaraz[2010] . . . 91
2.5.4 QAs in SA Context . . . 92
2.5.4.1 Complexity of quality attributes . . . 92
2.5.4.2 Understanding quality attributes . . . 93
2.5.4.3 Quality attribute characterisations . . . 94
2.5.4.4 Sensitivity points and trade-off points . . . 96
2.6 Research challenges . . . 97
2.6.1 Research conceptual challenges . . . 97
2.6.2 Major architecture developments challenges and debates . . . 100
2.6.2.1 General challenges influencing the architecture evaluation . . . 100
2.6.2.2 Standardisation as a common problem in software architecture . . . 102
2.6.2.3 Architecture modelling Challenges . . . 103
2.7 Conclusion and Conjecture . . . 103
II Contribution 105 3 The dilemma of Software Pattern descriptions with partial solution 107 3.1 Introduction . . . 108
3.2 Rationale of the investigation approach . . . 108
3.3 Investigation Analyses . . . 111
3.3.1 Patterns and Quality Attributes Refinement . . . 111
3.3.1.1 Problems Discovered within the Current PatternDefinitions and Terminologies. 112 3.3.1.2 Problems Discovered within Current PatternCategorisations . . . 114
3.3.2 The Variation Concept as a Problem within QAs . . . 116
3.4 Conflict Example - (Proxy Pattern) . . . 117
3.5 Summary of the issues discovered by this study . . . 119
3.6 Proposed solution . . . 120
3.6.1 Functionality description . . . 122
3.6.1.1 Pages descriptions . . . 122
3.7 Related work . . . 130
3.8 Conclusion . . . 130
4 Factors Influencing Utilisation of Software Patterns: A Questionnaire Analysis Result 133 4.1 Executive summary . . . 134
4.2 Introduction . . . 134
4.3 Research methodology and Survey process . . . 135
4.3.1 Research technique and process . . . 135
4.3.2 Instrument questions . . . 135
4.3.3 Invitation mechanism and Instrument distribution . . . 140
4.3.4 Target population and Sampling technique . . . 140
4.3.5 Procedure of the analysis . . . 141
4.3.6 Rationale of the selected analysis methods . . . 143
4.3.6.1 Single Dimensional Analysis Methods . . . 143
4.3.6.2 Two-Dimensional Analysis Methods . . . 143
4.3.6.3 Three and Four-Dimensional Analysis Methods . . . 143
4.4 Findings and Recommendations . . . 144
4.4.1.1 Individual Analysis . . . 146
4.4.1.2 Two Dimensional Analysis . . . 149
4.4.2 Important comments from some non-significant results that related to the research goals 156 4.4.3 Inappropriateness of three and four dimensional analyses . . . 158
4.5 Related work . . . 158
4.6 Limitations . . . 159
4.7 Conclusion . . . 159
5 Utilisation of Software Architecture Artefacts and its Evaluation 163 5.1 Executive summary . . . 164
5.2 Introduction . . . 164
5.3 Survey methodology and process . . . 165
5.3.1 Instrument questions . . . 165
5.3.2 The analyses methods and procedure . . . 171
5.3.2.1 Data Distribution Normality statistics . . . 172
5.3.3 Findings and Recommendations . . . 172
5.3.3.1 Significant Results . . . 176
5.3.3.2 Inappropriateness of Three and Four Dimensional Analyses . . . 188
5.3.3.3 Focused Analysis on Q6, Q7, Q13 and Q14 . . . 189
5.3.4 Related Work . . . 196
5.3.5 Limitations . . . 196
5.3.5.1 Summary of significant results . . . 197
5.4 Field Study Analysis . . . 200
5.4.1 Introduction . . . 200
5.4.2 Objective of the Field Study . . . 200
5.4.3 Study Process and Methods . . . 201
5.4.3.1 Organisation Location and Selection Criteria . . . 201
5.4.3.2 Communication Procedure . . . 202
5.4.4 Preliminary phase . . . 202
5.4.5 Result of the preliminary phase . . . 203
5.4.6 Final Phase -- Conducting the Study . . . 206
5.4.7 Findings and Recommendations . . . 206
5.5 An Experience Story . . . 212
5.6 Conclusion . . . 213
6 The RCS as a Case Study and Promoting theMoreno et al.[2008] Approach 215 6.1 Introduction . . . 216
6.2 RCS under Examination-Intro . . . 216
6.2.1 Case Study Process . . . 217
6.2.2 Discussion and Findings . . . 217
6.2.2.1 RCS architecture and BCK styles . . . 219
6.2.2.2 The RCS architecture and Mellor Styles . . . 223
6.2.3 Manifestation of QAs within RCS architecture . . . 227
6.3 Incipient Concept to PromoteMoreno et al.[2008] approach-Intro . . . 231
6.3.1 Patterns and QAs conceptual schema . . . 231
6.3.1.1 Conceptual schema description and steps . . . 232
6.3.1.2 Prospect of the conceptual schema . . . 236
6.3.2 Conceptual schema limitations . . . 241
6.4 Conclusion . . . 242
III Wrapping up 243 7 Discussion and conclusion 245 7.1 Introduction . . . 246
7.2 Summary of the research contribution . . . 246
7.3 Limitations and Drawbacks of the contribution . . . 249
7.4 Recommendations and Future work . . . 250
7.5 Overall conclusion . . . 251
7.6 Closing remarks . . . 252
A Publications 271
B Complementary background information for Chapter 2 301
B.1 Introduction . . . 301
B.2 MDA Advantages and Disadvantages . . . 301
B.3 More about ADLs . . . 302
B.3.0.1 ADL elements . . . 303
B.3.0.2 Design goals of ADLs . . . 303
B.3.0.3 The Most ADLs that are still supported . . . 306
C Database application 309 C.1 Technical description . . . 309
C.1.1 DB tables . . . 309
C.1.2 Database Snapshots . . . 311
C.1.3 Brief description of development changes and difficulties . . . 312
D Complement information for the SPs Survey 315 D.1 Introduction . . . 315
D.2 Rationale of the Two-dimensional analysis method used -- by details . . . 315
D.3 Two dimensions supportive analysis . . . 316
D.3.1 Analyses of (Q1 and each of Q17--Q20) . . . 317
D.3.2 Analyses of (Q2 and both (Q5 and Q8) . . . 317
D.3.3 Analyses of (Q2 and each question from Q17 to Q20) . . . 317
D.3.4 Analyses of (Q3 and Q4): . . . 321
D.3.5 Analyses of (Q4 and each of the questions from Q17 to Q20): . . . 321
D.3.6 Examples of 3 and 4 dimensional analysis: . . . 322
D.4 Snapshots of primitive analysis database . . . 324
D.5 Summary Tables for most important results . . . 325
E Complement information for SA Survey 331 E.1 Survey Questions . . . 331
E.2 Individual Analysis (One dimension _Descriptive statistics) . . . 331
E.2.1 Analyses of (Q8) . . . 332
E.2.2 Analyses of (Q9 and Q10) . . . 332
E.2.3 Analyses of (Q12): ”Do you know or use any architectural evaluation method that can produce quantitative measures surrounding architecture characteristics?” . . . 333
E.3 Two dimensions matrices analysis . . . 334
E.3.1 Information related to the significant results . . . 334
E.3.1.1 Analyses of Q1 with (Q9 and Q10) . . . 334
E.3.1.2 Analyses of Q1 with (Q15--Q23) . . . 335
E.3.1.3 Analyses of Q2 with (Q9 and Q10) . . . 340
E.3.1.4 Analyses of (Q3 and Q17) . . . 343
E.3.1.5 Analyses of Q4 with (Q21 and Q23) . . . 346
E.3.1.6 Analyses of (Q5 and Q16): . . . 347
E.3.1.7 Analyses of (Q5 and Q18): . . . 348
E.3.1.8 Analyses of (Q5 and Q22) . . . 350
E.3.1.9 Analyses of Q6 with (Q9, Q10, and Q15 to Q23): . . . 352
E.3.1.10 Analyses of Q7 with (Q9, Q10, and Q15 to Q23): . . . 353
E.3.1.11 Analyses of (Q10 and Q17): . . . 354
E.3.1.12 Analyses of (Q13 and Q23): . . . 355
E.3.1.13 Analyses of (Q10 and Q13): . . . 356
E.3.2 Examples of non-significant results for 2-dimensions analyses . . . 356
E.3.2.1 Analyses of (Q2 and Q6) . . . 356
E.3.2.2 Analyses of (Q2 and Q7): . . . 358
E.3.2.3 Analyses of (Q2 and Q13): . . . 359
E.3.2.4 Analyses of (Q2 and Q14): . . . 359
E.4 Examples for three and four dimensional analyses . . . 360
E.4.1 Three dimensional analysis: . . . 360
E.4.2 Example for Four dimensional analyses . . . 363
E.5 Supported information for the Summary Table of Chapter 5 . . . 364
E.5.2 Analyses of (Q3 and Q5): . . . 364
E.5.3 Analyses of (Q3 and Q7): . . . 365
E.5.4 Analyses of (Q9 and Q10 by Q6) . . . 366
E.5.5 Additional important summary tables for 2-Dimensional analyses . . . 367
E.6 Supportive information for the Field study . . . 381
F Complementary information for The RCS -- Chapter 6 389 F.1 RCS analysis - Supporting Figures . . . 390
G Opportunity to improve SA through future-work thoughts 395 G.1 SysAE approach - Big picture - Long-term vision . . . 395
G.2 SAQEF evaluation framework and models . . . 397
G.2.1 SAQEF specifications . . . 398
G.2.2 SAQEF Concept and Methodology . . . 398
G.2.2.1 Brief description of the Solution . . . 398
G.2.2.2 Brief description of utilised standards, profiles, language, and framework includ-ing some of SAQEF examples . . . 399
G.3 SAQEF model organisation and views . . . 402
G.4 Architectural tactics and metrics . . . 407
G.4.1 Applying metrics with the parametric diagram . . . 407
G.5 Conclusion . . . 408
List of Figures
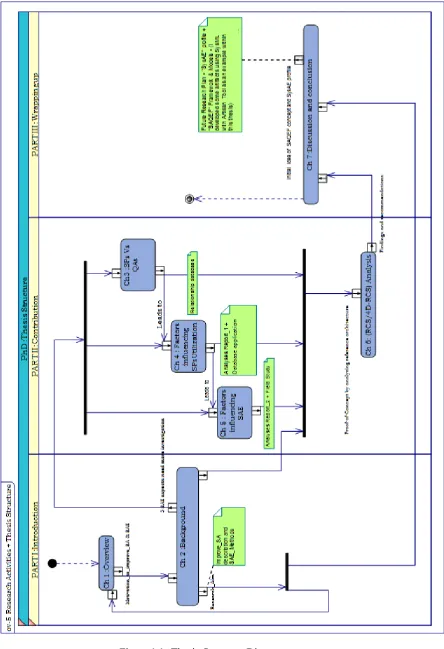
1.1 Thesis-Structure-Diagram. . . 10
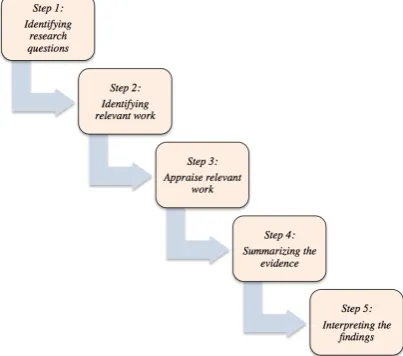
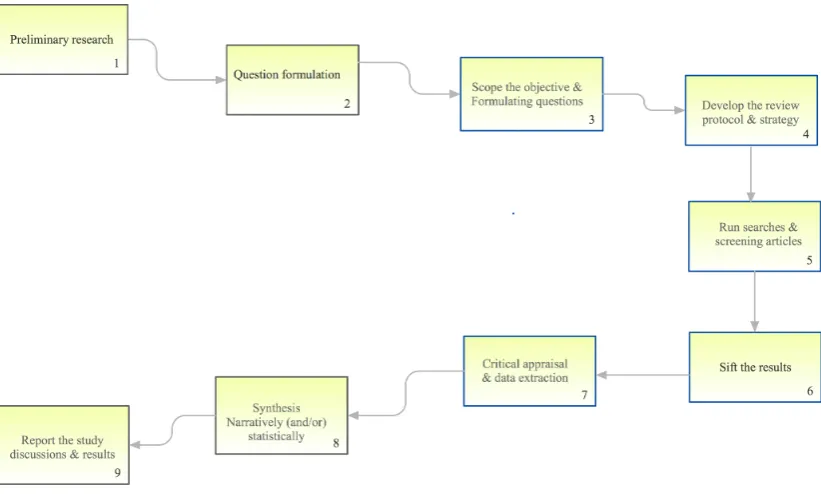
1.2 Dependency relationships between chapters and appendices: Package Diagram. 11 2.1 The main common steps for aSystematicreview. . . 20
2.2 Comprehensive search and Systematic review processes in IDEFO diagram for-mat as adopted for this study. . . 27
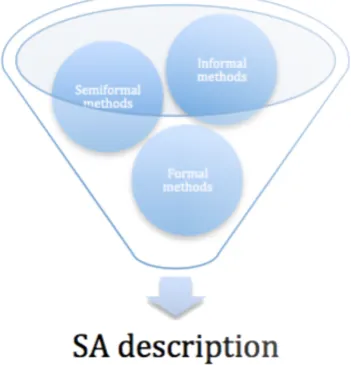
2.3 The three main methods for describing SA. . . 28
2.4 General prospective of the model types for describing a system. . . 35
2.5 Evolution of formal methods. . . 36
2.6 Formal methods adoption has grown by 53 % within 3 years. . . 37
2.7 AADL abstraction and key specification elements, afterFeiler et al.[2006]. . . 41
2.8 Main differences between modelling approaches, afterCabot[2014]. . . 44
2.9 Basic concept of MDA. . . 49
2.10 The basic, extended, and complete MDA framework. . . 50
2.11 MDA basic process. . . 51
2.12 OO – method concept schema. . . 52
2.13 TheXTUML concept. . . 55
2.14 Horizontal and Vertical transformations of models. . . 56
2.15 Relationship between models and real world. . . 59
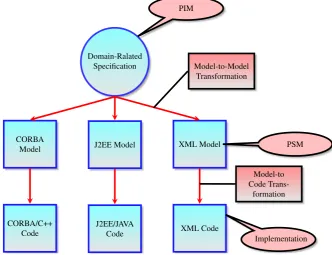
2.16 Model to Model Transformation . . . 60
2.17 Evaluation techniques. . . 65
2.18 Activities in SAAM analysis. . . 67
2.19 The four phases of ATAM. . . 68
2.20 Steps of ATAM. . . 70
2.21 A conceptual flow of ATAM. . . 71
2.22 Steps of ARID. . . 72
2.23 The ALMA method five steps. . . 73
2.24 The ALPSM method six steps. . . 73
2.25 Quality attribute scenario representation model. . . 79
2.26 Performance characteristics: stimuli, responses and architecture decisions. . . . 79
2.27 Performance tactics with elaboration. . . 82
2.28 Relationships between security attributes, properties, and patterns. . . 83
2.29 Applying Auditability tactic. . . 83
2.30 Similarity between Bass and Barbar tactics. . . 86
2.31 Performance framework. . . 89
3.1 Visualizing the Problem Area. . . 109
3.2 The main SPs investigation phases towards producing the solution. . . 109
3.3 Examined references included – (Database snapshot). . . 111
3.4 Terminologies of “Pattern” within software development lifecycle. . . 113
3.5 The GoF approach for classifying and describing Proxy pattern, includes all variants and relationships with quality attributes. . . 117
3.6 POSA team approach for classifying, describing Proxy pattern, include all vari-ants and relationships with quality attributes. . . 118
3.7 Reliability as an example of its QAs sub-categories differences. . . 119
3.8 Reliability sub-categories differences between ISO-9126 and ISO-25010. . . . 121
3.9 Overall structure of matrix pages and tabs. . . 123
3.10 Landing page, which describe the application and its pages functionalities. . . . 123
3.11 List of patterns, their other names, and definitions. . . 124
3.12 Drop down menu for SPs categorisations. . . 125
3.13 GoF categorisation table. . . 125
3.14 Description table for ‘Check Point’ pattern. . . 126
3.17 Edit existing relation page. . . 128
3.18 Create new relationships between SP and QA-(QA information page- step 2). . 129
3.19 Search relation page, either by pattern or by quality attribute. Also, it could search all conflict relations within the database . . . 129
4.1 The survey process that applied for Chapters 4 and 5, afterKasunic[2005]. . . 135
4.2 The three sections of the questionnaire. . . 141
4.3 The level of participants’ agreement to the four statements (proposed solutions). 149 4.4 Mean response of how often developers’ uses software styles/patterns during their work by their general field of expertise. . . 150
4.5 Mean plots (a) to (d) for each of the statements (Q17 to Q20) in Y-axis, along with developers’ work sectors in X-axis. (A=Academia; I=Industry; G=Gov-ernment). . . 153
4.6 The mean of the items for developers who are aware of software styles/patterns. 154 4.7 Developers’ work sectors vs how often they used software patterns (frequency in stacked bar chart). . . 156
5.1 The two pillars to investigate SA, SAE, and SPs relationships. . . 164
5.2 The three main sections of the survey. . . 166
5.3 The main five SA elements influencing SAE. . . 166
5.4 The three main sections and their sub-sections of the analysis. . . 172
5.5 Respondent’s general field of expertise regarding software development. . . 172
5.6 The main factors Encouraging the utilisation of modelling techniques to de-scribe SA. . . 177
5.7 The main factors Discouraging the utilisation of modelling techniques to de-scribe SA. . . 178
5.8 The percentage of respondents who are aware of any system/software architec-tural tactics/metrics that have been or are being used for evaluating architecture description models. . . 181
5.9 Respondents who identified the most important factors that could SUPPORT SA quantitative evaluation. . . 181
5.10 Means for the statements in (Q15-Q19), with error bar and assumed mean line. 183 5.11 Means for the statements in (Q20 to Q23), with error bar and assumed mean line. 184 5.12 The Field study phases. . . 201
6.1 RCS architecture analysis steps. . . 217
6.2 RCS overall architecture(for Military Application),after,Finkelstein[2008]. . 218
6.3 Functional relationships between modules of Elementary Loop of Functioning (ELF),after Meystel et al.[2002]. . . 218
6.4 RCS computational nodeInner-structure,after Finkelstein[2008]. . . 221
6.5 A top-level Elementary Loop of Functioning, with two control levels (nodes), after Meystel et al.[2002]. . . 222
6.6 Relationships within a typical node of RCS Architecture, after Meystel et al. [2002]. . . 223
6.7 The link between the entire RCS appraisal process and Chapter 3 findings. . . . 231
6.8 Model driven engineering and Model Driven Analysis. . . 232
6.9 Conceptual patterns evaluation schema. . . 233
6.10 The forces withinPatterningredients,after Tešanovic[2005]. . . 233
6.11 Derived evaluation metrics starting from the right tactics. . . 234
6.12 Brief of the scenario-based dependencies and activities during SAE,after Kaz-man et al.[1996]. . . 235
6.13 Pipe and Filterfamily illustrated through ACME-Studio tool. . . 235
6.15 Example of the model processes for (coupling measure), by utilising SysML and
Artisan-tool. . . 240
B.1 MDA advantages,AfterFlint[2008]. . . 301
B.2 MDA limitations,AfterFlint[2008]. . . 302
C.1 Create new relation between SP and QA, Pattern information page. . . 311
C.2 Layers patterndescription table, including definition, and related (QAs). . . 312
C.3 Overview page . . . 312
D.1 Stacked bar chart: Agreement with the four statements by different sectors. . . 319
D.2 Stacked bar chart: Years of experience in software development field with the developers awareness of software style/patterns. . . 321
D.3 Overview page - for the primitive analysis database . . . 324
D.4 Responses primitive analysis page - Respondent’s countries, total answers, per-centage of their answers out of 20 questions. . . 324
D.5 Selection criteria page - were one or more questions should be selected and submitted by clicking ’submit’ button to get the analysis results. . . 325
E.1 Bar chart for the best language to use to describe software/system architecture as identified by the respondents. . . 332
E.2 Box plot of two items Q9 and Q10. . . 332
E.3 Pie Chart of the percentage of the respondents who know or use any architectural evaluation method that can produce quantitative measures surrounding architec-ture characteristics. . . 333
F.1 Each layer of the system contains a number of RCS-nodes, each containing – Behaviour Generation (BG), World Model (WM), Sensory Processing (SP), and Value Judgement (VJ)- modules. The nodes are interconnected as a layer style, or lattice, through the communication system,Meystel et al.[2002]. . . 390
F.2 Hierarchical image and entity frames within Sensory Processing (SP) compo-nent,AfterMeystel et al.[2002]. . . 391
F.3 Snapshot for the RCS Node structure with SysML, using Artisan tool.. . . 392
F.4 Extracted RCS architecture for coupling evaluation . . . 393
F.5 Modified model from the extracted RCS architecture, for comparison purpose. . 393
G.1 System Architecture Evaluation (SysAE-Product) structure, Using component base products approach. . . 396
G.2 Requirement diagram – SAQEF. Requirement Hierarchy. . . 399
G.3 SAE – Operational concept (Graphical representation). . . 400
G.4 SAE – Operational concept (Model components representation). . . 400
G.5 UPDM structure. . . 401
G.6 UPDM structure (package digram) - Artisan tool. . . 402
G.7 SAQEF Packaging structure–(using packages and views) - (Package diagram) – Artisan tool –The package ’SAQEF Model’ illustrate how the model organised into packages that contain model elements . . . 404
G.8 SAQEF (Efficiency assessment) – More details with employment of DoDAF views - (Requirement diagram) – Artisan tool . . . 405
G.9 SAQEF-AV-1, used of DoDAF views - All view (AV-1) - Artisan tool . . . 406
G.10 Measurement (Dimensions and Units) – SAQEF profile – Artisan tool . . . 408
List of Tables
2.1 This is the review strategy that has been applied in Chapter 2, followed by
Chapters 3, 4 and 5). . . 21
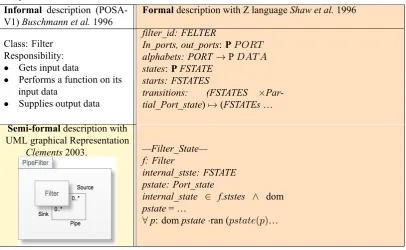
2.2 Formal, Semi-formal, and Informal ways of representing a section of Pipe-Filter family. . . 34
2.3 Rushby’s four levels of formalisation. . . 38
2.4 General comparisons between ACME and AADL main components. . . 40
2.5 Advantages of MDSD . . . 45
2.6 Mapping (Rushby 1993b) formality levels into the model maturity levels by Rensink et al.[2006]. . . 47
2.7 Analogies between MDA and the OO-method. . . 54
2.8 MDSD approaches, Transformations Methods, and QAs – Comparison. . . 58
2.9 Comparisons between different evaluation techniques. . . 76
2.10 Absence of solutions to some problems inBabar et al.[2005] model. . . 84
2.11 Non-mapped elements betweenBabar et al.[2005] model and SEI model. . . 84
2.12 Software quality characterisation. . . 95
2.13 Set of quality attributes trade-offs. . . 97
3.1 Descriptions of the 7-Analysis Steps for the Targeted Resources. . . 110
3.2 Example of extracting pattern data in a format suitable to assist evaluation. . . 127
4.1 Summary of the questions and the objectives of each section . . . 135
4.2 Section 1. Background Questions (Questions marked with (*) are mandatory). 136 4.3 Section 2. Pattern utilisation questions. . . 137
4.4 Section 3. Documentation of Software Patterns. . . 138
4.5 Geographical distribution of the survey respondents by country. . . 140
4.6 Two dimensional matrices analysis (only two questions will be analysed to-gether). . . 142
4.7 Three dimensional matrices analysis (only three questions will be analysed together). . . 142
4.8 Four dimensional matrices analysis (only three questions will be analysed to-gether). . . 142
4.9 Frequency distribution of the questions regarding personal expertise and Chi-square test result for equality of group frequencies. . . 145
4.10 Frequency distribution summary for (Q6 to Q16). . . 147
4.11 Independent sample t-test for equality of two population group means of ”how often developers used software styles/patterns during their work” by devel-oper’s field of expertise. . . 151
4.12 Independent sample t-test for equality of two population group means of “how often developers used software styles/patterns during their work”. . . 155
4.13 Cross tabulation of three work sectors with software styles/patterns usage and consideration of quality attributes and Chi-square test of independence be-tween attributes. . . 157
4.14 Summary of the main significantanalysis results with associated tables (for better traceability) . . . 160
5.1 Section 1. Background Questions (Questions marked with (*) are mandatory). 166 5.2 Section 2. Software architecture utilisation questions. . . 167
5.3 Section 3. SA evaluation methods and tools. . . 169
5.4 Two dimensional matrices analysis (only two questions will be analysed to-gether). . . 174
5.7 Cross tabulation between respondents’ experiences and the main factors that DISCOURAGE the utilisation of modelling techniques to describe SA, (Q3 with Q7). . . 186 5.8 Frequency distribution of the multiple response questions/items, (Q6, Q7, Q13,
Q14) . . . 189 5.9 Pearson Chi-square test results between questions Q5 and Q6. . . 191 5.10 Pearson Chi-square test results between questions Q5 and Q7. . . 192 5.11 Independent samples t-test results between both statements for Equality of
Grouped Population Means corresponding to the categories (Yes or No). . . . 193 5.12 Pearson Chi-square test results for analyses of questions Q10 and Q13. . . 194 5.13 Summary of the main analysis results with associated tables (for better
trace-ability). . . 197 5.14 The Organisations Teams – preliminary phase . . . 203 5.15 General criteria for selecting field study environment. . . 204 5.16 Summary of the Preliminary Visit Findings. . . 204 5.17 Investigated Projects during the case study. . . 207 5.18 Field study findings. . . 208 6.1 BCK styles and QAs within RCS architecture. . . 219 6.2 Mellor[2009] styles and QAs within RCS architecture. . . 224 6.3 QAs trade-offs within RCS Styles. . . 230 6.4 Reliability/availability evaluation, methods, data, and the generic framework. 238 B.1 ADL design goals . . . 304 B.2 ADL characteristics . . . 304 B.3 The Most Known ADLs that still supported: the table contains also approaches
which are considered non-conventional ADLs, since they might neglecting fundamental aspects,AfterRech et al.2009, pp 267. . . 306 C.1 Database application revisions. . . 313 D.1 Two dimensional matrices analysis methods. . . 315 D.3 Cross tabulation of three work sectors with software styles/patterns usage and
consideration of quality attributes and Chi-square test of independence be-tween attributes. . . 317 D.2 Descriptive statistics and comparison of the population mean to a hypothesized
neutral value of (3), using t-tests for each of the statement with the general field of expertise regarding software development. . . 318 D.4 Descriptive statistics and test of the population mean to a hypothesized neutral
value at (3),using t-test for each of the statements with the sectors of work experience. . . 320 D.5 Percentage frequency table: Awareness of software style/patterns by developers.321 D.6 ANOVA-1, Analysis of Question 1/ Option 1 “Requirements
elicitation/mod-elling /analysis”, for Q17 to Q20 by Q2. . . 322 D.7 Cross tabulation Analyses for (Q2 and Q3 with Q4 and Q5). . . 323 D.8 Cross tabulation and test of independence between how often developers used
software style/patterns and whether the developers support standard documen-tation practices for software patterns. . . 325 D.9 Cross tabulation of how often developers used software style/patterns with the
D.10 Group descriptive statistics for each of the four statements in first column along with independent t-test results for testing difference between whether develop-ers frequently used (≥3) software style/patterns during their work or not (<3). 327 D.11 Cross tabulation of whether the relationship between the patterns and the
qual-ity attributes in those references been proved scientifically or otherwise with the main factors that discourage and encourage the utilisation of software pat-terns by developers and Chi-square test of independence between attributes. . 328 D.12 F statistic (p-value) from analysis of variance (ANOVA) for Q17-Q20 by the
sectors that developers gained most of their general software development ex-perience (Q2)? . . . 329 D.13 F statistic (p-value) from analysis of variance (ANOVA) for Q17-Q20 by the
developer’s total years of experience in the software development field (Q3). . 330 E.1 Summary of the questionnaire and each section objectives. . . 331 E.2 Descriptive statistics Q9 and Q10. . . 333 E.3 Equality of means between two groups corresponding to the respondents whose
general field of expertise regarding software development is “Architecture” and those have other expertise. . . 334 E.4 Equality of means between two groups corresponding to the respondents whose
general field of expertise regarding software development is “Project Manage-ment” and those who have expertise in other fields apart from this. . . 335 E.5 Equality of means between two groups corresponding to the respondents whose
general field of expertise regarding software development is “Design” and those who have expertise in other fields apart from this. . . 336 E.6 Equality of means between two groups corresponding to the respondents whose
general field of expertise regarding software development is “Architecture” and those who have expertise in other fields apart from this. . . 337 E.7 Equality of means between two groups corresponding to the respondents whose
general field of expertise regarding software development is “Coding” and those who have expertise in other fields apart from this. . . 337 E.8 Equality of means between two groups corresponding to the respondents whose
general field of expertise regarding software development is “Testing” and those who have expertise in other fields apart from this. . . 339 E.9 One way ANOVA table to test the difference between two variables of interest
for Q9 and Q10. . . 340 E.10 Multiple comparison test for the item in Q10, according to the the group means
for the three sectors in which developers gained their software development experience using LSD method. . . 341 E.11 Cross tabulation of the sectors that developer’s gained most of their general
software development experiences against selected categorical questions and corresponding results for Chi-square test of independence. . . 341 E.12 One way ANOVA analysis for the item “Most of the existing software
archi-tecture evaluation methods, produce qualitative results” corresponding to the categories of the respondent’s years of experience in total in the software/sys-tems development field. . . 343 E.13 Post hoc test (multiple comparisons) result using Tukey’s HSD test. . . 344 E.14 Independent sample t-test results between Q4 and the statements in (Q21 and
Q23). . . 346 E.15 ANOVA procedure for testing equality of group means for the selected item
scribe software/system architecture during their work. . . 349 E.18 Multiple comparison test results using LSD method. . . 349 E.19 ANOVA procedure for testing equality of group means for the selected item
corresponding to the categories of how often respondents used models to de-scribe software/system architecture during their work. . . 351 E.20 Multiple comparison test results using LSD method. . . 351 E.21 Independent sample t-test results for equality of two population group means of Likert scaled
items Q9, Q10 and Q15 to Q23 by the main factors that ENCOURAGE the utilization of mod-elling techniques to describe software/system architecture (Q6). Groups formed by the devel-opers who agreed with a Q6 item (Q6CB1 to Q6CB8) and develdevel-opers who didn’t agree with that item.. . . 353 E.22 Independent sample t-test results for equality of two population group means
of Likert scaled items Q9, Q10 and Q15 to Q23 by the main factors that DIS-COURAGE the utilization of modelling techniques to describe software/sys-tem architecture (Q7). Groups formed by the developers who agreed with a Q7 item (Q7CB1 to Q7CB5) and developers who didn’t agree with that item. . 354 E.23 Pearson Chi-square test results for analyses of questions Q10 and Q17. . . 354 E.24 Cross tabulation of “Usage of software style/pattern concepts & models
dur-ing architecture development, increases the utilisation of modelldur-ing descrip-tion languages, BUT decreases the simplicity of the architecture valuation” and “Most of the existing software architecture evaluation methods, produce qualitative results”. . . 355 E.25 Cross tabulation of the most important factors that couldSUPPORTquantitative evaluation for
any SA and the opinion about the statement “Current technology allows us to develop general software evaluation models that assess any software architecture against any quality attributes”. 355 E.26 Pearson Chi-square test results for analyses of questions Q13 and Q22. . . 356 E.27 Pearson Chi-square test results for analyses of questions Q10 and Q13. . . 356 E.28 Cross tabulation of respondent’s sectors in which respondents gained most of
their general software development experience and the main factors that en-courage the utilisation of modelling techniques to describe software/system architecture. . . 356 E.29 Pearson Chi-square test results for analyses of questions Q2 and Q6. . . 357 E.30 Cross tabulation of respondent’s sectors in which respondents gained most of
their general software development experience and the main factors that DIS-COURAGEthe utilisation of modelling techniques to describe software/system architecture. . . 358 E.31 Pearson Chi-square test results for analyses of questions Q2 and Q7. . . 359 E.32 Pearson Chi-square test results for analyses of questions Q2 and Q13. . . 359 E.33 Cross tabulation of sectors in which respondents gained most of their general
software development experience and the most important factors that could SUPPORTquantitative evaluation for any SA. . . 359 E.34 Cross tabulation of sectors in which respondents gained most of their general
software development experience and the most important factors that could HINDERquantitative evaluation for any Software Architecture (SA). . . 360 E.35 Pearson Chi-square test results for analyses of questions Q2 and Q14. . . 360 E.36 Pearson Chi-Square test results for testing association between years of
E.37 Cross tabulation of years of experiences of respondents in the software/systems development field and how often the respondents use models to describe soft-ware/system architecture during their work when the general field of expertise regarding software development is “Requirements elicitation/modelling/anal-ysis”. . . 361 E.38 Multiple Comparisons between Q2, Q22, when Q1= Project Management . . 362 E.39 One way ANOVA table to test the difference among group means for Q22, Q2,
when Q1= Project Management . . . 362 E.40 Cross tabulation Analyses for (Q2 and Q3 with Q4 and Q5). . . 363 E.41 Cross tabulation of sectors in which respondents gained most of their general
software development experience and whether respondents were aware of any system/software architectural tactics or metrics that have been or are being used for evaluating architecture description models (e.g. detecting attacks for security). . . 364 E.42 Pearson Chi-square test results for analyses of questions Q2 and Q11. . . 364 E.43 Pearson Chi-square test results for analyses of questions Q3 and Q5. . . 365 E.44 Cross tabulation of respondent’s years of experience in total in the
tems development field and how often they used models to describe software/sys-tem architecture during your work. . . 365 E.45 Pearson Chi-square test results for analyses of questions Q3 and Q7. . . 365 E.46 Independent samples t-test results for the selected items for equality of grouped
population means. . . 366 E.47 Cross tabulation of the developer’s years’ of experience in the software/system
development field against selected categorical questions and corresponding re-sults forχ2-test of independence. . . 367 E.48 Cross tabulation between the developer’s awareness regarding modelling
lan-guages and selected categorical questions. . . 369 E.49 Cross tabulation of how often developer’s used models to describe
software/sys-tem architecture during their work against selected categorical questions and corresponding results forχ2test of independence. . . 372 E.50 Cross tabulation of the developer’s general field of expertise regarding
soft-ware development against selected categorical questions and corresponding results forχ2 test of independence. . . 374 E.51 Independent sample t-test for equality of two population group means of
”de-veloping software/system architecture using current architectural frameworks increases the reliability, standardisation, and reusability of the resulting archi-tecture” by the main factors that ENCOURAGE the utilization of modelling techniques to describe software/system architecture. . . 375 E.52 Independent sample t-test for equality of two population group means of
”Us-age of software style/pattern concepts & models during architecture develop-ment, increases the utilisation of modeling description languages, BUT de-creases the simplicity of the architecture valuation” by the main factors that ENCOURAGE the utilization of modelling techniques to describe software/sys-tem architecture. . . 376 E.53 Summary table of χ2-test results for testing pairwise independence between
categorical variables. . . 378 E.54 nalysis of variance (ANOVA) results for Q9, Q10 and Q15 to Q23 by the single
response categorical variables. . . 379 E.55 Summary table of Chi-Square test results for testing pairwise independence
Abbreviations
Symbols
X
TUML eXecutable and Translatable UML
A
AADL Architecture Analysis & Design Language
ABAS Attribute-Based Architectural Styles
ACO Airspace Control Order
ADL Architecture Description Language
ADR Active Design Reviews
AHP Analytical Hierarchy Process
AI Artificial Intelligence
AIS Artificial Intelligence System
ALMA Architecture Level Modifiability Analysis
ALPSM Architecture Level Prediction of Software Maintenance
ANOVA Analysis of variance
ANU Australian National University
AOC Air Operations Centre
ARID Active Reviews for Intermediate Design
ATAM Architecture Tradeoff Analysis Method
ATO Air Tasking Order
B
BCK Bass, Clement, and Kazman
BG Behaviour Generation
C
C3 Command, Control, and Communication
C4I Command, Control, Communications, Computers, and Intelligence
CDG Component Dependency Graph
CMMI Capability Maturity Model Integration
COSMIC Common Software Measurement International Consortium
COTS Commercial off-the-shelf
CPU Central Processing Unit
CSM The Core Scenario Model
CSP Communication Sequential Processes
D
DB Database
DoD Department of Defence
DoDAF Department of Defence Architecture Framework
DSL Domain Specific Language
E
EMF Eclipse Modelling Framework
ERP Enterprise Resource Planning
ESAAMI SAAM by Integration in the domain
EX Executer
F
FSM Finite State Machine
G
GoF Gang of Four
GUI Graphical User Interface
I
ICM Intermediate Constructive Model
ICT Information and Communication Technology
IDEF0 Integrated DEFinition language 0
IEC International Electrotechnical Commission
IEEE Institute of Electrical and Electronics Engineers
IIS Internet Information Service
IM Implementation Model
ISO International Organisation for Standardisation
IT Information Technology
J
JA Job Assignor
K
KD Knowledge Database
L
LSD Least Significant Difference
LTM Long Term Memory
M
MAAADL MontiArc Automaton Architecture description language
MDA Model Driven Architecture
MDD Model Driven Development
MDE Modelling Development Engineering
MDSD Model Driven Software Development
MDT Model Development Tools
MODA Ministry of Defence and Aviation
MoDAF Ministry of Defence Architecture Framework
MVC Model View Controller
N
NIST National Institute of Standards and Technology
NML Neutral Messaging Language
NOC Number of Components
OCL Object Constraint Language
OMG Object Management Group
OO Object Oriented
OOD Object Oriented Development
OODA Observe, Orient, Decide and Act
ORM Object-Role Modelling
P
PAC Presentation-Abstraction-Control
PCM Palladio Component Model
PDP Policy Definition Point
PEP Policy Enforcement Point
PIM Platform-independent model
PL Planner
POSA Pattern-Oriented Software Architectures
PSM Platform-specific model
Q
QA Quality Attribute
QML Quality of Service Modelling Language
R
RAM Random Access Memory
RCS Real-time Control System
REST Representational State Transfer
RMA Rate Monotonic Analysis
RSADF Royal Saudi Air Defence Force
RUP Rational Unified Process
S
SAAM Software Architecture Analysis Method
SAAMCS SAAM founded on Complex Scenarios
SAAMER SAAM Evolution and Reusability
SACM Saudi Arabian Cultural Mission
SADL Semantic Application Design Language
SAE Software Architecture Evaluation
SAQEF Software Architecture Quantitative Evaluation Framework
SC Scheduler
SD Standard Deviation
SEI Software Engineering Institute
SNA Survivable Network Analysis
SOMF Service-Oriented Modelling Framework
SoS System-of-Systems
SP Software Pattern
SPE Software Performance Engineering
SPr Sensory Processing
SPSS Statistical Package for the Social Sciences
SQL Structured Query Language
STM Short Term Memory
SysAE System Architecture Evaluation
SysML System Modelling Language
T
TPR Thesis Proposal Review
U
UGV Unmanned Ground Vehicle
UI User Interface
UML Unified Modelling Language
VDM Vienna Development Method
VJ Value Judgement
W
WM World Model
X
xADL A Highly Extensible Architecture Description Language
Z
Preface
After 12 years of experience in software and systems engineering development, as an of-ficer in the military, this research has been initiated. Its main aim is to ensure that I come up with solutions or new findings, in order to make valuable improvements and contributions to the software and systems engineering domains, and to enhance the ‘Information Technology (IT)’ development process within my sponsor’s projects, the Ministry of Defence and Aviation (MODA).
My journey in regard to this research started two years before I registered for a PhD program at the ‘Australian National University (ANU)’, during my masters degrees at the same university, while I was learning new concepts, methods, and processes concerning SA domains. I also participated in the development processes of several projects and observed how SA was treated. I later revisited the causes for those projects’ successes and failures. An example is an integration project for different weapons(worth 96 million US-dollars), which was extended from 1 year-to-6 years and changed from a Fixed-Price contract into a Cost-Plus contract. I believe one of the reasons that cause such failures isignorance of its architecture development.
Therefore, when I started this research, I was determined to explore practices that could be applied to software-intensive projects in general, and its architecture in particular, to enable them to meet the requirements of different stakeholders.
I started by first holding the proposition that challenges possessed by the architecture are important key factors for project failure. Based on this proposition, I was able to dig deeply into the roots of SA, and SAE by going through various literature from different scholars. Particu-larly, I examined the description, modelling, documentation, evaluation methods, and QAs of SPs, SA.
Following this, I was able to come to a conclusion that improving (SPs, SA, and SAE) methodologies, descriptions, processes, and documentation should improve software and sys-tems engineering practices. In general, the development of software or syssys-tems engineering approaches are interdisciplinary in nature.
Thus, I performed an extensive study of SPs, how SA is currently described, modelled, utilised, and evaluated, as well as SAE methods and utilisation, within the current literature, and organisational development projects (small to large).
My inquisitiveness and investigation regarding the aforementioned issues made me realise that improvements in industry practices can be achieved through creating and utilising software and systems architecture in a proper fashion. These enhancements should benefit the overall outcome, as well as capability in the development of IT systems in general.
cycle. As a result, this study hasdiscoverednew findings, proposed new solutions, and enhanced existing performance models, which are reported here. Also, this work helps to set the roadmap for future research, by proposing new conceptual thoughts named ‘SysAE and SAQEF’ , which have emerged as a result of this overall effort.
Part
I
Chapter
1
Overview
Slowly, at every level, the arrangement of wholes becomes so dense that there are no gaps between the wholes: every part, and every part between two parts, is whole.
1.1
Introduction
The intention of this research is to improve Software Architecture (SA) descriptions and Software Architecture Evaluation (SAE) by exposing issues in their current approaches. Fulfill-ing the intention includes disambiguation of conflictFulfill-ing definitions and opinions concernFulfill-ing the documentation of Software Pattern (SP)s, their relationships with Quality Attribute (QA)s, and their effectiveness in determining SAs and their evaluation.
In this introductory chapter, I present an overview of the study that includes information to assist the reader to navigate this dissertation. I conclude this chapter with a summary of work published during this study and contributions made to engineering research and practice.
1.2
Initial motivation and research aim
In conducting the research reported in this thesis, an initial motivation was present already in the form of the following three interrelated statements:
Firstly, “ If we are to agree on what it means to document a software architecture, we should establish a common basis for what it is we’re documenting”,Bachmann et al.[2011, p3]. Sec-ondly, “Architecture assessments are essential for avoiding, identifying, or mitigating risks”, Mistrı́k et al.[2014, p11]. Thirdly, “Using a pattern or style means making successive design decisions that eventually result in an architecture”,Bachmann et al.[2011, p35].
The foundational theory behind this work (as expressed by many others includingQin et al. [2008],Bachmann et al.[2011], andBass et al.[2013]) is that SA, SAE, and SPs, are strongly related. Whilst the theory might hold, the various artefacts and practices that have been devel-oped over time (including their documentation processes) do not, which prevents the maximum utilisation of many of the existing achievements within SPs, SA, and SAE domains.
This (current) situation has led to an initial aim of finding ways to realize current issues regarding SA descriptions, SAE methods, and documentation of software patterns/styles1, in order to identify areas of improvement.
Preliminary research (reported in Chapter 2) shows that SA and software Styles/Patterns have a strong relationship and improving one will improve the other. It also explains that SAE is affected by several factors, such as SA description languages including SPs, the level of for-mality, documentation techniques, standardisation, and selected evaluation methods. After all: “Architectural evaluation of a software/system is crucial for its success”,Reussner et al.[2005]. In order to assess the architectural fitness of software systems, a number of evaluation meth-ods have been proposed, such as Architecture Tradeoff Analysis Method (ATAM) and Software
1
1.2. INITIAL MOTIVATION AND RESEARCH AIM
Architecture Analysis Method (SAAM), and Active Design Reviews (ADR). Most of the exist-ing methods are intended for evaluation of a sexist-ingle architecture at a certain point in time.
Furthermore, the results from using MANY/SOME methods are highly dependent on the person performing the evaluation and generally cannot be used to compare different architec-tures. Most of the current mature architecture evaluation methods, such as ATAM and SAAM use qualitative techniques that are typically applied through the use of scenarios. Consequently, the interpreted results depend heavily on the choice of scenarios to evaluate certain QA. The gen-eration of these scenarios is solely based on the vision and requirements of the stakeholder(s). The conflicts between stakeholders’ requirements raises a major challenge to software architects. This was noticed by Avison et al. [1999] and Baskerville et al. [2004] during their studies for ATAM and SAAM methods. The same challenge is confirmed byQin et al.[2008, p227-228], Bass et al.[2013, p401], andShreelekhya et al.[2016].
Moreover, SAAM has at least one pitfall in that it does not provide clear quality metrics for the architectural characteristics that are being analysed,Clements et al.[2002a]. In addition, the assessment of some properties requires experts. For example, evaluation of security is not usually easy, due to the lack of adequately qualified resources. Another major problem is that most of the evaluation methods are ad-hoc processes or minimally-automated and thus they are prone to error. Additionally, most of these methods, especially the semi-automated ones, are developed to evaluate one quality attribute, such as in the work done byMoreno et al.[2008] to analyse performance.
Further research, as reported in Chapter 2, shows that the SA qualitative evaluation methods received much more attention than quantitative evaluation methods, which renders the latter methods as more limited and in need of more research, and exhibiting less maturity.
In concluding this preliminary research, the necessity to go further in order to investigate SPs documentation and utilization, SA, and SAE methods, it was important to understand and discover the factors influencing SAE approaches.
Hence, based upon the preliminary study, questions have been formulated (as below) so as to promote understanding of the SA description and evaluation, and to develop a viable solution: 1. What effect do description languages, standardisation, evaluation methods, modelling
tech-niques and their documentation have on ‘SPs and SA’ utilisation and evaluation?
2. How can ‘SPs and SA’ utilisation and evaluation be improved, including minimising the effects of any hindrances?
Thus, the aim of this research is to investigate the SA and SAE domains through liter-ature review, questionnaires, field study, and analyses. As a result, issues and/or links between different disciplines, such as SPs, modelling languages, and SA description and evaluation techniques, were presented, in order to resolve identified issues, bridge the gaps, and overcome the limitations of SAE current methods.
1.2.1
Contributing Factors to the Problem Domain of this Thesis
The following points list the main factors that make this research worthwhile:
1. Lack of architectural evaluation approaches that apply standard languages and that are fully automated.
2. The absence of well-known, wide-spread standardized languages and tools in current ar-chitectural evaluation studies.
3. There are no/few robust architectural evaluation models that can help architects and de-velopers to check their architecture against intended and required ‘qualities’ with no need for experts.
4. There is no existence of a facility (such as a database, repository, or thesaurus etc.) that demonstrates the relationships between SPs and QAs based on reliable references. 5. There seems to be a dearth of experts on evaluation methods at an architectural level.
1.3
Methodology and Research Design
In this section, the ’best fit’ research methods, activities, and life cycle are described, ac-cording to aims and context.
1.3.1
Research Method
Software engineering research methods were classified byAdrion[1993], as follows: 1. “Scientific Method: observe the world; propose a model or theory of behaviour; measure
and analyse; validate hypothesis of the model or theory; and if possible repeat.
2. Engineering Method (evolutionary paradigm): observe existing solutions; propose better solutions; build or develop; measure and analyse; then repeat until no further improve-ments are possible.
3. Empirical Method (revolutionary paradigm): propose a model; develop statistical or other methods; apply to case studies; measure and analyse; validate the model; then repeat. 4. Analytical Method: propose a formal theory or set of axioms; develop a theory; derive
1.3. METHODOLOGY AND RESEARCH DESIGN
The Engineering Method is the best fit for achieving the thesis aim. In fact the research started by observing the existing approaches that describe and evaluate SA, SAE methods, and SPs, using several observation methods, such as analysing the current solutions, surveys, and field study. Demonstration of the relationship between SPs and QAs was achieved with the development of a database that contains the required information. A critique of a reference architectural model has been carried out in Chapter 6 in order to provide evidence of the strong relationship between SPs, SA, and QAs. The engineering method is the best approximation to the research activities applied in this thesis, and will continue to be used during the compilation of recommended future work until no further improvements are possible. The latter will hopefully be fulfilled via the link between this thesis aim and suggested future work as its extension.
1.3.2
Research Activities
“Research activities are sets of tasks that may be carried out to implement part of a research approach”,Flint[2006].
According to a proposed model byGlass[1995], the four general computing research phases are:
1. “The Informational Phase: gathering or aggregating informationviareflection, literature survey, people/organisational survey, or poll (e.g. Delphi approaches).
2. The Propositional Phase: proposing and/or formulating a hypothesis, method or algorithm, model, theory, or solution.
3. The Analytical Phase: analysing and exploring a proposition, leading to a demonstration and/or formulation of a principle or theory.
4. The Evaluative Phase: evaluating a proposition or analytic finding by means of experimen-tation (controlled) or observation (uncontrolled, such as a case study or protocol analysis), perhaps leading to a substantiated model, principle, or theory”.
Each one of these phases could have one or many activities. This thesis includes all the activities above as explained in Section 1.4.
The adaptation and sequencing ofGlass[1995] model is varies from research to research, based on the need and the research life cycles,Flint[2006].
Important point has been considered during the research activities:
• Confidentiality of the data and results
The field study included in Chapter 5 and associated appendix, involved military sites, and hence there shall be the need for retaining some sensitive information.
1.3.3
Research Life Cycle
Every project should have certain phases that form a cycle, in order to plan, develop, man-age, and evaluate a successful outcome, which is known as the project life cycle,Kerzner[2013]. In order to successfully perform the research activities described in Section 1.3.2, using the research method explained in Section 1.3.1, the life cycle of the research becoming more clearer and understandable.
There are several life cycle approaches that explain different ways in which researchers can perform their research; however listing and explaining these methods are out the scope of this thesis. However,Flint [2006] explains some of these approaches in his thesis, especially the ones related to software engineering domain.
In this research, I employed the first phase of the ‘Research-then-Transfer’ life cycle, described byPotts[1993]. This approach starts with motivation and initial objectives to utilise a method or technology to resolve an existing industrial problem, then the research continues with slight or no involvement with industry. When the research is considered ‘ready for transfer’, it is presented to industry,Flint[2006]. This research problem related to industry and academic fields. Thus, there is slight involvement with industry organisations in different aspects of the research through the surveys and the field study. This research concept is a continuous effort that could be evolved even after the thesis is done. So, when the framework and models that are proposed by this study are fully developed, then they will be transferred to the industry.
1.4
Thesis Scope and Structure
The scope of this research lies within the context of software engineering to improve SA and its evaluation techniques. While the current deficiencies in SA descriptions and SAE mech-anisms are discussed, the development and evaluation of a completely new SAE framework within a more general context is beyond the scope of this thesis.
Using the operational view of the Department of Defence Architecture Framework (DoDAF), the structure of this thesis is depicted in a System Modelling Language (SysML) activity dia-gram; Object Management Group (OMG),Weilkiens[2007, p257–264], as shown in Figure 1.1. The vertical swim-lanes (partitions) of the activity diagram in Figure 1.1, show how this thesis has been organised into three parts, each part comprising two or more chapters. The rounded boxes are the research activities that represent the chapters of this thesis, and the directional ar-rows between the boxes represent the flow of ideas, inputs, and outputs. The commented green boxes represent key contributions made by the research and the output of each activity.
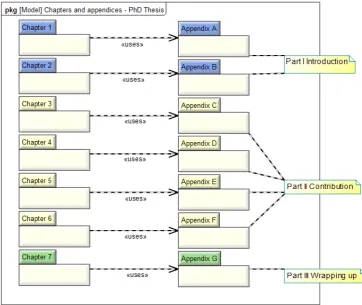
The dependency relationships between chapters and appendices are illustrated in the pack-age diagram in Figure 1.2.
1.4. THESIS SCOPE AND STRUCTURE
Typographical and other conventions
Within the structure of this Thesis, there are several emphasising styles being used as follows:
• Each key concept is described in a separate section.
• Within the text of this Thesis, the names of key concepts, important words, phrases, or sentences are printed in italic font and/or bold font.
• Some of the most important paragraphs include comments, findings, summaries of sections, and key concepts are placed on a grey box such as this.
1.4. THESIS SCOPE AND STRUCTURE
Figure 1.2: Dependency relationships between chapters and appendices: Package Diagram.
1.4.1
Introduction (PART I)
The first part (PART I) of the thesis comprises two chapters and two associated appendices (A and B):
In Chapter 1, I outline the motivation, aims, scope, and structure of the research.
A literature review is reported and discussed in Chapter 2. The findings of the analysis are reported in three main areas: i) SA descriptions and formality level, ii) model driven methods of SA in architectural context, and iii) SAE. Also, this preliminary research explores the potential “forces” that have an effect on softwarestyle/patterndescriptions, modelling techniques, and standardisation. A comparison between existing software architecture evaluation methods and categorizations of quality characteristics has been investigated, analysed and reported. This background study of the current state-of-the-art highlighted challenges and gaps within SA and SAE.
1.4.2
Contribution (PART II)
six reliable software pattern resources in the context of their relations to quality characteristics. The study findings are stored in a database. Issues raised from the analysis are illustrated and discussed.
The results of a questionnaire-based survey are in Chapter 4 and associated Appendix D . These relate to tSPs utilisation factors. The survey was undertaken in order to support and enhance, or otherwise, an understanding of the value of Chapter 3 outcomes, and to identify any issues related to the usability of SPs amongst software engineers and developers.
Illustration of the challenging factors that have an effect on software architecture modelling and evaluation techniques are captured through a second survey questionnaire and a field study, with the results reported in Chapter 5 and associated Appendix E.
Both questionnaires in Chapter 4 and 5 were distributed to software developers within six countries. The degree of experience in software engineering of each participants varied sig-nificantly, but no participant had less than 5 years experience. Whereas, the field study was conducted in a military site during the development of many large-scale systems by several in-ternational companies, which means that these large scale Information Technology (IT) projects joined highly experienced people from both industrial and military domains.
In Chapter 6 and associated Appendix F, I provide a case study through an exploration and critique of an architecture reference model called “Real-time Control System (RCS)”. In this chapter, I demonstrate the robust relations between SA, SPs, and QAs. I also explain how they are bound together and affect each other through a well-known architecture utilised in industry. Furthermore, this chapter introduces an evaluation concept for SA, including an example to explain how the model works.
1.4.3
Wrapping up (PART III)
The third part (PART III) of the thesis is formed by one chapter, Chapter 7 titled “Discussion and Conclusion”. In Chapter 7 and associated Appendix G, I present a summary of the research work and its limitations, together with my conclusion and suggestions for further research.
In the future work section, I propose twoinitial concepts: first is System Architecture Eval-uation – SysAE profile, to evaluate both hardware and software architectures. The second con-cept is an evaluation framework and model named SAQEF, for evaluating software architecture quantitatively. Although the rationale and justification of both concepts are briefly described in Appendix G, I have included these two concepts in the future work section, as they need more research and development to fully prove their applicability in the problem domain.

![Figure 2.7: AADL abstraction and key specification elements, after Feiler et al. [2006].](https://thumb-us.123doks.com/thumbv2/123dok_us/8211932.263390/75.595.119.444.82.323/figure-aadl-abstraction-key-specification-elements-feiler-et.webp)
![Figure 2.8: Main differences between modelling approaches, after Cabot [2014].](https://thumb-us.123doks.com/thumbv2/123dok_us/8211932.263390/78.595.164.433.90.353/figure-main-differences-modelling-approaches-cabot.webp)