Ames Laboratory ISC Technical Reports Ames Laboratory
8-1950
Determination of trace quantities of iron in
zirconium and its compounds
Augustus Sidney Ayers
Iowa State CollegeCharles V. Banks
Iowa State CollegeFollow this and additional works at:http://lib.dr.iastate.edu/ameslab_iscreports
This Report is brought to you for free and open access by the Ames Laboratory at Iowa State University Digital Repository. It has been accepted for inclusion in Ames Laboratory ISC Technical Reports by an authorized administrator of Iowa State University Digital Repository. For more information, please [email protected].
Recommended Citation
Ayers, Augustus Sidney and Banks, Charles V., "Determination of trace quantities of iron in zirconium and its compounds" (1950). Ames Laboratory ISC Technical Reports. 20.
Determination of trace quantities of iron in zirconium and its compounds
Abstract
The literature on the determination of small amounts of iron has been surveyed. The more commonly used reagents for the colorimetric determination of iron have been discussed and references to the more important papers have been included.
Keywords Ames Laboratory
l
!o
WeA-se.
t+L
:rsc.-15)..
• r -· • '· ~~
.
"--'
.:.)....
UNITED STATES ATOMIC ENERGY COMMISSION
ISC-152
DETERMINATION OF TRACE QUANTITIES OF IRON IN ZIRCONIUM AND ITS COMPOUNDS
By
Augustus Sidney Ayers Charles V. Banks
August 1950
Ames Laboratory
jl
CHEMISTRY
Reproduced direct from copy as submitted to this office.
PRINTEDINUSA PRICE 25 CENTS Available from the Office of Technical Services
Department of Commerce Washington 25, D. C.
Work performed under Contract No. W-7405-eng-82.
..
DET~tMINATION OF TRACE QUANTITIES OF IRON IN ZIRCONIUM AND ITS COMPOUNDS-::·
by Augustus Sidney Ayers and Charles Vo Banks ABSTRACT
lo The literature on the determination of small amounts of iron has been surveyedo The more commonly used reagents for the colorimetric determination of iron have been discussed and references to the more important papers have been includedo
2o· The applicability of the lj) lO=phenanthroline method to the estimation of the iron content of zirconium=bearing materials has been investigated using tartrate and citrate
to prevent precipitation of hydrous zirconium oxides in neu-tral solutionso The use of tartrate has been found to permit the analysis of various zirconium material~ with admirable precision in the absence of such contaminants as zinc and nickelo
3o The sulfosalicylate method has been found to be applicable to zirconium compounds even in the presence of zinc and nickel impuritieso The large blank due to iron in the sulfosalicylic acid reagent has limited the sulfosalicyl~ a.te method to samples high in iron contento
4o Recomme'nded procedures for the analysis for iron in zirconium metal and some of its compounds have been in -cludedo
INTRODUCTION
.
Historical and Occurrence
Zirconium is the fifth element in the fourth group of the periodic table9 i t has a normal valency of four9 the atomic number is forty 'and its atomic weight is 9lo22o The metal is not found free in nature but zirconium is widely
=4
=
are rare9 the element ranks nineteenth in relative abundance.
Zirconium was discovered by Klaproth in 1789 and the metal was first prepared by Berzelius in 1824o Most of the present world supply comes from Brazil and the commercial uses have been limited to the production of Nernst filaments~ Welsbach mantles and/ various refractory products o Recently the metal has found some use as a "getter" of gases in the manufacture
of vacuum tubeso
Chemical Properties of Zirconium
The chemistry of zirconium is not as well known as that of many other metals and this may be attributed to the relative scarcity of the ores~ the lack of widespread industrial uses and the inertness of zirconium compounds to chemical attack by the more common laboratory reagentso The metal resists all acids but hydrofluoric and reacts readily at elevated temperatures with oxygen~ nitrogen and hydrogeno Zirconium dioxide is one of the more refractory oxides with a melting point above 2700°Co; i t is likewise insoluble in all acids ex-cept hydrofluarico In aqueous solution the zirconyl ion is the mast common form but more complex ions have been repartedo
The addition of alkali or ammonium hydroxide to solutions containing the zirconyl ion causes the precipitation of a white9 gelatinous hydrous oxideo The presence of hydroxy
organic acids such as tartaric» citric or salicylic acid pre= vents this precipitation even at high pH; fluoride and oxalate have a similar effecto In these complexes the zirconium is present in the aniono The chemical reactions of zirconium are in genera quite similar to those of thorium and parallel closely those of iron and aluminumo
Statement of the Problem
Naturally occurring zirconium is associated with hafnium as well as iron9 titanium, silicon~ thorium~ rare earths9 calcium, columbium9 tantalum and manganese o Since there has
been no demand for large quantities of highly purified zircon= ium products9 methods for the analysis of traces of impurities
in zirconium and its compounds have not been developed9 tested
and assembled for ready reference of the analysto The purpose of this work is to serve not only as a guide to the literature pertinent to the subject~ but also as a compilation of recom~ mended procedures for the semi-routine analysis of zirconium metal and the compounds used in its preparationo
l
"
•
REVIffi~
OF THE LITERATURE
The Spectrophotometric Determination of Iron in the Presence of Zirconium
14 10-Phenanthroline method
The highly colored product of the reaction of ferrous iron with 1,10-phenanthroline described. by'~~ster"and his co-workers (1) has been used as an oxidation-reduction indicator with a high oxidation potential by many authors includin$ Walden9 Hammet and Chapman (2). Saywe11 and Cunningham
{3)
applied this color thus formed to the estimation of the iron content of ashed wines by colorimetric comparisons and Hammel and Willard (4} similarly analyzed feces and foods. The appli-cation of the spectrophotometer and the effects of various ions was investigated by Fortune and Mellon
(5)
and zirconium in excess of50
ppm was found to interfere. This reagent has also been utilized by Moss and Mellon(6)
for the estimation of small amounts of copper by removing iron and other metals precipitated by ammonium hydroxide. The effects of the order of addition of reagentsy temperature of the solution~ length of standing and amount of phosphate pr•esent have been inves-tigated by Bandemer and Schaible(7).
The method has been applied to the analysis of red phos-phorus for iron by Brabson and Schaeffer
(8)
and to thedetermination of iron impurities in sands used for glass manufacture by Diamond(9). The procedure of analysis has
been refined by Borel (10) so that as little as 0.05 micro-gram of iron may be determined and Ryan and Botham (11) have worked out the conditions for the estimation of iron in various aluminum alloys including a technique for the elimination of the deleterious effect of zinc.
The reagent has been proposed by Cowling and Benne (12) as a replacement for thiocyanate as the official method of analysis for small quantities of iron. 5-Nitro-1, 10-phenan-throline has been used in a similar fashion to determine iron but Mehlig and Hulett (13) showed i t has'no advantages to
justify the use of this more expensive reagent and 1,10-phenan-throline is the reagent preferred by Moss~ Mellon and Smith(l4). Theil9 Heinrich and van Hengel (15) compared
1,10-Phenan-throline and ~~~~-bipyridyl as reagents for the colorimetric determi nation of iron and found that the o:~ocv=bipyridyl was no more desirable than the less costly 1910-phenanthroline and
bi-
~6-pyridyl procedureso
The stability of ferrous~tris-(l,lO=phenanthroline) ion,
11ferroin11 was studied by Lang(l7) and Lee1 Kalthoff and
Leussing (18) determined the dissociation constants for the ferrous and ferric complexes with the reagento These same authors did further work on the reactions of iron with the reagent (19) and applied the method to the determination of phenanthroline (20).
Thiocyanate method
The red color.ation produced by the reaction of ferric iron with thioc-yanate in acidic medium has been used as a test for either ion9 Thompson (21) in 1895 described the test for iron using ammonium thiocyanate as the reagento The structure of the red body is claimed by Bailey (22) to be Fe(CNS)3 when
an excess of thiocyanate is present in the solutiono Schlesinger and Van Valk~nburgh (23) believed that the red color was due
to Fe(CNS) 6- j and that i t existed as a dimer in solutions of benzene or ether. Brintzingar and Ratanarat (24} investigated the composition of several thiocyanate complexes including those of ferrous~ ferric~ aluminum~ eerie and thorium ionso By conductance measurements Mo~er (25) found no evidence for
the Fe(CNS)e=3 formula proposed qySchlesinger and VanValkenburgh and decided that the coloration was due to Fe(CNS) 3 • Bent and
French (26) found evidence that the red tint is due to Fe(CNS)+2 instead of the previously proposed structures and they investigated the effects of iron and thiocyanate concentrations upon the
intensity of the color developed at constant pHo
Konig (27) adapted the test to give an estimation of the iron content of a solution and von Eck (28) determined the effects of time~ acid concentration and reagent concentration on the intensity of the color. Willstatter (29} modified Konig1s procedure to increase the sensitivity of the test by
increasing the reagent concentrationo Thiocyanate is recom-mended by Walker (30) as a reagent for iron in preference to ferrocyanide except when silver9 mercury~ cobalt or phosphate
=7=
comparison of samples instead of the Dubosq. colorimetero Ampt (35) worked with zircon and other zirconium-bearing materials and analyzed them for iron by the thiocyanate pro-cedure; he states that sulfate must be absent to obtain
proper resultso Since the color reaction is hypothesized to take place only with ferric iron~ Bertiaux (36) used an excess of hydrogen peroxide to ensure the oxidation of the iron;
this reagent also tends to increase the stability of the coloro Peters, MacMasters and French (37) found that excessive amounts of hydrogen peroxide used in the Bertiaux modification inter-fere by forming a yellow color~ but that this effect could be easily eliminatedo Shokhkeldian and Shkitov (38) investigated some of the interferences in the determination of iron by
the thiocyanate methode
.
Klinger~ Stengel and Wirtz (39) applied the thiocyanate method to the analysis of tantalum by separating the iron from the tantalum by a hydrogen sulfide precipitation followed by thiocyanate estimationo Lindsey (40) used the thiocyanate procedure to analyze sands used in the manufacture of glass and the reaction has been applied to the analysis of zinc-aluminum base alloys by Bischof and Guer (4l)o
Van Urk utilized the solubility of the red complex in ether and amyl alcohol to separate i t from interfering ions
(42) and found that sodium sulfate limited the sensitivity of the reaction much more than either hydrochloric or nitric acids (~_3) o Van der Vlugt (44) found similar results to van Urk and modified the method further by using peroxydi~ sulfate to ensure oxidation of the iron to the trivalent stateo The stability of the color when extracted with ethylene glycol monobutyl ether is greater t~an when other solvents are used9 and Bernhard and Drekter (45) claim the
added advantage of less odor and evaporation than when using amyl alcoholo Another attempt to stabilize the color of ferric thiocyanate was the use of ether partially saturated with sulfur dioxide to extract the color as reported by
Steinhauser and Ginsberg (46) o Peters and French (47) found that the optimum pH for color development is 2o09 that the
color intensity depends upon the concentration of reagent with no apparent maximum reached as the thiocyanate concen-tration is increased and that tha distribution coefficient of the colored complex between aqueous and organic phases is also dependent upon the reagent concentrationo
the experimental conditionso However Vanossi (49) used
zirconyl ion to eliminate the detrimental effects of phosphate and fluoride ions when extracting the thiocyanate complex
with ethyl acetate. Winsor (50) found that 2-methoxyethanol increases the intensity of the color more than does acetone~
has a lower vapor pressure and therefore less evaporation
and that the color is more stable in 2=methoxyethanol solutions than in aqueous solutionso Roberts, Beardsley and Taylor (51) recommended iso-amyl alcohol as an extracting agent for the coloro A good revi.ew of this field may be found in Sandell~s
book on colorimetry (52) o
Thioglycollic Acid method
Ferric salts were found by Weinlang and Loebich (53) to react with thiogylcollic acid to produce a red coloration in neutral or alkaline solutiono Lyons (54) investigated the test and found that the color reaction was actually due to reduction of iron to the ferrous state by the reagent followed by further reaction of the divalent iron with the substituted acetic acido The transient blue coloration observed by
Lyons was found by Mayr and Gebauer
(55)
to be the unstable ferric thioglycollate~ auto-reduction bf the iron ta~es place producing an intense red complex containing both ferrous and ferric iron~ presumed by these authors to be KFeiFe(SCH2C02l7o The effects of reagent concentration$ interfering ions and pH were determined by Swank and Mellon (56)9 they do not list zirconium as an interfering element but presumably i t would be undesirable due to its insolubility at the higher pH. Dubsky (57) also worked on the reactions of thioglycollicacid with iron and Taylor~Austin (58) developed a colorimetric method for metallurgical analysis for iron using the Lovibond
tintometero The spectrophotometric determination of iron was applied to biological specimens by Koenig and Johnson (59) and comparison of the thioglycollate method with the thio
-cyanate method by Van Dam (60) showed that the latter is preferred i f the time factor is controlled since aluminum does not interfere in the thiocyanate methodo
Other methods
Blau (61} in 1898 reported that the reaction of x~oc'-bi pyridyl with divalent iron gave rise to an intense red hueo The pH range applicable for the colorimetric estimation of iron using this reagent with sodium dithionite as reductant for any ferric. iron was investigated by Hill ( 62) o Aluminum, manganese and zinc were found by Feigl~ Krumholz and Hamburg
(63) to effect the results of the determination of iron by
c~lorimetric comparison using this reagent. Schulek and
•
=9=
analysis of drugs and organic materials9 these same authors
(65)
reported that more rapid color development was obtained when using ascorbic acid as the reductant than if sulfur diox~ide was employed. The procedure utilizing (Xj)OC1 -bipyridyl has been recommended by Koenig and Johnson
(66)
for the estimation of the iron content of foods and biological materials but9according to Buch
(67),
as many as twenty-four hours may berequired for complete color development when using hydrazine or thiosulfate as reducing agents. Jaeger and van Dijk
(68)
determined the compositions of the three complexes formed by iron and ~ex:' -bipyridyl and Scharrer (
69)
compared thethiocyanate and Q,~1=bipyridyl methods and found that the latter showed fewer interferences and as good a sensitivity as the
former method. A comparison with the sulfosalicylic acid and "ferron" methods by Thiel and van Hengel (70) also showed that the ~,~1 -bipyridyl procedure was preferable in most cases. The use of the spectrophotometer to determine the effects of
diverse ions was reported by Moss and Mellon (71) and their work shows that this reagent has no great advantage over the
less expensive l9lO~phenanthroline.
Lorber (72) found that the yellow color of both oxidation
states of iron with sulfosalicylic acid in ammoniacal solu=
tion could be used for the estimation of iron9 Korenman
(73)
used similar conditions to those of Lorber for the colorimetriccomparison of iron samples and Beck
(74)
found that more thaneight per cent alcohol in the solution reduced the intensity of the color formed when using the reaction to determine sulfo~
salicylic acid by adding an excess of iron. By introducing a large excess of the reagent Rosanov~ Markova and Fedotova
(75)
were able to determine iron in the presence of moderateamounts of phosphoric acid and also found that aluminum did not interfere in their determinations. Deitrich and Schmitt
(76)
buffered their solutions with ammonium chloride~ addedthe reagent and observed the transmittancies of
495,
510
and530
m~ to determine their iron content. The reaction in acidic medium producing a reddish tint is said by Alten9Weiland and Hille
(77)
to be almost as sensitive as the thio= cyanate test. Alimarin and Frid(78)
used ammoniacalsolu-tions for their color development followed by visual comparison and found that in the presence of aluminum or magnesium larger
excesses of sulfosalicylic acid reagent were required for complete development. of the color c Kennard and ,Johnson ( 79) reported that the wavelength of maximum absorption of light
by the iron=sulfosalicylic acid complex shifts with a varia= ti on of pH; maxima are found at
500
~ ~-60 and420
mp
withpH
1.5,
5.0
and 8.2 respectively. The absorption at pH8.2
estima-tion of small amounts of iron by visual comparison was re= ported by Kuzenetzov (80) using a mixture of urotropine and sulfosalicylic acida
The reaction of 7=iodo=8~hydroxyquinoline~5-sulfonic acid ("ferron") with trivalent iron produces a bluish-green
color destroyed by high or low pH according to Yoe (81).
Yoe and Hall (82) found that salts that hydrolyze readily
interfere in this reaction and the system does not obey
Beer9s lawa The dependency of the intensity of the color of
iron with ''ferron" upon the acidity of the solution is very marked according to Swank and Mellon (83), and a range from pH 2.0 to 3.0 is permissible but the pH should be maintained +0a2 for comparison between any samples in the same serieso This same reagent has been used by Melland (84) to determine both iron and metavanadates and in the spectrophotometric determination of iron with 11ferron11 9 zirconium was one of
the many elements found by Davenport (85) to interfereo
2=Hydroxymethyl-5-hydroxy=o-pyrone (kojic acid) produces a yellow color with ferric iron and may be used for the color-imetric estimation of iron but zirconium was found by Moss
and Mellon (86) to interfere when present in excess of one per cent of the iron concentration. Mehlig and Shepherd (87) used this same reagent for the analysis of macro amounts of iron in ores spectrophotometrically ~t a pH of 6a4
±
OaloSalicylic acid has been found by Sagiadachnail and Rarich
(88) to react with iron yielding a violet color with a maximum intensity at a pH of 2.0a Both the di- and trivalent iron .
ions give the same color. Scott (89) investigated the effects of some foreign ions. By using Nessler tubes for the matching of the colorp Agnew (90) developed the procedure to determine as little as 20 micrograms of iron in a volume of 50 milli-liters. The method can also be used for the rapid analysis of samples of ore containing as much as 60 per cent iron in a sample of 0.2 gram as shown by Mehlig (9l)a Zirconium has been found to interfere markedly in the spectrophotometric
estimation of iron with salicylic acid at a pH of 2.6: this optimum pH is a critical factor as explained by Mehlig (92).
A multitude of other reagents have been used for the colorimetric estimation of small amounts of ir'on9 but these
methods have not found as wide an application as the
preced-ing techniquesa The effect of zirconium has not been reported in most of the following methods: oximes (93), (941 9 (95),
(96) 9 (97) and (98)JI nitroso R salt (99)~ (100) and (101),
8-hydroxyquinoline and its derivatives (102)p (103) 9 . (104)
-11-and (107), hydrochloric acid (108) 9 sodium sulfide (109),
(110) and (111), potassium ferrocyanide (112) 9 (113) and
(114) 9 quinaldinic acid (115)~ resorcylaldoxime (116),
phenan-thraquinone (117) 9 pyrocatechuic acid (118) 9 sodium
pyro-catechol disulfonate (119)~ para-aminophenol (120) 9 ortho=
nitrosophenol (121), purpuric acid and violuric acid (122) 9
pyramidone (123) 9 alloxantine (124) 9 sodium alizarin sulfonate
(125) 9 2-nitroso-1-naphthol (126), meta~bromophenol (127),
pyrogallol (128), hematoxylin (129) and potassium iodide (130).
EXPERIMENTAL
Apparatus
Spectrophotometer: A. Beckman quartz spectrophotometer,
Model DU~ was used in the determination of all the absorbancy
values reported in this paper, The instrument was equipped
with a standard tungsten light source and one centimeter
Corex glass cuvetteso
pH meterg A Beckman Model H-2 pH meter was used to
determine the pH of the solutions used in this investigation.
The instrument was operated from a power line stabilized with
a Sorenson Model 2000 voltage regulator and the instrument
was calibrated with standard buffers prior to use each day.
Reagents and Solutions
Ammonium tartrate: A 25 per cent solution was prepared
by dissolving 250 grams of diammonium tartrate9 (NH4 } 2C4H406 ,
CP. (Fisher Scientific Company) in distilled water,
filter-ing to remove suspended material and diluting to a volume of
one liter with distilled water.
1,10-Phenanthroline: A 0.1 per cent solution was
pre-pared by dissuJving
0.55
grams of 1910-phenanthrolinemono-hydrate9 C12H8N2 .H20v (G. Frederick Smith Chemical Company)
in warm distilled water and diluting to a final volume of
500
ml with distilled water.Hydroxylamine hydrochloride~ A 10 per cent solution was
prepared by dissolving 25 ~rams of reagent grade hydroxylamine
hydrochloride, NH20H.HC19 (Paragon Division, Matheson Chemical
Company) in distilled water and diluting to a final volume of
=12=
Standard iron sulfate: A 100 parts per million solution was prepared by dissolving lOOoO milligrams of iron wire
(Baker and Adamson Division of General Chemical Company) 9 for
standardization9 in 33 mlo 6N sulfuric acid and diluting the resulting iron sulfate solution to one liter with distilled water~ For use in the subsequently reported research, ali-quots of this standard solution were diluted by a factor of ten with 0.1 N sulfuric acid to yield a solution containing 10.0 micrograms of iron per millilitero
funmonium hydroxide~ A 14 pel~ cent solution was prepared by adding concentrated reagent grade ammonium hydroxidei
NH40H9 (Mallinckrodt Chemical Works) to an equal volume of distilled watero
Ammonium citrate: A 33 per cent solution was prepared by dissolving 330 grams of diammonium citrate~ (NH4)2HC6H507~ CPo (Fisher Scientific Company) in distilled water9 filterlng to remove .suspended material and diluting to a final volume of one liter with distilled watero
Nickel nitrate: A 200 parts per million solution of
nickel was prepared by dissolving 0.991 grams of nickel nitrate hexahydrate~ Ni(N03 ) 2 o6H209 special (Baker1s Analyzed) in a
small volume of distilled water~ adding 3o0 mlo concentrated reagent grade nitric acid and diluting to a final volume of one liter with distilled watero
Titanium sulfate: A 200 parts per million solution of titanium was prepared by fuming lo546 grams of potassium
titanyl oxalate dihydrate9 K2TiO{C204 ) 2 o2H20» (special
prep-aration) with 2o0 mlo concentrated reagent grade sulfuric
acid~ dissolving in water and diluting to a final volume of one liter with distilled watero
Zinc sulfate~ A 200 parts per million solution of zinc was prepared by dissolving 200 milligrams of zinc metal
(Bunker Hill slab zinc) in lo6 mlo concentrated sulfuric acid and fi~ty mlo of distilled water~ heating to facilitate
com-plete dissolution and diluting to a final volume of one litero
Hydrofluoric acid: A
4
o
8
per cent solution was preparedby adding 30 mlo concentrated reagent grade hydrofluoric acid
to 270 mlo distilled water and mixing wello
Zirconium test solution: In testing to determine whether zirconium interferes in the analysis for iron by various
methods~ i t is desirable to huve a source of a solubl e zirconium compound relatively free from trace amounts .of irono The
available at this laboratory at the onset of this research
were reagent grade zirconyl nitrate dihydrate, ZrO(N03 ) 2 .2H209
(Fisher Scientific Company) and anhydrous zirconium
tetra-chloride9 ZrC14~ (Titanium Alloys and Metals Company). Both
of these substances contain appreciable quantities of iron
so9 if either were to be used for recovery experiments9 its
purification would be necessaryo Since it has been shown
previously
(49)
that ferric iron may be extracted from aqueousthiocyanate solutions with organic solvents~ nitric acid
solutions of the reagent grade zirconyl nitrate containing
ammonium thiocyanate were extracted with diethyl ether and
a mixture of diethyl ether and amyl alcohol. Analysis of the
aqueous solutions~ by the methods shown later in this work
to be accurateJ indicated that i t was possible to reduce the
iron content to the equivalent of 70 parts per million in
zirconium dioxide which corresponds to a reduction to 20 per
cent of the original iron content. It may be of interest
to note here that apparently zirconium itself is also
ex-tracted into the organic phase from an aqueous thiocyanate
solution by the ether-amyl alcohol mixture. Another standard
method for the separation of iron is the removal of iron
from alkaline solutions by recipitation with hydrogen sulfide.
In the conventional grouping of metals~ zirconium and iron
both fall in the category known as "Group Three119 i.e.v
metals precipitated by alkaline hydrogen sulfideo Zirconium
is known to form soluble complexas in alkaline solutions of
organic hydroxy acids, so i t seemed logical to try the pre=
cipi tation of ferrous sulfide fr•om ammoniacal zirconium
tartrate solutions. By adding tartaric acid to zirconyl
nitrate solutions~ adjusting the pH to
8
to9
with ammoniumhydroxide and passing in hydrogen sulfide9 i t was possible
to produce zirconyl nitrate-ammonium tartrate solutions
con-taining as low as 20 parts of iron per million parts of
zir-conium dioxide. However~ any further treatment of the
solu-tion to change i t from a tartrate-containing material such
as a nitric~sulfuric acid digestion only served to increase
the iron content so the process did not seem suitable for
the preparation of zirconium compounds for testing any
pro-cedure other than the 1,10-phenanthroline method for iron.
Another possible separation seemed to be the sublimation
of zirconium tetrachloride in an atmosphere of hydrogen. Since zirconium tetrachloride sublimes above 300° centigrade9
and at this temperature hydrogen gas would reduce the ferric
chloride to metallic iron~ attempts were made to effect such
a separation. The experimental results were not encouraging;
a complete separation from iron was not realized9 the yields
on a laboratory scale were low9 and the process as a whole
was difficult to control. If the preparation of ldrge
-14-the process might be practical9 but the development of a process based on the fractional crystallization and recrystallization of zirconyl chloride octahydrate by Kenneth A. Walsh made available kilogram lots of a water soluble compound contain-ing less than
5
parts per million iron (131). A31
·
5
per cent solution of zirconyl chloride octahydrate was prepared by dissolving 1500 grams of specially purified~ hafnium free~zirconyl chloride octahydrate in dilute hydrochloric acid solution9 filtering to remove suspended material and diluting to a final volume of four liters with distilled water. The acid concentration in the solution was approximately 0.1 N in free acid and gravimetric standardization by evaporation to dryness and ignition in platinum showed the solution to contain the equivalent of 0.1429 gram of zirconium dioxide
per milliliter.
Neutralized sulfosalicyli'c acid solutions: A 56 per cent solution of sulfosalicylic acid neutralized to pH 5-6 with ammonium hydroxide was prepared by dissolving
335
grams sul-fosalicylic acid~ S03H(C6H3 ) (OH)COOH.2H209 (J.T. Baker Chern= ical company) in distilled water$ adding concentrated ammonium hydroxide (about 225 ml.)until the color of the solutionchanged from violet to yellowo The solution was clarified by filtration and diluted to a volume of 500 ml.
l,lO~Phenanthroline Method
Previous work at the Ames Laboratory (132} .has shown the applicability of the 1910-phenanthroline method to the deter= mination of iron in the presence of metals that normally might precipitate in the recommended pH range of 3 to 9 provided the metals are held in solution with "masking agent" or 11complexing agent". The best materials to prevent the
pre-cipitation of metals at elevated pH seem to be hydroxy organic acids such as citric, tartaric9 salicylic and sul fosalicylic acids. The choice of a complexing agent depends upon the pH at which one wisD.es to operate and the solubi li t ies of the masking agent-metal combination in the r ange and the relative
stabilities of the complexes of iron whith 1~10-phenanthroline and the masking agent. From past experience9 the choice of complexing agents was limited to tartrate and citrate salts.
Preparation of calibration curve
A volume of fifty ml. was chosen for most of the experi= mental work since this volume was more than adequate for
several spectrophotometric determinations of absorba~cy.
With an automatic pipette9 known volumes of standard iron
-15-fate, containing 10.0 micrograms of iron per ml., were run into fifty ml. volumetric flasks~ five ml. of 0.1 per cent
1~10-phenanthroline solutionp
0.5
ml. of 10 per centhydroxyl-amine hydrochloride solution and
5.0
ml. of5
per centammon-ium acetate solution were added to each of the iron solutions.
This volume of ammonium acetate buffer was sufficient to
produce solutions well within the pH range of
3
to9
recom-mended by Fortune and Mellon
(5).
The pH of the solutionswas determ.i.ned both with the Beckman pH meter and with wide
range Hydrion indicator paper. After these solutions had
stood at room temperature for at least an hour~ the
absorb-ancies were determined with the Beckman spectrophotometer
at a wavelength of 510
mp
with a slit width of 0.10 mm. usingdistilled water as the reference solution and one centimeter
Corex glass cuvettes. With these conditions, the spectral
band width is
2.3
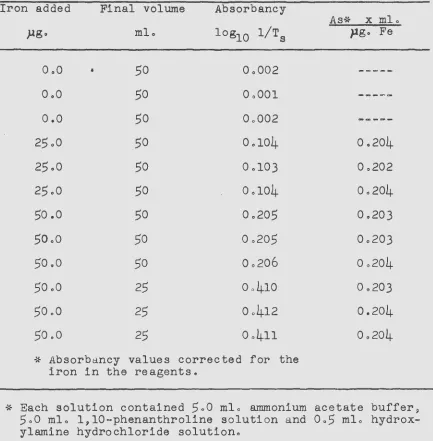
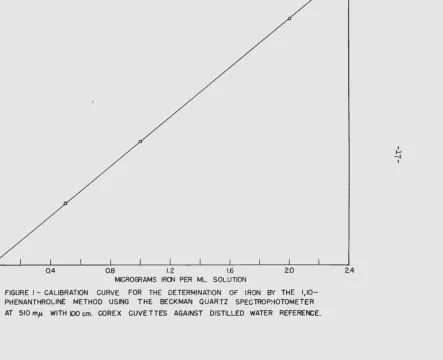
m)l according to the data supplied by themanufacturer of the instrument. A plot of the data recorded
in Table 1 (Figure 1) shows that the system obeys Beer1s law
over the chosen range; this calibration curve was used in
estimating the concentration of iron in subsequent
experi-mental work.
Tartrate Complexation
Effect of tartrate. When ammonium acetate is used as
a buffer in the estimation of iron by the 1~10-phenanthroline
method as in the preparation of the calibration curve,
com-plete developmerit of the color is observed after the solutions
have stood at room temperature for fifteen minutes. In all
probability the maximum intensity may be reached in a shorter
length of time but physical limitations in this inv8stigation
made necessary this time interval between the preparation of
solutions and the accurate determination of their optical
properties. To determine the rate of color development in
the presence of ammonium tartrcltep solutions were prepared
as follows:
With an automatic pipette~
5.0
ml. of standard ironsulfate solution containing 10.0 micrograms of iron per mlo~
15.0 ml. of twenty-five per cent diammonium tartrate solution~
0.5
ml. of ten per cent hydroxylamine hydrochloride solutionand
5
.
0
ml. of 0.1 per cent 1,10-phenanthroline solution weretransferred to fifty ml. volumetric flasks and the pH of the
resultant solutions adjusted to
5.0
with dilute ammoniumhydroxide. The solutions were diluted to volume with
dis-tilled water and the absorbancies determined wi th the Beckman
spectrophotometer at various time intervals. A "blank"
deter-mination of the iron in the r eagents was made by preparing
stand-
~16-TABLE I
Solutions for lplO=Phenanthroline
Calibration Curve*
Iron added Final volume Absorbancy
As·:<- x ml.
}lgo mlo loglO l/T8
pg.
Feo.o
•
50
0.002____
,..._0.0
50
0.001---<=-o.o
50
0.002---0::..-25.0
50
0.104 0.20425.0
50
0.103 0.20225.0
50
0.104 0.20450
.o
50
0.205 0.20350.0
50
0.205 0.20350.0
50
0.206 0.20450.0
25
0.410 0.20350.0
25
0.412 0.20450.0
25
0.411 0.204* Absorbancy values corrected for the iron in the reagents.
~} Each solution contained
5.0
ml. ammonium acetate buffer~5
.
0
ml. l,lO~pherianthroline solution and0.5
mL [image:18.566.46.479.195.636.2]-~~
RCl'
0
_J
~
~02'
<(
m
0::
0
(/)
m
<(
0.4 08 1.2 IE 2.0
MICROGRAMS IRCJII PER ML. SOLUTION
FIGURE I - CALIBRATION CURVE FOR THE DETERMINATION OF IRON BY THE
1,10-PHENANTHROLINE METHOD USING THE. BECKMAN QUARTZ SPECTROP:-tOTOMETER
AT 510 mp. WITH 100 em. COREX CUVETTES AGAINST DISTILLED WATER REFERENCE.
I
!:5
I
[image:19.566.123.647.69.467.2]-18-ard iron sulfate solution and subjecting the "blank" to
identical treatment.
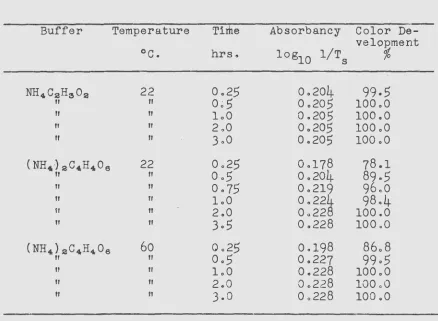
The data obtained are listed in Table 2.
These data show that in the presence of
3.75
grams of
diammonium tartrate in a volume of fifty ml., the color
cor-responding to
50.0micrograms of iron
does
not reach a
maxi-mum value until at least an hour and a half after
prepara-tion of the soluprepara-tion. A graphical representaprepara-tion of the rate
of color development is shown in Figure
2z
for comparison the
curve showing the rate of color development in a solution
buffered
with ammonium acetate is also included.
The inhibition of the color development may be due to
several factors but such an investigation is beyond the scope
and purpose of this research.
1,.Effect of temperature.
Since an increase of temperature
has
been shown (133) to
accelerate
rates of reaction, this
color-development
experiment
was repeated and the solutions
were immersed in a water bath
at
60°0. after preparation,
instead of
standing
at room
temperature.
These
data
are also
recorded
in
Table 2
and Figure
2 and s
h
ow
that the
color
de-velopment is
essentially complete at
the
end of one-half
houri
Ammonium tartrate
has
no detrimental
effects on
the
colorimetric determination
of
iron other than reducing
the
rate
of
color development and increasing the blank due
to
traces of
i~onin the reagento
These
effects
may be
elim·
inated
by allowing
the solutions to stand for at least an
hour
and a
half
at room temperature or half an hour at 60°0.
p~ior
to spectrophotometric measurement of the absorbancy,
and
runnin
g
a
"blank"
determination on tho reagents to
deter-mine t
heir
contribution to the absorbanoy of the
solution~Effect
of tartrate
and
zirconyl chloride.
Investiga-tion
of
the rate of color development in solutions
contain-ing
both ammonium tartrate and ziroonyl chloride
was begun
by preparin
g
solutions containing 5.0
ml.
of
standard iron
sulfate
solution
containing
10.0 micrograms of
iron
per
ml.,
10.0
ml.
of zirconyl
chloride solution containing
the
equiva-lent of 1.06
grams of
zirconium
met~l,0.5
ml.
of
ten
per
cent hydroxylamine hydrochloride
solution, 5.0 ml.
of 0.1 per
cent 1,10-phenanthroline solution, 15.0 ml. of twenty-five
per cent diammonium tartrate solution and adjusting the pH
of the resulting solution to 5.0 with dilute ammonium hydroxide.
Upon the addition of the diammonium tartrate solution to the
zirconyl chloride solution a curdy white precipitate was
formed; upon the addition of the ammonium hydroxide the
pre-cipitate dissolved as the pH was raised above
3.5
or 4.0.
-19-TABLE II
Rate of Color Development with 1,10-Phenanthroline
in the Pre senc.e of Acetate or
Tartrate·~-Buffer Temperature Tirhe Absorbancy Color
De-oc.
hrs. log10 l/T8 velopment%
NH4C2H302 22 0.25 0.204 99-5
II II 0~5 0.205 100.0
"
II 1.0 0.205 100.0II II 2.0 0.205 100.0
II II
J.O
0.205 100.0(NH4 ) 2C4H406 22 0.25 0.178 78.1
"
"
o.5
0.204 89.5"
"
0. 75 0.219 96.0"
II 1.0 0.224 98.4II II 2.0 0.228 100.0
II II
3·5 0.228 100.0
(NH4 ) 2C4H406 6o 0.25 0.198 86.8 II
"
o.5
0.227 99·5II II 1.0 0.228 100.0
"
"
2.0 0.228 100.0II
"
J.O
0.228 100.0-~~ Each solution contained
50
micrograms of iron in additionto the iron in the buffer in a final volmne of
50
ml. after [image:21.566.63.501.186.507.2]0 Q
X
I
J;::E.::>
~~
8O:::E
>'
>--0
- Z
<ex
IIlm
g~
(/)(/)
6
lilli)
<ex
!--"'
z
w
:::E
~
w> 40
w
0
a::
g
0
0
1-z
w
0
a:: 2
w
a.
05 1.0 1.5
1-e- AMMONIUM ACETATE BUFFERED SOLUTION .
2-e-AMMONIUM TARTRATE BUFFERED SOLI.;TION AT 22•c. 3- O-AMMONIUM TARTRATE BUFFERED SOUJTION AT so• C.
2.0 2.5 3.0
TIME, IN HOURS
FIQURE 2- RATE OF COLOR DEVELOPMENT.
35
~
=21=
(Model H-2} pH meter and wide range Hydrion papero The ab=
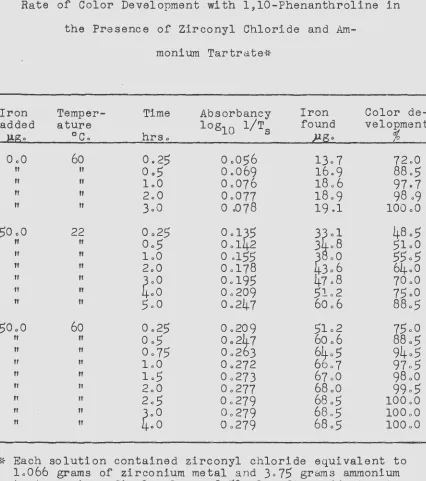
sorbancies of the solutions were determined at various time intervals as shown in Table
3o
A "blank" determination was made to determine the contribution of the reagents byfol-lowing the same solution preparation procedure but omitting the addition of the standard iron sulfateo A plot of the
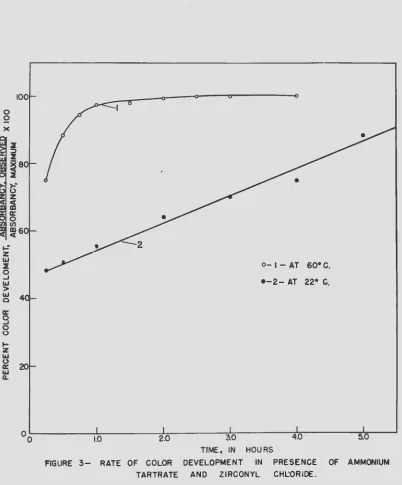
observed absorbancies against time as in Figure
3
shows thatat no time within twelve hours standing at room temperature is a maximum .color intensity reachedo
Effect of temperatureo Since standing at elevated temperature was shown to accelerate the rate of color
devel-opment in tartr•ate solutions9 additional zirconyl
chloride-ammonium tartrate solutions were prepared and submerged in
the water bath at 60°Co The observed absorbancies are
recorded in Table 3 and a plot of these data is shown in Figure 3o A striking increase in the rate of complex
forma-tion is noted and the maximum intensity of coloraforma-tion is
ob-tained in an hour and a halfo Of interest also is the close
similarity of the curves for iron and ammonium tartrate at
room temperature and the iron-zirconyl chloride-ammonium tartrate at the elevated temperatureo
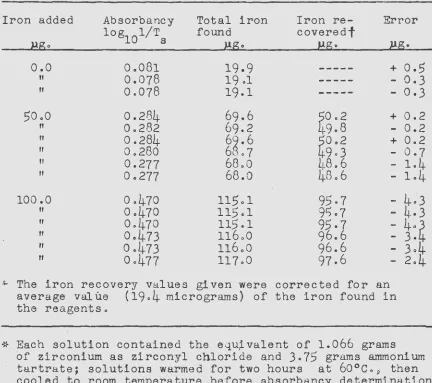
Reproducibility and accuracyo The reproducibility of
the 1~10-phenanthroline method for iron in the presence of
zirconyl chloride and ammonium tartrate was tested by
prepar-ing a series containprepar-ing progressively larger amounts of iron
and developing the color under controlled conditionso Each solution contained the equivalent of lo06 grams of zirconium as zi rconyl chloride and 3o
75
grams of diammonium tartrate in a volume of50
mlo The pH of each solution was adjusted to5oO
as determined with the Beckman pH meter and thesamples were maintained at 60°Co for two h9urso After cooling to room temperature the absorbancies were determined and are
recorded in Table
4o
These data indicate fifty micrograms of iron may be determined in the presence of a gram of zir=conium with a possible error of less than two per centz if
the iron concentration is increased· to about 100 micrograms~ the error is increased to about four per cento The repro-ducibility in eit~er range
(50
or 100 micrograms) is good9 at the higher value~ the trend of the results is to be lowand in all probability an increase in the amount of 1,10-phenanthroline ad~ed would help to minimize this errore
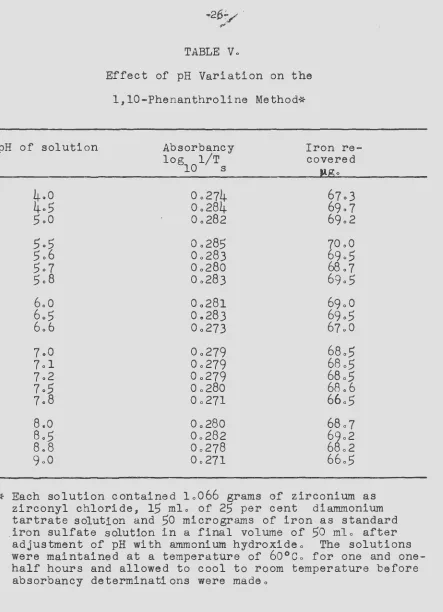
To determine the effect of acidity and to ascertain the degree of control of pH required to obtain accurate re= sults using the 1~10-phenanthroline method for the deter-mination of iron in the presence of zirconyl cblorideP a
-22~
TABLE III
Rate of Color Development with 1,10-Phenanthroline in
the Presence of Zirconyl Chloride and
Am-monium Tartrate~f
Iron Temper- Time Absorbancy Iron Color
de-added ature log10 l/T8 found velopment
l!:g 0 0
c
0 hrs oPSo
%
OoO 60
0.25
Oo056
13.7 72.0II
"
Oo5
0.069 16.988.5
"
II 1.0 0.076 l8o697·7
II II 2.0 0.077 18.9
98.9
"
II 3.0 0 .078 19.1 100.050.0
22Oo25
0.1~5ll
48o.5II
"
0.5
Ool 2 3 0 8 .5lo0"
II 1.0 0.155
4
oO5[o5
"
"
2.0 0.178 3o6 6.o
II II
'oO Ool9.5 47.8 ?OoO
II
"
oO Oo2095l.2
75oO
!I II
5oO
Oo247 60o688.5
50o0
60Oo25
0 o209 ,51.2?5.0
ff
"
Oo5
0.2t7 60.688o5
II
"
Oo75
Oo2 36t.5
94 • .5If II loO 0.272 6
0 7 97 • .5
II II
1.5
0.273 67o0 98oO"
II 2o0 0.277 68.099·.5
"
II2.5
Oo279 68o.5 lOOoO"
II~.0
Oo279 68o.5 lOOoO"
"
.o
0.279 68 • .5 100.0 [image:24.564.46.472.124.605.2]0 0
X
~
z UJ
~
0
...J
UJ >
100
~ 4 a: g
0
0
...
z
UJ
0 a: 20
ILl Cl.
[image:25.566.100.502.105.590.2]00 1.0 2.0
FIGURE 3- RATE OF COLOR
TARTRATE
-23-3.0
TrME, IN
DEVELOPMENT
o-1- AT
so• c
.
•-2- AT 22• C.4.0
HOURS
IN PRESENCE OF
AND ZIRCONYL CHL.:ORIDE.
5.0
-24-TABLE IV.
Reproducibility and Accuracy of the Color Development
with 1~10-Phenanthroline in the Presence of
Iron added
o.o
II II 50.0"
II If If II 100.0 If If If"
,,
knrnoni urn Tartrate and Zirconyl Chloride.;~
Absorbancy
log10 l/T8
0.081 0.078 0.078 0.284 0.282 0.284 0.280 0.277 0.277 0.470 0.470 0.470 0.473 0.473 0.477
Total iron found
J.lg 0
19.9 19 .l 19.1 69.6 69.2 69.6 68.7 68.0 68.0 115.1 115.1 115 .l 116.0 116.0 117.0
Iron re-coveredf
pg.
Error
pg.
+
0.5
- 0.3 - 0.3
·'- The iron recovery values given were corrected for an
average value (19.4 micrograms) of the iron found in
the reagents.
-11- Each solution contained the equ~ valent of 1.066 grams
of zirconium as zirconyl chloride and 3.75 grams ammonium
tartrate; solutions warmed for two hours at 60°C.~ then
[image:26.566.42.474.207.590.2]solutions contained the same concentrations of reagents as
the solutions made up in the preceding section for the rate
of color development studyo By varying the small amount of
ammonium hydroxide required, the pH of the solutions was
adjusted to values from 4oO to 9a09 below the 4oO value9
precipitation of a gelatinous mass prevented spectrophoto~
metric estimation of the optical properties of the solutionso
After maintaining the solutions at 60°Co for one and one=
half hours followed by cooling to room temperature 9 the ab=
sorbancies were measured with the spectrophotometero A
tabulation of the results is shown in Table
5
and the dataare shown in graphic form in Figure 4o Some variation of
results is observed but with no significant trend with var-iation of pHo
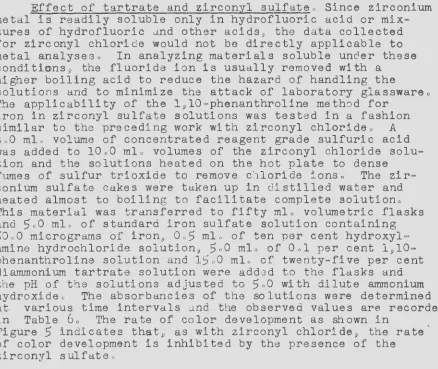
Effect of tartrate and zirconyl sulfatea Since zirconium
metal is readily soluble only in hydrofluoric acid or mix~
tures of hydrofluoric and other acids~ the data collected
for zirconyl chloride would not be directly applicable to
metal analyseso In analyzing materials soluble under these
conditi~ns9 the fluoride ion is usually removed with a
higher boiling acid to reduce the hazard of handling the
solutions and to minimize the attack of laboratory glasswareo
The applicability of the l 910=phenanthroline method for
iron in zirconyl sulfate solutions was tested in a fashion
similar to the preceding work with zirconyl chloridea A
3a0 mlo volume of concentrated reagent grade sulfuric acid
was added to lOoO mlo volumes of the zirconyl chloride
solu-tion and the solusolu-tions heated on the hot plate to dense
fumes of sulfur trioxide to remove chloride ionso The zir=
conium sulfate cakes were taken up in distilled water and heated almost to boiling to facilitate complete solutiono
This material was transferred to fifty mlo volumetric flasks
and
5
o
O
mlo of standard iron sulfate solution containing50
a
0
micrograms of iron9O
a
5
mla of ten per cent hydroxyl=amine hydrochlor•ide solution9
5a0
mL of Oal per cent 1910=phenanthroline solution and l5aO mlo of twenty-five per cent
diammonium tartrate solution were added to the flasks and
the pH of the solutions adjusted to
5
a
O
with dilute ammoniumhydroxideo The absorbancies of the solutions were determined
at various time intervals and the observed values are recorded
[image:27.566.73.507.84.257.2]in Table 6o The rate of color development as shown in
Figure
5
indicates thatD as with zirconyl chloride9 the rateof color development is inhibited by the presence of the
zirconyl sulfateo
The effect of elevated temperature on color intensity
was tested by repea.ting the zirconyl sulfate work and
[image:27.566.78.516.264.633.2]pH of solution
4.0 4·5
5.0
5.5
5.6
5.7
5.8
6.0 6.5 6.6
7o0
7ol
7o2
7o5
7o8
8.0
8.5
8.8
9.0
TABLE V.
Effect of pH Variation on the
1,10-Phenanthroline Method*
Absorbancy Iron
re-log 1/T covered
10 s
0.274 67.3
0.284 69.7
0.282 69.2
0.285
70.00.283 69.5
0.280 68 0 7
0.283 69.5
0.281 69.0
0.283 69.5
0.273 67.0
0.279 68.5
0.279 68.5
0.279 68.5
0.280 68.6
0.271 66.5
0.280 68. 7
0.282 69.2
0.278 68.2
0.271 66.5
*
Each solution contained 1.066 grams 0f zirconium aszirconyl chloride9 15 ml. of
25
per cent diammoniumtartrate solution and
50
micrograms of iron as standard.iron sulfate solution in a final volume of
50
ml. afteradjustment of pH with ammonium hydroxide. The solutions
were maintained at a temperature of 60°C. for one and
one-half hours and allowed to cool to room temperature before
[image:28.566.51.494.54.666.2],
Q4IC
0.301-() ... ()~ ,...
) -u-u-u 0 '-' " - u (
0
-1..-"'
~!02a-g
>-~
~
!
~QIOr-O.O 40 5.0 6.0 70 8.0 9.0
FIGURE 4- EFFECT OF pH VARIATION CHLORIDE AND AMMONIUM TARTRATE
pH OF SOLUTION
ON ABSORBANCY OF SOLUTIONS CONTAINING ZIRCONYL FOLLOWING RECOMMEI'ffD TREATMENT FOR
1,10-PHENANTHROLINE METHOD. L1 NE AT 0.280 INDICATES AVERAGE VALUE FOR THIS SET OF DATA.
~
-.l
[image:29.566.63.662.104.483.2]
-28-TA
BLE
VI.
Rate
of
Color
Development
with
l~lO~Phenanthrolinein
the Presence o
f
Zirconyl Sulfate and
Ammonium Tartrate*
Iron
Temper-
Time
Absorbancy
Iron
Color de=
added
ature
log
1/T
found
velopment
pg.
oc.
hrs.
10
s
pg.
%
o.o
60
0.25
0.069
16.9
75.1
II II
0.5
0.080
19.6
87.0
II II
0.75
0.083
20
·4
90.4
II II
1.0
o.o86
21
.1
93.5
I• II
2
.
0
0
.091
22.3
99.0
II II
~.0
0
.
092
22.6
100.0
II II
.o
0.092
22.6
100.0
50.0
22
0.25
0.18~45.0
62.0
II II
0.5
0.20
50.0
69o0
II II
0
0
75
0
o2l3
52.2
72o0
II !I
1.0
O
o
218
~q
73o5
II 11
lo5
Oo222
75.0
II II
2o0
Oo227
55.
76
o
6
if II
r
0.235
57.5
78.4
II II
.o
o. 242
59o3
8l
o9
VI II
oO
0
.25
6
62o8
86o7
II II
l2o0
0
o257
63ol
87.0
50o0
6o
0.25
0
.
221
.54-02
7~.8
II II
Oo5
Oo255
62.6
8
01
"
IIOo75
Oo267
65o5
90o5
IJ II
loO
Oo276
67.8
93o2
II !I
lo5
Oo287
70.~
97o0
II II
2o0
Oo295
72
0
-
99o6
"
II2o5
0.296
72o
100.0
II
"
3o0
Oo296
72o6
lOOo
O
II II
5oO
Oo296
72o6
lOOoO
~~
Each solution
contained
the
equivalent of 1.066 grams
of
zirconium metal
as
zirconyl
sulfate and 3o75 grams
a: g
0
1..)
100
~ 20
UJ 0
a:
UJ
a..
-29-2 4 6
TIME, IN HOURS
8
o-1 -AT so• c.
•-2 -AT 22° C.
10
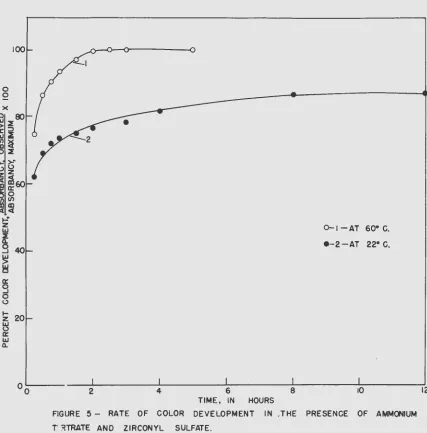
FIGURE 5 - RATE OF COLOR DEVELOPMENT IN .THE PRESENCE OF AMMONIUM T' ~TRATE AND ZIRCONYL SULFATE.
[image:31.564.85.512.142.575.2]
-30-ancies as recorded at various time intervals are listed in Table 6 and a plot of the data in Figure 5 indicates that maximum color development is attained after heating for
about two hourso The reproducibility of the method is shown
by the minor variations of the observed values in Table 6~
and the validity of the method is demonstrated by the corre-lation between the predicted and observed absorbancies ob=
tained by correcting for the iron concentration in tqe reagentso
The similarity between the results obtained with zir~
conyl chlor~de and those with zirconyl sulfate may be
inter-preted as an indication that the inhibition of color develop~
ment observed is due primarily to the zirconyl ion in presence
of the masking agent and does not depend upon the anion with
which the zirconium was originally associatedo Therefore
the further investigation of the tartrate system will be done
with the zirconyl chloride and the assumption will be made
that other soluble salts such as the sulfate and nitrate
will react in the same mannero
Interfering ionso Titaniumg Among the elements normally
associated with zirconium in the ores and commercial prepara=
tions~ titanium is one of the metals th8t apparently follows
zirconium and i.ron through the conventional separationso The
effect of titanium on the l»lO=phenanthroline method of
deter-mination of iron in zirconium mignt be expected to be
negli-gible due to the chemical similarity of titanium and zirconiumo
To make certain that this was the case9 to fifty mlo volu
-metric flasks containing the equivalent of 1 o066 grams of
zirconium metal as zirconyl chloride were added the equivalent
of loOO milligram of titanium as titanium sulfateo These
solutions W6re treatsd with Oo5 mlo volumes of 10 per cent
hydroxylamine hydrochloride sclution~ 5oO mlo volumes of Ool
per cent l~lO=phenanthroline solution9 :!.5 ml o volumes of 25
per cent dian~cnium tartrate solution and the pH adjusted to
5 to 6 with dilute ammonium hydroxideo After these samples
had stood at 60°Co for two hour·s and had cooled to room
temperature., the absorbancies were determined and are r>ecorded
in Table ?o From these values., one may conclude that Ool per
cent titanium in zirconium metal will not affect the accuracy
of the determination of iron using the recom.lTlended procedureo
Zinc: ·Since i t is anticipated that work will be done on
the zirconiumc~zinc system and since i t has been shown that
the interference due to the zinc complex is a function of the
reagent concentration (11), solutions were prepared to contain
the equlvalent of 1000 parts per million zinc in zirconium
metal by adding -5aO mlo of zinc sulfate solution con~aining
200 micrograms zinc per ml a to 10 ml o of zirconyl c.:-1lori de
[image:32.566.54.502.100.691.2]-31-TABLE VIIo
'\' I
Effect of Diverse Ions on the Determination
of
Iron with
Ion
added
mgo
Oo2 Ni
Oo4
Ni
Oo6
Ni
loO
Ni
loO
Ti
loO
Zn
1
50 Zn
48 F
96
F144
F192
F240
Fl
910=Phenanthroline in the Presence of
Zir-conium and Tartrate*
Absorbancy
log 1/Ts
10
O
o
271
Oo264
Oo218
Oo008
0.003
Oo272
0
o265
Oo004
Oo292
Oo286
Oo285
O
o)ll
O
oJlQ
Iron re
=
covered
ugo
7lo5
70
ol
69
o9
76oJ
76oO
Error
=lJol
=
64o5
=
65
o8
+
5o0
+
3o6
+
3
o
4
+
9o8
+
9o5
Error
%
=
2o7
=l9o7
=97o0
~99o0
-
2o3
=98o5
+
7o5
+