Abstract: Electroencephalographic (EEG) signals are the preferred input for non-invasive Brain-Computer Interface (BCI). Efficient signal processing strategies, including feature extraction and classification, are required to distinguish the underlying task of BCI. This work proposes the optimized common spatial pattern(CSP) filtering technique as the feature extraction method for collecting the spatially spread variation of the signal. The bandpass filter (BPF) designed for this work assures the availability of event-related synchronized (ERS) and event-related desynchronized (ERD) signal as input to the spatial filter. This work takes consideration of the area-specific electrodes for feature formation. This work further proposes a comparative analysis of classifier algorithms for classification accuracy(CA), sensitivity and specificity and the considered algorithms are
Support Vector Machine(SVM), Linear Discriminant
Analysis(LDA), and K-Nearest Neighbor(KNN). Performance parameters considered are CA, sensitivity, and selectivity, which can judge the method not only for high CA but also inclining towards the particular class. Thus it will direct in the selection of appropriate classifier as well as tuning the classifier to get the balanced results. In this work, CA, the prior performance parameter is obtained to be 88.2% sensitivity of 94.2% and selectivity 82.2% for the cosine KNN classifier. SVM with linear kernel function also gives the comparable results, thus concluding that the robust classifiers perform well for all parameters in case of CSP for feature extraction.
Index Terms: Brain-Computer Interface(BCI),
Electroencephalography(EEG), Common spatial pattern(CSP), event-related synchronized(ERS), event-related desynchronized (ERD)
I. INTRODUCTION
Brain-computer interface(BCI) is categorically divided into invasive and non-invasive type depending on the way of acquiring the input signals. Invasive BCI works on the electrical signals obtained from the limited region of the brain by invasively placing the electrodes to get source specific and robust signal. In the case of non-invasive BCI signals are collected from the scalp of the subject by placing the electrode using the standard electrode placement method[1][2]. In this case, chances of interference by other electrophysiological signals as well signal from the adjacent electrode is high[3]. Task-related features can be identified from these signals by application of signal processing techniques, which helps the signal to rise above the overlapping noise and represent the features in a
Revised Manuscript Received on July 05, 2019.
Sanjay R. Ganorkar, Electronics and Telecommunication, Sinhgad College of Engg., Pune, India.
Vrushali G. Raut, Electronics and Telecommunication, Sinhgad College of Engg., Pune, India.
distinguishable manner. Appropriate feature extraction method collecting the distributed features in the spatial domain as well as considering the time-frequency correlation is of importance. The next most crucial part is a classifier, which has to deal with the separation of the features having non-linear variations as well as subject wise variations. The literature survey presented in this paper tries to focus on the feature extraction methods used for EEG based BCI covering the different aspects of feature extraction. Extracting the spatiotemporal features for representing the underlying task from the EEG signal supports in generating the features useful for classification[4]. The patch of spatial filter prepared by using this concept optimizes the variance of the signal when operated it, and variances serves as compatible features[5]. Extension of this work forms subspace for each class and union of these subspaces were used to select principal components useful for classification in the multiclass problem[6]. In case of the small training set, CSP got the modifications which reduces the variance estimation while reducing the where the covariance-matrix estimation is regularized by two parameters to lower the estimation variance while reducing the estimation bias[7]. Wavelet energy of detail and approximate coefficient bands obtained by applying discrete wavelet transform on the signal was also used as features in the application to BCI[8]. Higher-order statistical parameters extracted from the wavelet band also resulted in robust features leading to the higher value of classification accuracy(CA)[9]. Power spectral density (PSD) and phase locking value (PLV) was also used and acted as strong features as they were able to measure the functional connectivity between the signals[10].
Classification methods used for EEG indicate the gradually from the linear classifier to non-linear classifiers and then including the neural network and deep learning. Considering the recent paper on EEG for detection of sleep disorder, deep learning method was introduced, resulting in state of the art performance[11].
Ensemble classification model with independent classifiers used for the CSP features resulted in good classification accuracy and concluded on modification of classifier characteristics[12]. K-NN serves the efficient classifier when used for the statistical features derived from the wavelet decomposed signals[9].
Chapter I of the paper introduces the recent trends in BCI and gives the literature review for the signal processing methods covering feature extraction and classification techniques. Chapter II explain the
database methodology used for this research analyzing the spatial filtering method
Analysis of classification methods suitable for
band limited spatially filtered EEG signal
applicable to non-invasive BCI
used for feature extraction and different classification strategies variation with variations in kernel functions. Chapter III gives the results obtained in term of performance parameters. Chapter IV elaborates on conclusions and future scope.
II. DATABASEANDMETHODOLOGY
A. Database Description
This research uses the database provided by the Intelligent Data Analysis Group, from the department of neurology, Berlin. Recording of the EEG signals was done on normal subject and feedback was not provided. The subject is sitting in a chair resting arms on the table and fingers in typing position on the computer keyboard. The task provided was to press the keys with the index and little fingers. The recorded experiment consists of 3 sessions of 6 minutes each. Average typing speed was 1 key per second.
Data consist of 316 labelled epochs which can be used for training purpose and 100 unlabelled epochs to be used for testing purpose, each epoch is of 500 ms length and is ending 130 ms before a key press thus avoiding the signal due to mechanical movement. Left-hand movements (LHM) are indicated by label 0, and right-hand movements (RHM) by 1, the Sampling frequency is 1000 Hz and down sampled to 100 Hz. A Neuro-scan amplifier with 28 Ag/Ag–Cl electrode placed according to the international 10/20 electrode placement system were used for recording[13].
B. Methodology
This research emphasizes on band limitation of the signal using IIR BPF for preserving the task related modulations. Feature extraction strategy implemented in this work uses the optimized variance of the signals from selected electrodes obtained after applying CSP filter on it. Further, the work analyses the classifier variation and kernel variations on the performance parameters of the system.
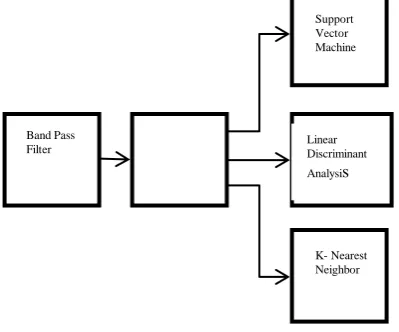
Figure 1 Block Diagram Description of Methodology
1. Feature extraction strategy
Motor imagery task when captured in the form of EEG signals and collected from the scalp of the subject, the task-related variations of the signal have spread in time-frequency as well as spatial domain. Bandpass filtering the signal to capture the ERD and ERS of the signal is the prime task done in this work.
The spread of the variation in the spatial domain is collected by using CSP filtering strategy.
Band Pass Filter
In case of MI signals event-related variations are accumulated in ERD covered by µ band ranging from 8-12Hz and β band ranging from 15-30Hz[14]. As these variations are very small, the noise may override it or hide it. This work implemented bandpass linear phase filtering of the signals. Filter designed with a lower cut-off frequency of 5Hz and an upper cut-off frequency of 35Hz with order 50 retains the µ and β bands carrying event related information.
Spatial filtering method
Spatial filtering method works on forming the filter mask made from the most influential electrodes for the MI signals. This mask, when applied on the test signal, provides us with the time series having an optimum variance for the underlying task making the task distinguishable. As the motor imagery signal is band specific, the band-limited signals provided to the spatial filter results in the more distinguished variance. Process of forming spatial filter uses 316 training trials for selected A channel with B samples forming the matrix of
E=A×B for every trial under every class. Next step computes spatial covariance of that matrix and normalizes it as in equation 1
'
'
( )
EE C
trace EE
1
Spatial covariance is separately obtained for the training trials to consider task-related variations of LHM and Cl is obtained
by averaging them. Similarly averaging of the covariance of RHM gives CR. Equation 2 indicated the summation of two
average variations for two different classes.
c l R
C
C
C
2 Further the matrix Cc is decomposed into eigen values andeigen vectors as in equation 3
' c c c c
C U
U 3The obtained eigenvalues
c and eigenvector Uc whencomputed as in equation 4 gives the whitening transform matrix P. Whitening transform matrix P is obtained using the eigenvalues
c and eigenvectorsc
U computed in equation 4.
For this whitening operation, eigenvalues are arranged in descending order, and accordingly, the eigenvectors are sorted.
1 ' c
P U 4
Whitening transform when applied on
c
C to give '
c PC Pwill
result in unity eigenvalues, thus confirming the equalization of the variance in the space spanned by
c
U . Operating this
whitening transform matrix independently on
l C and CR
as in equation 5 and 6 Band Pass
Filter
CSP Filter
Support Vector Machine
Linear Discriminant Analysis
[image:2.595.61.261.494.660.2]respectively resulted in
S
l andS
R.'
l l
S
PC P
5'
R R
S PC P 6
These Sl and SR are decomposed into eigenvalues and
corresponding eigenvectors '
l l
S B B
and 'r R
S B B
then
I
l R, where I is the identity matrix. Obtainedidentity matrix suggested that eigenvector with large eigenvalue for
l
S will be having small eigenvalue for
R S and
vice-versa. This leads to the conclusion that eigenvector matrix B can be used for representing the task variation for classification. If whitened EEG is projected on Eigenvector corresponding to large eigenvalues will form the feature vector. Projection matrix given by equation 7 is further used to decompose the signal under test as in equation 8. Equation 9 forms the feature vector corresponding to the variance of the
signals as in equation 8[11],[13].
' '
( )
W B P
7
ZWE
8
2
1
(
)
log
var(Z )
pp m
i i
var Z
F
9
2. Classification techniques
The various classifiers considered under this section are particularly selected from the literature dealing with biomedical signal classification.
Support vector machine (SVM)
SVM is the robust classifier widely accepted for non-invasive EEG based BCI[13][15]. It is designed for separating two classes using the optimization of the hyperplane. This method is particularly preferred for data with limited training trials but provides with a stable solution. The kernel functions available with SVMs maps the data or the features to higher dimensional space from where they can are linearly separable. Linear machine trained on separable data where the training data is {xi, yi} for i= 1….l and yi є {1,-1} and xiє Rdas in fig. 1
and given by equation 10 and 11.
.
1
i
x w b
for yi = +110
.
1
i
x w b
for yi = -111
Figure 2 Feature Separation Strategy of SVM In case of non-linear separation requirement, linear boundaries became inappropriate SVM can map the input vector x to higher dimensional feature space z. Some widely acceptable mappings radial basis function, polynomial, and sigmoid functions[16][17].
K-Nearest Neighbour
It is one of the primary and essential techniques required in machine learning. It is the supervised and non-parametric method finding application in pattern recognition, data classification, and intrusion detection[18]. In the case of the classification, there is an input requirement of k training examples accommodated in the feature space. Class membership will be the output of the classifier. The object will be assigned to the most common class among its k neighbors.
Linear discriminant analysis (LDA)
Linear Discriminant Analysis (LDA) is the dimensionality reduction technique with the goal of separating the classes. It is developed by Ronald A. Fisher for only a 2-class problem and then generalized to apply to multi-class problems by C.R. Rao. LDA project the features from higher dimension space onto a lower dimensional space using the following steps. The first step estimates the between-class variance as given in equation
1
(x
x)(x
x)
g
T
b i i i
i
S
N
12
The second step calculates with class variance using the following equation 13
1 1
(x
x)(x
x)
iN g
T
w ij ij
i j
S
13
Lower dimensional space is constructed in the third step for maximizing the between-class variance, whereas minimizing the within-class variance. The equation 15 gives the P as the lower dimensional projection.
arg max
T b
lda T
P w
P S P
P
P S P
14
Performance Parameters
This dataset poses the problem of binary classification; hence this work uses the statistical measures for judging the performance of the methods
measures/parameters considered in this work are classification accuracy, statistical sensitivity, and specificity. These parameters can be calculated by using true negative(TN), true positive(TP), false negative(FN) and false positive(FP) values obtained after classification. Where
True Positive(TP):- LHM classified as LHM. True Negative(TN):-RHM classified as RHM. False Positive(FP):-RHM confused as LHM. False Negative(FN):-LHM confused as RHM.
Classification Accuracy(CA) is given by equation 15 and which represents the correctly classified LHM and RHM.
100
TP TN
CA
TP TN
FP
FN
15
Sensitivity and specificity are the measures indicating inclination of the method towards particular class and are given by equation 16 and 17. Even one can elaborate that larger value of sensitivity and smaller selectivity will show the inclination of the classifier towards LHM and vice-versa.
100
TP
Sensitivity
TP
FN
16
100
TN
Specificity
TP TN
17
III. RESULTSANDDISCUSSION
A. Feature Extraction
MI signal is band limited signal and hence to maintain the event-related variations this work uses FIR BPF with a cut-off frequency of 5-35Hz accommodating ERD and ERS. Fig. 3 displays the frequency response of the designed filter indicating constant amplitude response for the expected range of frequency.
This band-limited signal is used for the formation of CSP filter mask; this work optimizes the filter mask design by using selected nine electrodes using the available training trials, as shown in fig. 4. It will help in building practical BCI with the limited number of electrodes and hence decreasing the complexity of the overall system. The designed CSP mask, when applied on the signal under test, optimizes the variance of the signal based on the underlying task making the task distinguishable. Thus variance of the signal is extracted as the feature in this work.
[image:4.595.303.532.51.185.2]Figure 3 Frequency Response for Band Pass Filter
Figure 4 Electrode Selected for CSP Mask and Feature extraction
B. Classification and performance evaluation
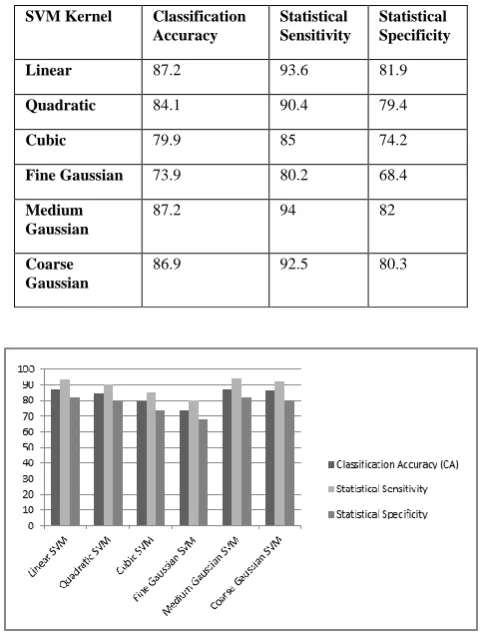
[image:4.595.306.547.388.705.2]Evaluating the classifiers based on the proposed performance parameters is one of the objectives of this work and hence, along with the CA, Sensitivity and Specificity are proposed. From table 1 and fig. 5, it can be stated that medium Gaussian kernel of SVM gives CA of 87.2% along with 94% statistical sensitivity and 82% statistical specificity which is the best result compared to other kernel functions. Results of the linear kernel functions are also comparable they only lag on the front of sensitivity and selectivity.
Table 1 Performance Evaluation of SVM
SVM Kernel Classification
Accuracy
Statistical Sensitivity
Statistical Specificity
Linear 87.2 93.6 81.9
Quadratic 84.1 90.4 79.4
Cubic 79.9 85 74.2
Fine Gaussian 73.9 80.2 68.4
Medium Gaussian
87.2 94 82
Coarse Gaussian
86.9 92.5 80.3
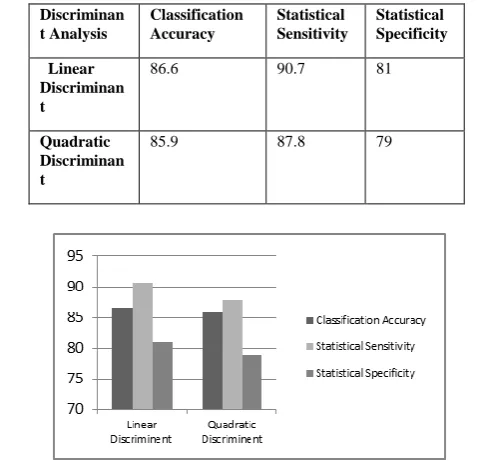
[image:4.595.52.261.641.775.2]Table 2 and fig. 6 represents the performance evaluation for two variations in Discriminant Analysis, which are suitable for LDA with 86.6% CA Sensitivity of 90.7% and specificity 81%.
Table 2 Performance Evaluation of Discriminant Analysis
Figure 6 Graphical Representations for Analysing Discriminant Analysis
[image:5.595.49.290.482.764.2]Table 3 and fig. 7 evaluated the classifier KNN for different Gaussian functions. It resulted in maximum classification accuracy of 88.2% sensitivity of 94.2% and specificity of 82.2% which is highest among its all kernel functions as well among all considered classifiers.
Table 3 Performance Evaluation of KNN
KNN kernel Classification
Accuracy
Statistical Sensitivity
Statistical Specificity
Fine KNN 77.1 78.8 72
Medium KNN 85 86.8 77.2
Coarse KNN 85.9 87.8 79
Cosine KNN 88.2 94.2 82.2
Cubic KNN 84.4 83.8 75.1
Weighted KNN 85.6 87.1 78.3
Figure 7 Graphical Representation for Analysing Kernel Functions of KNN
I. CONCLUSION AND FUTURE SCOPE This work searches for the best band of frequency using the BPF presenting the CSP filter with task-related variations and filtering the other unwanted overlapping signals. Optimized CSP implemented in this work uses area specific electrodes covering the MI part of the brain, thus constructing the filter using only nine electrodes. Methodology proposed here tries to compare various classifier and their kernel function based on not only CA but also sensitivity and selectivity as performance parameters. Though the classifier with a competent CA resulted in better sensitivity and selectivity, the inclination of the classifier toward a particular class can be judged from it. It can be used to adjudge the classifier, and further tuning of the classifier can be done to improve the CA. Result obtained for CA using KNN with cosine kernel is 88.2%, and the adjoining sensitivity is 94.2%, and selectivity is 82.2% which is highest compared to others. Boosting the classification accuracy can be possible in this work by adding the pre-processing method which will help in representing the task related modulations of the signal.
REFERENCES
1. J. R. Wolpaw and D. J. Mcfarland, “Control of a two-dimensional movement signal by a noninvasive brain – computer interface in humans,” PNAS, vol. 101, no. 51, 2004.
2. J. R. Wolpaw, N. Birbaumer, D. J. McFarland, G. Pfurtscheller, and T. M. Vaughan, “Brain–computer interfaces for communication and control,” Clin. Neurophysiol., vol. 113, no. 6, pp. 767–791, Jun. 2002. 3. J. Kayser and C. E. Tenke, “Issues and considerations for using the scalp surface Laplacian in EEG/ERP research: A tutorial review,” Int. J. Psychophysiol., vol. 97, no. 3, pp. 189–209, 2015.
4. K.-R. Müller, M. Tangermann, G. Dornhege, M. Krauledat, G. Curio, and B. Blankertz, “Machine learning for real-time single-trial EEG-analysis: From brain computer interfacing to mental state monitoring,” J. Neurosci. Methods, vol. 167, no. 1, pp. 82–90, 2008. 5. H. Ramoser, J. M. Gerking, and G. Pfurtscheller, “Optimal Spatial
Filtering of Single Trial EEG During Imagined Hand Movement,”
IEEE Trans. Rehabil. Eng., vol. 8, no. 4, pp. 441–446, 2000. 6. T. Hoang, D. Tran, and X. Huang, “Approximation-based common
principal component for feature extraction in multi-class brain-computer interfaces.,” Conf. Proc. ... Annu. Int. Conf. IEEE Eng. Med. Biol. Soc. IEEE Eng. Med. Biol. Soc. Annu. Conf., vol. 2013, pp. 5061–4, Jan. 2013.
7. H. Lu, H. L. Eng, C. Guan, K. N. Plataniotis, and A. N. Venetsanopoulos, “Regularized common spatial pattern with aggregation for EEG Classification in small-sample setting,” IEEE Trans. Biomed. Eng., vol. 57, no. 12, pp. 2936–2946, 2010. 8. H. Ullah, A. Aamir, S. Malik, and R. Fayyaz, “Feature extraction and
classification for EEG signals using wavelet transform and machine learning techniques,” Australas Phys Eng Sci Med, Springer, 2015. 9. J. Kevric and A. Subasi, “Biomedical Signal Processing and Control
Comparison of signal decomposition methods in classification of EEG signals for motor-imagery BCI system,” Biomed. Signal Process. Control ,elsevier, vol. 31, pp. 398–406, 2017.
10. S. A. Park, H. J. Hwang, J. H. Lim, J. H. Choi, H. K. Jung, and C. H. Im, “Evaluation of feature extraction methods for EEG-based brain-computer interfaces in terms of robustness to slight changes in electrode locations,” Med. Biol. Eng. Comput., vol. 51, no. 5, 2013. 11. S. Chambon, M. N. Galtier, P. J. Arnal, G. Wainrib, and A. Gramfort,
“A Deep Learning Architecture for Temporal Sleep Stage Classification Using Multivariate and Multimodal Time Series,” IEEE Trans. Neural Syst. Rehabil. Eng., vol. 26, no. 4, pp. 758–769, 2018.
Discriminan t Analysis
Classification Accuracy
Statistical Sensitivity
Statistical Specificity
Linear Discriminan t
86.6 90.7 81
Quadratic Discriminan t
12. I. Xygonakis, A. Athanasiou, N. Pandria, D. Kugiumtzis, and P. D. Bamidis, “Decoding Motor Imagery through Common Spatial Pattern Filters at the EEG Source Space,” Comput. Intell. Neurosci. Hindawi, vol. 2018, no. Mi, 2018.
13. B. Blankertz, G. Curio, and K.-R. Müller, “Classifying single trial EEG: Towards brain computer interfacing,” Adv. Neural Inf. Process. Syst. Conf., vol. 1, no. c, pp. 157–164, 2002.
14. N. Brodu, F. Lotte, and A. Lecuyer, “Comparative study of band-power extraction techniques for Motor Imagery classification,” 2011 IEEE Symp. Comput. Intell. Cogn. Algorithms, Mind, Brain, pp. 1–6, 2011. 15. S. Jirayucharoensak, S. Pan-Ngum, and P. Israsena, “EEG-Based Emotion Recognition Using Deep Learning Network with Principal Component Based Covariate Shift Adaptation,” Sci. World J., vol. 2014, 2014.
16. E. Gokgoz and A. Subasi, “Effect of multiscale PCA de-noising on EMG signal classification for diagnosis of neuromuscular disorders,”
JMed Syst , Springer, pp. 31–38, 2014.
17. G. F. Amal Feltane, “Automatic Seizure Detection in Rats Using Laplacian EEG and Verification with Human Seizure Signals,” Ann Biomed Eng., vol. 41, no. 3, pp. 645–654.
18. S. K. Bashar, M. Imamul, and H. Bhuiyan, “Identification of Motor Imagery Movements from EEG Signals Using Automatically Selected Features in the Dual Tree Complex Wavelet Transform Domain,”
Univers. J. Biomed. Eng., vol. 3, no. 4, pp. 30–37, 2015.
AUTHORS PROFILE
Dr. S. R. Ganorkar borned at Amravati, Maharashtra, India, in 1965. He received the B.E. in Electrical, Electronics and Power engineering and M.E. degrees in Advance Electronics from Government college of Engineering Amravati, Amravati university, Maharashtra, India in 1988 and 1994 and the Ph.D. degree in Electronics & Telecommunication engineering from Dr. Babasaheb Ambedkar Technological University, Lonere. Maharashtra, India in 2013. From 1989 to 2002, he was a Junior Engineer with the Maharashtra state Electricity Board. Since 2002, he has been a Professor with the Electronics and Telecommunication Engineering Department, Sinhgad College of Engineering. His research interest includes signal and image processing. He has more than 40 research papers on his name.