Architectural conjectural mapping: two examples
Silvia Boca1, Aleksa Korolija1,11Politecnico di Milano, ABC Department of Architecture, built environment and construction engineering, Milan, Italy
Abstract. Mapping is a key research tool to understand the relationship between specific geographical features and territorial transformations (settlement patterns, hydraulic works, new rail and road infrastructure, land-use change). Starting from the Italian academic tradition (Muratori, Caniggia, Rossi) that focused mainly on the urban context we have developed mapping for fringe-areas at various scales: from city and countryside to expanding rural areas that mark the shifting boundaries (using the agricultural Behera-Region/Alexandria in Egypt and the Belgrade urban evolution in Serbia). Mapping should envision not only the geomorphological features but also the complexity of the landscape structure, as a repository of layers, questioning what are we looking for through mapping and constructing the legend accordingly: selecting which elements need to be highlighted or remain latent and which additional elements need to be identified with the help of complementary sources. GIS holds potential for showing key physical features, their extent, quantity and position in a single glance but is mapping the same as tracing? Is it capable of showing the space-time whirl in landscape transformations?
Introduction
According to James Corner,
[for architects, urban designers and landscape architects] mapping refers to more than inventory and geometrical measure, and no presumption is made of innocence, neutrality or inertia in its construction. Instead, the map is first employed as a means of ‘finding’ and then ‘founding’ new projects, effectively re-working what already exists. Thus, the processes of mapping, together with their varied informational and semantic scope, are valued for both their revelatory and productive potential [1: 224].
In pointing out the difference between “finding” and “founding”, Cosgrove helps us introducing architects’ maps, most often transcending analytical descriptions of the status quo to reveal the potential for future change. Why would an architect, a landscape designer or a town planner engage with mapping in a “map-saturated world” [2] if not to pursue the envisioning power of maps? We should ask ourselves how a map may
condense knowledge in order to orientate transformations to come. Building on personal experience in conjectural mapping is one approach.2
Cosgrove’s notion of ‘finding’ may be inflected in an urban or a territorial framework, whose distinguishing features may be identified only by gaining a thorough understanding of continuities and changes over the long period of time.
To clarify how conjectural mapping may become a tool to depict the historical depth of a given territory, we shall present two paradigmatic case studies: Alexandria at the edge of the Nile Delta [3] and Belgrade at the confluence of the Sava and the Danube [43, 6]. Finally, we shall conclude by combining André Corboz’s notion of “palimpsest” [7] with Eugenio Turri’s idea of “Landscape as a theatre” [8].
Architects as map-makers: some relevant precedents
American landscape architect James Corner argues that mapping means “first disclosing and then staging the conditions for the emergence of new realities” [1]. In this sense, architects are “biased” map-makers, as their mapping is always finalized to alter the status quo. However, grafting the ‘new’ onto the ‘old’ requires selection criteria, concerning what to and how to transform.
[image:2.481.60.419.349.558.2]When called upon to develop a project, architects have to decide what of the pre-existing reality may still play a part in a new configuration. Thus, their mapping is not just about layering. Whenever some elements are described analytically and others are not, even a simple survey is all but neutral. In fact, most often, the same drawing represents the existing situation as the embryo of a new spatial arrangement.
Figure 1. Detail of Giambattista Nolli’s Map. (Source: [4])
A good example is Giambattista Nolli’s Map of Rome (Pianta Grande di Roma,1748: Figure 1). It’s graphic quality, and representational criteria, combine objective data
2 Developed over the last eight years as students, teaching assistants in a Studio class and, more recently, as members of the Milan team of MODSCAPES.
3 Presented at the exhibition Premio Mantero2010-2011, Xth ed., and published in [5]. 4 NOLLI, G.B. 1748, Nuova Topografia Di Roma. Retrieved from:
with a subjective speculative approach. The map is characterized by a typically diagrammatic figure-ground representation, showing in a solid grey colour the footprint of the ordinary urban fabric, and detailing in black the ground plans of public buildings and enclosed spaces (public and private). Nolli depicts, with the same accuracy, churches and courtyards (monasteries and palaces), antiquities and gardens (fragile areas easier to change), and major topographic elements (rivers and canals, aqueducts, hills and mounds of earth). Allan Ceen considers Nolli’s map an extraordinary example of urban analysis, because it manages to “reconstruct the givens faced by planners as they conceived of new projects”, allowing us to understand “the creative choices made by planners to align building and spaces to viewing conditions” [9].
When, in 1978, Nolli’s conjectural map regained momentum as a common reference for the International call Roma Interrotta5, the generative power of mapping became clear, even with the passage of time. On that occasion, Rome epitomized the intertwined presence of history, landscape and architecture. This competition brought together prominent European and American architects and town planners, challenging them to “imagine Rome” rather than considering it a mere background for new buildings. “Imagining Rome” is exactly what Nolli did back in 1748. His map visualising the difference between urban artefacts and ordinary blocks was meant to disclose possible “grafting points” (Figure 2) for participants to figure out a theme of architecture.
Italian art historian Giulio Carlo Argan defined this experience an “exercise of Imagination at Memory’s parallel bars” through which architects would distance themselves from historians. “[…] right the opposite of a master plan” [10]. It cannot pass unnoticed that, in the Italian tradition of mutual exchange between urban studies, town planning and architectural design, maps have always been retained a key class of data.
It was certainly so for Saverio Muratori6, according to whom urban history, based on the study of maps and cartography, provided a typo-morphological framework entailing a set of long-lasting principles for urban and architectural design. Muratori’s idea of storia operante7 [11], depicting the growth of cities as a pacified sequence of additions in time and space, found an architectural outcome in his inclination towards an adaptive repetition of traditional urban fabric. This typo-morphological approach builds on isotropic urban surveys (uniform in all orientation) of all the buildings.
Despite being two polar examples of architects as maps makers, both Nolli and Muratori exemplify well our idea of conjectural mapping based on cross-checking different classes of data: books, archival material, historical maps, photos, etc.
5 The participants at the Call were: Piero Sartogo, Costantino Dardi, Paolo Portoghesi with Vittorio Gigliotti from Rome; Antoine Grumbach from Paris; James Stirling from London; Romaldo Giurgola from New York, Robert Venturi with John Rauch from Philadelphia, Michael Graves from Princeton, Rob Krier from Wien; Aldo Rossi (with Max Basshard, Gianni Braghieri, Arduino Cantafora, Paul Katzberger) from Milan and Leon Krier from London.
6 1910-1973, architect and urban historian. He was a professor at the Faculty of Architecture in Rome and IUAV in Venice. His main works include, Studi per un operante storia urbana di Venezia (1960 [11]), Studi per un operante storia urbana di Roma (1963), and the unfinished Studi per un operante storia del territorio, the latter focused on the Italian territory and its transformations from the Roman period up to the present day.
Figure 2. Detail of the entry by C. Rowe for the Call Roma Interrotta; the upper picture shows the Nolli’s original 1748 map (Source: [5]), and the lower Rowe’s proposal for the same area in
1978. (Source: [10]).
Mapping Alexandria at the edge of the Nile Delta
heritage’ to focus instead on fringe areas where urban-rural relations are constantly and contradictorily being redefined.
Clearly, this implied the region-level, questioning the long-term role of the city in the Nile Delta. Conventional maps at different scales were not enough. At this crucial stage, we used conjectural mapping to cross-check and condense additional information available from a large body of literature, old maps and photos, and on-the-spot investigation. Our agenda was to gain a diachronic understanding of the western border of the Delta as a landscape in transition, where a succession of large-scale infrastructural projects over the last two centuries repeatedly redefined the Isthmian itinerary, and mode, of the Overland Route from the Mediterranean to the Red Sea, while shifting further west the limit of agricultural land. All this had a profound impact not only on the development of Alexandria and Cairo as transit points, but also on the landscape, and the settlement network, of the Nile Delta.
Mapping these metamorphoses required an appropriate legend, which we carefully set pondering what to emphasize, or play down, to focalize ad hoc reading lenses that might help us understand which elements of the long-term territorial structure might beneficially orient future change. In line with Eugenio Turri’s idea of landscape as a theatre [8], our mapping efforts were aimed at rendering the Delta as a combination of natural and artificial features, resulting from the creative choices made by later planners in devising canals, ports, road and railway schemes.
Our timeline was set on four fundamental time frames: the ancien régime (prior to Napoleon's expedition to Egypt), the late 19th century (after inauguration of the Suez Canal, and completion railway network), the 1970s (after the New Town programme) and, finally, the present conditions.
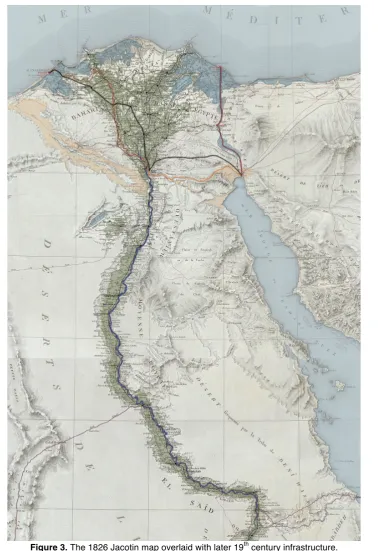
Just like Nolli’s map is regarded by scholars as a fundamental source to study Rome, we used the map drawn by P. Jacotin in 1826 as a key representation of the Delta: its physical features, hydraulic system, settlement network, caravan routes (Figure 3). Knowledge about the historical geography gained from Omar Toussoun’s8 studies [12] led us to rework Jacotin’s map, integrating it with major 19th-century infrastructural works.
Figure 3. The 1826 Jacotin map overlaid with later 19th century infrastructure. (Prepared by S. Boca based on [9]).
9 JACOTIN, P. (1818) 1826. “Carte géographique de l’Égypte et des pays environnan[t]s (…)”, in C.L.F. Panckoucke (ed.), Description de l’Égypte (…), Paris, Imprimerie de C.L.F.
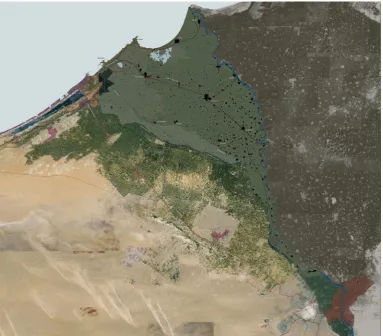
To show the shifting border between the Delta and the Western Desert, we used the latest available google-earth (Figure 4), carving it with a mosaic of other maps to foreground the difference between old and new lands, their subsequent generations and related settlements. We achieved that by representing the historical settlement pattern in a simplified way, whereas rendering the complexity of the more recent territorial structures.
[image:7.481.50.434.193.529.2]The correspondence of reclamation of new lands and foundation of new towns was for us another challenging theme. We mapped artificial canals and their branching network in correlation with agricultural-related settlements and activities in a series of working drawings gathering comprehensive information from fieldwork and web search (Figure 4).
Figure 4. Map showing the settlement patterns and canals of the study area overlaid on the satellite photograph of the area. (Prepared by S. Boca based on: © Google 2018, © ORION ME 2018).
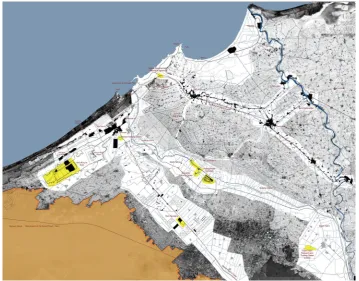
We eventually scaled down this set of drawings and set them jointly into a black-and-white satellite map (Figure 5). In this case, Google Earth imagery formed an ideal background for a finely detailed map carved around the water, road and rail infrastructure, showing “white bands” where to find existing training centres and experimental agricultural stations for the old and the new lands.
Along this line of thought, we finally set out to understand which parts of Alexandria came into being to establish, or empower, the relationship between the port and the Delta. At this final stage, our goal was to identify an asset – water, rail and road ways, reaching out to the agricultural land, and related villages, farms, functional and industrial buildings – and select which of the available resources, and which key locations, might form the basis for a future scheme (Figure 6). Abstracting from the urban fabric areas and elements which are a tangible expression of the long-standing relationship between Alexandria and the Delta, this map guided us in choosing a site for our graduation project, but could be also understood as useful to tool to be handed over to local authorities.
[image:8.481.61.421.193.474.2]Figure 5. A map formed from the layers of water and infrastructure of the study area over a satellite photographic base. (Prepared by S. Boca based on: © Google 2018, © ORION ME 2018).
[image:8.481.71.411.508.640.2]Belgrade at the confluence of the Sava into the Danube
Ludovico Ariosto’s description of the siege of Belgrade [13] may suffice to evoke Belgrade geo-historical role: a city repeatedly rebuilt in-between two worlds. For over five centuries, along the short distance from Zemun to Kalemegdan, the Danube has marked the boundary between the Austro-Hungarian and the Ottoman empires. From the mid-19th century to the present time, Belgrade has been an Ottoman military outpost at the border with the Austro-Hungarian Empire, the capital of independent Serbia (1860), the capital of Tito’s multi-ethnic Yugoslavia (1945) and, since 1991, the capital of modern Serbia.
Zemun, Kalemegdan, Dorcol, Novi Beograd: these four names express well the multi-polar character of Belgrade mirroring its geo-political shifts. Travellers’ reports, rather than conventional maps, still echo the role of Belgrade as the centre of an ever-changing territorial entity. In moments of radical change, when destruction and subsequent reconstruction brought out the issue of vanishing townscapes conjectural mapping rises to challenge of Belgrade’s contested identity.
Actually, a series of deliberate destructions of the pre-existing urban fabric over the last two centuries, paralleled by the establishment of decentralized institutional clusters, appear to contradict the idea itself of urban development as a mere incremental process.
Sketches, travellers’ accounts and military reports, get us to the heart of an Ottoman frontier town turned into a European capital, helping us decode the metamorphoses of its physical environment. These may be summarized but the increasing importance of the Sava riverbanks and upgrading of the harbour area. Partially following the ancient Via Militaris, the route leading to Istanbul also defined the city’s backbone and commercial core, rapidly declining in the process of Europeanization [14]. Only by cross-checking bibliographical sources and views of the city, we can figure out the oriental townscape of Carigradski drum10, and identify its path as still present in Belgrade’s urban layout.
Somehow unexpectedly, Josimovic’s11 scheme for Belgrade (Figure 7), despite the sharp break to be marked by replacing the Turkish town with a new city [15], identified a number of grafting points bearing evidence to the pre-existing urban layout. The fact that Josimovic represented the old urban fabric and the footprint of the city in the same drawing allows us to detect his grafting points.
10 literally meaning: The Road to Istanbul.
Figure 7. Map based on Josimovic’s proposal showing the map grafting points formed by the pre-existing buildings and the fortification system. (Prepared by A. Korolja based on [15]).
The case of Belgrade clearly shows how conventional map fail to convey the “anthropological” dimension of cities facing the most dramatic of changes, and how conjectural mapping may help us represent the “magmatic” nature of the built environment at some critical historical junctures.
Conjectural maps may help us visualise which parts of Belgrade were arisen and rebuilt along new lines, as well the hidden traces or the vanished townscapes.
To put it in Allan Ceen’s words, this case challenges us to “reconstruct the givens faced by planners as they conceived of new projects,” allowing us to understand “the creative choices made by planners.” [9: 10]
Figure 8. Processed map with the overlay of the unbuilt projects of New Belgrade (darker) and the river banks (marked as A and D). Prepared by A. Korolja.
Some concluding remarks
Back in 1983, Benedict Anderson observed that, as a socio-cultural construction and a scientific abstraction, maps are all but neutral. Laying emphasis on the “taxonomic power” of European-style maps, he suggested to question them as a product of a political agenda rather than an unbiased representation of reality [16].
This paper purports to appraise the role of architects as map-makers, arguing that conjectural maps may better empower inductive thinking aimed at entrenching a proposal in a given context [1]. In other words, spatial-related knowledge condensed in a map may usefully help us identifying grafting points for a project: be it physical features (i.e. topographic conditions), the relationship between a place and certain activities, or architectural structures that might complement the new programme.
be focused case by case, rather than based on a codified methodology. A common denominator in these two case-studies is the extensive and diversifies sources required to formulate, and eventually answer, the ‘research questions’ mentioned above. Corboz cleverly argues that the archaeological concept of stratification does not depict the phenomenon of accumulation: “Most layers are both very thin and filled with lacunae. In particular, man does not imply add to these layers, he also erases them” [7: 27].
Assuming the lack of neutrality as a precondition (so clear in Nolli’s map), architects as map-makers should try to be less descriptive or didactic but rather depict the distinctive features of a given spatial framework, as the result of an historical evolution (including accumulation and erasure) and, as such, providing potential grafting points for future transformations.
Being now part of the Modscapes project, we are now testing our approach in the case of rural landscapes. In doing so, we identified a valuable reference in André Corboz’s idea of “the land as a project,” resulting from natural features and artificial transformations. But it may the case that bridging the rivalry between town and country is a false problem.
Acknowledgements
MODSCAPES is a collaborative research project funded under the HERA – Humanities in the European Research Area 3rd Joint Research Programme dedicated to “Uses of the Past” (2016-2019). This project has received funding from the European Union’s Horizon 2020 research and innovation programme under grant agreement n°649307.
Short resumes
Silvia Boca MA in Architecture, Politecnico di Milano (2013). Enrolled in the PhD Programme at the Department of Architecture, Built environment and Construction engineering, Politecnico di Milano (2016), to develop a thesis entitled “Memory and Invention of a Promised Land” in connection with the EU-funded project MODSCAPES (Modernist reinventions of the rural landscapes).
Aleksa Korolija PhD is an architect and urban designer. Currently is a Junior Researcher at Politecnico di Milano (POLIMI), Department of Architecture, Built Environment and Construction Engineering. He discussed his PhD Thesis “By feather and stone. The memorial architecture by Bogdan Bogdanovic” in 2017 in POLIMI. Currently he is member of Member of Do.co.mo.mo Serbia.
References
1. CORNER, J. 1999. “The Agency of Mapping: Speculation, Critique and Invention” in D. Cosgrove (ed.), Mappings, London, Reaktion Books: 231-252.
2. WOOD, D.; FELS J. 1992. The power of Maps, New York, The Guilford Press 3. BOCA, S. 2013. La nuova stazione di Montazah come hub per i training centre
della regione di Behera, MA thesis (sup.: C. Pallini, A. Scaccabarozzi, cons.: M. Pilati), 23July, School of Architecture, Politecnico di Milano.
DOI: https://doi.org/10589/82066.
C. Pallini, A. Scaccabarozzi; cons.: M. Pilati), 20 December, School of Architecture, Politecnico di Milano.
DOI: https://doi.org/10589/40821
5. “Progetti di Laurea per il Premio Mantero. X edizione” (2015). Architettura Civile, n° 11-12-13: 20.
6. SCACCABAROZZI, A.; KOROLIJA, A. (s.d.). “Idee di città per una nuova capitale: Belgrado tra 1841 e 1948”, unpublished text.
7. CORBOZ, A. (1983) 1985. “Il territorio come palinsesto”, Casabella, n° 516: 22-27. 8. TURRI, E. 1998. Il paesaggio come teatro: dal territorio vissuto al territorio
rappresentato, Venezia, Marsilio.
9. VERSTEGEN, I. and CEEN, A. (eds.) 2013. Giambattista Nolli and Rome: Mapping the City before and after the Pianta Grande, Rome, Studium Urbis Rome Center Architecture and Urban Planning in Italy.
10. ARGAN G.C.; NORBERG-SCHULZ C. et al. (eds.) 1978. Roma Interrotta, (exhibition catalogue), Rome, Incontri internazionali d’arte, Officina edizioni. 11. MURATORI, S. 1960. Studi per un’operante storia di Venezia, I, Rome, Istituto
Poligrafico dello Stato, Libreria dello Stato.
12. TOUSSOUN, O. 1926. La geographie de l’Égypte a l’époque arabe, Cairo, Egyptian Geographical Society.
13. ARIOSTO, L. 2016. Orlando furioso. Secondo l’Editio Princeps del 1516, Giulio Einaudi Editore. [1516].
14. DOGO M. and PITASSIO A. 2008. Città dei Balcani, città d’Europa. Studi sullo sviluppo urbano delle capitali post-ottomane. 1830-1923, Lecce, Argo
15. JOSIMOVIC, E. 1867. Objšanjenje predloga za regulisanje onog dela varoši Beograda što leži u Šancu [Explanation for the regulation plan of that part of Belgrade that lies within the moat], Belgrade, Državna Knjigopečatnja.
![Figure 1. Detail of Giambattista Nolli’s Map. (Source: [4])](https://thumb-us.123doks.com/thumbv2/123dok_us/8220933.265949/2.481.60.419.349.558/figure-giambattista-nolli-s-map-source.webp)
![Figure 2. Detail of the entry by C. Rowe for the Call the Nolli’s original 1748 map (Source: [Roma Interrotta; the upper picture shows 5]), and the lower Rowe’s proposal for the same area in 1978](https://thumb-us.123doks.com/thumbv2/123dok_us/8220933.265949/4.481.52.438.56.536/figure-nolli-original-source-roma-interrotta-picture-proposal.webp)