https://doi.org/10.5194/bg-15-5621-2018 © Author(s) 2018. This work is distributed under the Creative Commons Attribution 4.0 License.
Microbial decomposition processes and vulnerable arctic soil
organic carbon in the 21st century
Junrong Zha and Qianlai Zhuang
Department of Earth, Atmospheric, and Planetary Sciences and Department of Agronomy, Purdue University, West Lafayette, IN 47907, USA
Correspondence:Qianlai Zhuang ([email protected]) Received: 23 May 2018 – Discussion started: 13 June 2018
Revised: 28 August 2018 – Accepted: 29 August 2018 – Published: 20 September 2018
Abstract. Various levels of representations of biogeochem-ical processes in current biogeochemistry models contribute to a large uncertainty in carbon budget quantification. Here, we present an uncertainty analysis with a process-based biogeochemistry model, the Terrestrial Ecosystem Model (TEM), into which detailed microbial mechanisms were in-corporated. Ensemble regional simulations with the new model (MIC-TEM) estimated that the carbon budget of the arctic ecosystems is 76.0±114.8 Pg C during the 20th cen-tury, i.e.,−3.1±61.7 Pg C under the RCP 2.6 scenario and 94.7±46 Pg C under the RCP 8.5 scenario during the 21st century. Positive values indicate the regional carbon sink while negative values are a source to the atmosphere. Com-pared to the estimates using a simpler soil decomposition algorithm in TEM, the new model estimated that the arctic terrestrial ecosystems stored 12 Pg less carbon over the 20th century, i.e., 19 and 30 Pg C less under the RCP 8.5 and RCP 2.6 scenarios, respectively, during the 21st century. When soil carbon within depths of 30, 100, and 300 cm was consid-ered as initial carbon in the 21st century simulations, the re-gion was estimated to accumulate 65.4, 88.6, and 109.8 Pg C, respectively, under the RCP 8.5 scenario. In contrast, under the RCP 2.6 scenario, the region lost 0.7, 2.2, and 3 Pg C, spectively, to the atmosphere. We conclude that the future re-gional carbon budget evaluation largely depends on whether or not adequate microbial activities are represented in earth system models and on the sizes of soil carbon considered in model simulations.
1 Introduction
Northern high-latitude soils and permafrost contain more than 1600 Pg carbon (Tarnocai et al., 2009). Climate over this region has warmed in recent decades (Serreze and Fran-cis, 2006) and the increase is 1.5 to 4.5 times the global mean (Holland and Bitz, 2003). Warming-induced changes in carbon cycling are expected to exert large feedbacks on the global climate system (Davidson and Janssens, 2006; Chris-tensen and ChrisChris-tensen, 2007; Oechel et al., 2000).
of uncertainty in the global carbon budget quantification (Ciais et al., 2013).
Much of the uncertainty is also due to the relatively lower levels of representation of ecosystem processes that deter-mine the exchanges of water, energy, and C between land ecosystems and the atmosphere (Wieder et al., 2013) and ig-norance of some key biogeochemical mechanisms (Schmidt et al., 2011). For example, heterotrophic respiration (RH) is the primary loss pathway for soil organic carbon (Han-son et al., 2000; Bond-Lamberty and Thom(Han-son, 2010), and it generally increases with increasing temperature (David-son and Janssens, 2006) and moisture levels in well-drained soils (Cook and Orchard, 2008). Moreover, this process is closely related to soil nitrogen mineralization that determines soil N availability and affects gross primary production (Hao et al., 2015). To date, most models treated soil decomposi-tion as a first-order decay process, i.e., CO2 respiration is directly proportional to soil organic carbon. However, it is not clear if these models are robust under changing environ-mental conditions (Lawrence et al., 2011; Schimel and Wein-traub, 2003; Barichivich et al., 2013) since they often ignored the effects of changes in biomass and composition of decom-posers, while recent empirical studies have shown that micro-bial abundance and community play a significant role in soil carbon decomposition (Allison and Martiny, 2008). The con-trol that microbial activity and enzymatic kinetics imposed on soil respiration suggests the need for an explicit represen-tation of microbial physiology, and enzymatic activity, in ad-dition to the direct effects of soil temperature and soil mois-ture on heterotrophic respiration (Schimel and Weintraub, 2003). Recent mechanistically based models which explic-itly incorporated the microbial dynamics and enzyme kinet-ics that catalyze soil C decomposition have produced notably different results and a closer match to contemporary observa-tions (Wieder et al., 2013; Allison et al., 2010) indicating the need to incorporate these microbial mechanisms into large-scale earth system models to quantify carbon dynamics under future climatic conditions (Wieder et al., 2013; Allison et al., 2010).
This study advanced a microbe-based biogeochemistry model (MIC-TEM) based on the extant TEM (Raich and Schlesinger, 1992; McGuire et al., 1992; Zhuang et al., 2001, 2002, 2003, 2010, 2013; Hao et al., 2015). In MIC-TEM, the heterotrophic respiration is not only a function of soil tem-perature, soil organic matter (SOM), and soil moisture but also considers the effects of dynamics of microbial biomass and enzyme kinetics (Allison et al., 2010). The verified MIC-TEM was used to quantify the regional carbon dynamics in northern high latitudes (north of 45◦N) during the 20th and 21st centuries.
2 Methods 2.1 Overview
Below we first briefly describe how we advanced the MIC-TEM by modifying the soil respiration process in MIC-TEM (Zhuang et al., 2003) to better represent carbon dynamics in terrestrial ecosystems. Second, we describe how we pa-rameterized and verified the new model using observed net ecosystem exchange data at representative sites and how sim-ulated NPP was evaluated with Moderate Resolution Imag-ing Spectroradiometer (MODIS) data to demonstrate the re-liability of a new model at regional scales. Third, we present how we applied the model to the northern high latitudes for the 20th and 21st centuries. Finally, we introduce how we conducted the sensitivity analysis on initial soil carbon input, using gridded observation-based soil carbon data of three soil depths during the 21st century.
2.2 Model description
TEM is a highly aggregated, large-scale biogeochemical model that estimates the dynamics of carbon and nitrogen fluxes and pool sizes of plants and soils using spatially ex-plicit information on climate, elevation, soils, and vegetation (McGuire et al., 1992; Zhuang et al., 2003, 2010; Melillo et al., 1993). To explicitly consider the effects of microbial dy-namics and enzyme kinetics on large-scale carbon dydy-namics of northern terrestrial ecosystems, we developed MIC-TEM by coupling version 5.0 of TEM (Zhuang et al., 2003, 2010) with a microbial-enzyme module (Hao et al., 2015; Allison et al., 2010). Our modification of the TEM improved the rep-resentation of the heterotrophic respiration (RH) from a first-order structure to a more detailed structure (Fig. S1 in the Supplement).
In TEM, heterotrophic respirationRH is calculated as a function of soil organic carbon (SOC), temperature sensi-tivity of heterotrophic soil respiration (Q10), soil moisture (f(MOIST)), and the gram-specific decomposition constant Kd:
RH=Kd·SOC·Q temp.
10
10 ·f (MOIST), (1)
We thus revised the first-order soil C structure in TEM to a second-order structure considering microbial dynamics and enzyme kinetics according to Allison et al. (2010). In MIC-TEM, heterotrophic respiration (RH) is calculated as
RH=ASSIM·(1−CUE), (2)
where ASSIM and CUE represent microbial assimilation and carbon use efficiency, respectively. ASSIM is modeled with a Michaelis–Menten function:
ASSIM=Vmaxuptake·MIC·
DOC
Kmuptake+DOC, (3) where DOC is dissolved organic carbon and Vmaxuptake is the maximum velocity of the reaction and calculated using the Arrhenius equation:
Vmaxuptake=Vmaxuptake0·e
− Eauptake
R·(temp+273), (4)
where Vmaxuptake0is the pre-exponential coefficient, Eauptake is the activation energy for the reaction (J mol−1), R is the gas constant (8.314 J mol−1K−1), and temp is the tempera-ture in Celsius under the reaction occurs. Here we used soil temperature in the top 20 cm.
Moreover, Kmuptake is calculated as a linear function of temperature:
Kmuptake=Kmuptakeslope·temp+Kmuptake0. (5) Microbial biomass MIC is modeled as
dMIC
dt =ASSIM·CUE−DEATH−EPROD, (6) where microbial biomass death (DEATH) and enzyme pro-duction (EPROD) are modeled as proportional to microbial biomass with rate constantsrdeathandrEnzProd:
DEATH=rdeath·MIC, (7)
EPROD=rEnzProd·MIC, (8)
whererdeathandrEnzProdare the rate constants of microbial death and enzyme production, respectively.
DOC is part of soil organic carbon: dDOC
dt =DEATH·(1−MICtoSOC)+DECAY+ELOSS
−ASSIM, (9)
where MICtoSOC is carbon input ratio as dead microbial biomass to SOC, representing the fraction of microbial death that flows into SOC, and is set as a constant value accord-ing to Allison et al. (2010). SOC dynamics are modeled as follows:
dSOC
dt =Litterfall+DEATH·MICtoSOC−DECAY, (10)
where litterfall is estimated as a function of vegetation car-bon (Zhuang et al., 2010). The enzymatic decay of SOC is calculated as
DECAY=Vmax·ENZ· SOC
Km+SOC, (11)
where Vmax is the maximum velocity of the reaction and calculated using the Arrhenius equation:
Vmax=Vmax0·e− Ea
R·(temp+273). (12)
The parameters Km and carbon use efficiency (CUE) are temperature sensitive and calculated as a linear function of temperature between 0 and 50◦C:
Km=Kmslope·temp+Km0 (13)
CUE=CUEslope·temp+CUE0, (14)
where CUEslope and CUE0 are parameters for calculating CUE and Kmslope and Km0 are parameters for calculating Km. The values of CUEslope, CUE0, Kmslope, and Km0were derived from Allison et al. (2010).
ELOSS is also a first-order process, representing the loss of enzymes:
ELOSS=renzloss·ENZ, (15)
whererenzlossis the rate constant of enzyme loss. The enzyme pool (ENZ) is modeled as follows:
dENZ
dt =EPROD−ELOSS. (16)
Heterotrophic respiration (RH) is an indispensable compo-nent of soil respiration (Bond-Lamberty and Thomson, 2010) and is closely coupled with soil nitrogen (N) mineralization, which determines soil N availability, affecting gross primary production (GPP).
2.3 Model parameterization and validation
Table 1.Parameters associated with more detailed microbial dynamics in MIC-TEM.
Process Parameter Units Initial Value Description Parameter range Reference
Vmaxuptake0 mg DOC cm
−3
(mg biomass cm−3)−1h−1
9.97e6 Maximum microbial up-take rate
[1.0e4, 1.0e8] Hao et al. (2015)
Eauptake kJ mol−1 47 Activation energy – Allison et al. (2010)
Assimilation Kmuptakeslope mg cm
−3degree−1 0.01 Temperature regulator of
half-saturation constant for DOC uptake by microbes
– Allison et al. (2010)
Kmuptake0 mg cm
−3 0.1 Temperature regulator of
half-saturation constant for DOC uptake by microbes
– Allison et al. (2010)
CO2production CUEslope degree−1 −0.016 Temperature regulator of
carbon use efficiency
– Allison et al. (2010)
CUE0 – 0.63 Temperature regulator of
carbon use efficiency
– Allison et al. (2010)
Vmax0 mg SOC cm−3
(mg enz cm−3)−1h−1
9.17e7 Maximum rate of con-verting SOC to soluble C
[1.0e5, 1.0e8] Hao et al. (2015)
Decay Ea kJ mol−1 47 Activation energy – Allison et al. (2010)
Kmslope mg cm−3degree−1 5 Temperature regulator of
half-saturation constant for enzymatic decay
– Allison et al. (2010)
Km0 mg cm−3 500 Temperature regulator of
half-saturation constant for enzymatic decay
– Allison et al. (2010)
rdeath s−1 0.02 Microbial death fraction – Allison et al. (2010)
MIC turnover MICtoSOC 50 Partition coefficient for dead microbial biomass between the SOC and DOC pool
– Allison et al. (2010)
ENZ turnover rEnzProd s−1 5.0e-4 Enzyme production
frac-tion
– Allison et al. (2010)
rEnzLoss s−1 0.1 Enzyme loss fraction – Allison et al. (2010)
The critical parameter used in the MOD17 algorithm is con-version efficiency parameterε. More information about the MODIS NPP product can be found at https://neo.sci.gsfc. nasa.gov/view.php?datasetId=MOD17A2_M_PSN (last ac-cess: January 2017).
In TEM, NPP is calculated as
NPP=GPP−RA, (17)
where GPP is gross primary production and RA is au-totrophic respiration. GPP is defined as
GPP=Cmax·f (PAR)·f (phenology)·f (foliage)
·f (T )·f (CO2)·f (NA)·f (FT), (18) whereCmaxis the maximum rate of carbon assimilation, PAR is photosynthetically active radiation, andf(phenology) rep-resents the effects of leaf area (Raich and Schlesinger, 1992). The function f(foliage) represents the ratio of canopy leaf biomass relative to maximum leaf biomass (Zhuang et al., 2002).T is monthly air temperature, andf(CO2) represents
the effects of elevated atmospheric CO2 (McGuire et al., 1992; Pan et al., 1998). The functionf(NA) models the lim-iting effects of plant nitrogen status on GPP (McGuire et al., 1992; Pan et al., 1998). The functionf(FT) represents the ef-fects of freeze–thaw (Zhuang et al., 2003). For detailed GPP andRAcalculations, see Zhuang et al. (2003).
The parameterization was conducted with a global opti-mization algorithm SCE-UA (Shuffled Complex Evolution) (Duan et al., 1994) to minimize the difference between the monthly simulated and measured net ecosystem exchange (NEE) at these sites (Fig. S2). The cost function of the mini-mization is
Obj= k
X
i=1
(NEPobs,i−NEPsim,i)2, (19)
parameters were used for model validation and regional ex-trapolations.
2.4 Regional simulations
Two sets of regional simulations for the 20th century us-ing MIC-TEM and TEM at a spatial resolution of 0.5◦ lat-itude×0.5◦longitude were conducted. Gridded forcing data of monthly air temperature, precipitation, and cloudiness were used, along with other ancillary inputs including his-torical atmospheric CO2 concentrations, soil texture, eleva-tion, and potential natural vegetation. Climatic inputs vary over time and space, whereas soil texture, elevation, and land cover data are assumed to remain unchanged throughout the 20th century and only vary spatially. The transient climate data during the 20th century were obtained from the Climatic Research Unit (CRU TS3.1) of the University of East Anglia (Harris et al., 2014). The spatially explicit data include po-tential natural vegetation (Melillo et al., 1993), soil texture (Zhuang et al., 2003), and elevation (Zhuang et al., 2015).
Similarly, two sets of simulations were conducted driven with two contrasting climate change scenarios (RCP 2.6 and RCP 8.5) over the 21st century. The future climate change scenarios were derived from the HadGEM2-ES model, which is a member of the CMIP5 project (https: //esgf-node.llnl.gov/search/cmip5/, January 2017). The fu-ture atmospheric CO2 concentrations and climate forcing from each of the two climate change scenarios were used. The simulated NPP,RH, and NEP by both models (TEM 5.0 and MIC-TEM) were analyzed. The positive NEP represents a CO2 sink from the atmosphere to terrestrial ecosystems, while a negative value represents a source of CO2from ter-restrial ecosystems to the atmosphere.
Moreover, in order to test the parameter uncertainty in our model, we conducted the regional simulations with 50 sets of parameters for both historical and future studies. The 50 sets of parameters were obtained according to the method in Tang and Zhuang (2008). The upper and lower bounds of the regional estimations were generated based on these simulations.
2.5 Sensitivity to initial soil carbon input
Future carbon dynamics can be affected by varying initial soil carbon amount. In the standard simulation of TEM, the initial soil carbon amount for transient simulations was ob-tained from equilibrium and spin-up periods directly for each grid cell in the region. To test the sensitivity to the initial soil carbon amount in transient simulations for the 21st century, we used empirical soil organic carbon data extracted from the Northern Circumpolar Soil Carbon Database (NCSCD) (Tarnocai et al., 2009), as the initial soil carbon amount. The 0.5◦×0.5◦soil carbon data products for three different depths of 30, 100, and 300 cm were used. The sensitivity test was conducted for transient simulations under the RCP 2.6 and
RCP 8.5 scenarios. To avoid the instability of the C : N ratio caused by replacing the initial soil carbon pool with observed data at the beginning of transient period, initial soil nitro-gen values were also nitro-generated based on the soil carbon data and corresponding C : N ratio map for transient simulations (Zhuang et al., 2003; Raich and Schlesinger, 1992).
3 Results
3.1 Model verification at site and regional levels With the optimized parameters, MIC-TEM reproduces the carbon dynamics well for alpine tundra, boreal forest, tem-perate coniferous forest, temtem-perate deciduous forest, grass-lands, and wet tundra withR2ranging from 0.70 for Ivotuk to 0.94 for the Bartlett Experimental Forest (Fig. S3, Table S3). In general, the model performs better for forest ecosystems than for tundra ecosystems. The temporal NPP from 2001 to 2010 simulated by MIC-TEM and TEM was compared with MODIS NPP data (Fig. S4). Pearson correlation coef-ficients are 0.52 (MIC-TEM and MODIS) and 0.34 (TEM and MODIS). NPP simulated by MIC-TEM showed higher spatial correlation coefficients with MODIS data than TEM (Fig. S5). By considering more detailed microbial activities, the heterotrophic respiration is more adequately simulated using the MIC-TEM. The simulated differences in soil de-composition result in different levels of soil-available nitro-gen, which influences the nitrogen uptake by plants, the rate of photosynthesis, and NPP. The spatial correlation coeffi-cient between NPP simulated by MIC-TEM and MODIS is close to 1 in most study areas, suggesting the reliability of MIC-TEM at the regional scale.
Figure 1.Simulated annual net primary production (NPP,a), heterotrophic respiration (RH,b), and net ecosystem production (NEP,c) by MIC-TEM with an ensemble of parameters.
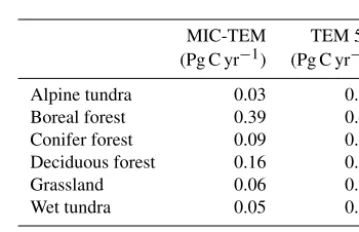
CO2to the atmosphere. From 1900 onwards, both models es-timated a regional carbon sink during the 20th century. With optimized parameters, TEM estimated higher NPP andRH at 0.6 and 0.3 Pg C yr−1than MIC-TEM, respectively, at the end of the 20th century (Fig. 2). MIC-TEM estimated a car-bon sink increase from 0.64 to 0.83 Pg C yr−1during the cen-tury while the estimated increase by TEM was much higher (0.28 Pg C yr−1) (Fig. 2). At the end of the century, MIC-TEM-estimated NEP reached 1.0 Pg C yr−1 in comparison with TEM estimates of 0.3 Pg C yr−1. TEM-estimated NPP andRH are 0.5 and 0.3 Pg C yr−1 higher, respectively. As a result, TEM estimated that the region accumulated 11.4 Pg more carbon than MIC-TEM. Boreal forests are a major car-bon sink at 0.55 and 0.63 Pg C yr−1estimated by MIC-TEM and TEM, respectively. Alpine tundra contributes the least sink. Overall, TEM overestimated the sink by 12.5 % in com-parison to MIC-TEM for forest ecosystems and 16.7 % for grasslands. For wet tundra and alpine tundra, TEM overesti-mated about 20 % and 33 %, respectively, in comparison with MIC-TEM (Table 2).
3.3 Regional carbon dynamics during the 21st century
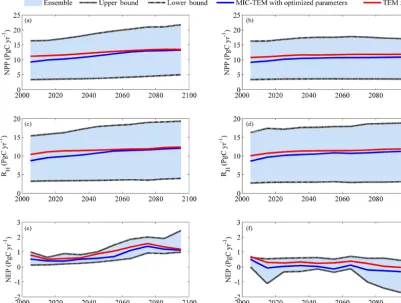
Simulated regional annual NPP and RH increase under the RCP 8.5 scenario with both models (Fig. 4). With optimized parameters, MIC-TEM-estimated NPP increases from 9.2
Table 2.Partitioning of average annual net ecosystem production (as Pg C per year) for six vegetation types during the 20th century.
MIC-TEM TEM 5.0 (Pg C yr−1) (Pg C yr−1)
Alpine tundra 0.03 0.04 Boreal forest 0.39 0.45 Conifer forest 0.09 0.09 Deciduous forest 0.16 0.18 Grassland 0.06 0.07 Wet tundra 0.05 0.06
Total 0.78 0.89
[image:6.612.338.518.440.556.2]es-Figure 2.Simulated annual net primary production (NPP,a), heterotrophic respiration (RH,b), and net ecosystem production (NEP,c) by MIC-TEM and TEM.
timates a regional carbon source of 79.5 Pg with an inter-annual standard deviation of 0.37 Pg C yr−1during the 21st century (Fig. 4). TEM predicted a similar trend for NEP, which overestimated the carbon sink with a magnitude of 19.2 Pg compared to the simulation by MIC-TEM with op-timized parameters. Under the RCP 2.6 scenario (Fig. 4), the increase in NPP andRH is smaller from 2000 to 2100 compared to the simulation under the RCP 8.5. MIC-TEM predicted that NPP increases from 9.1 to 10.9 Pg C yr−1, and TEM estimated it to be 1.6 Pg C yr−1 higher at the begin-ning and 0.9 Pg C yr−1 higher in the end of the 21st cen-tury (Fig. 4). Consequently, MIC-TEM-predicted NEP fluc-tuates between sinks and sources during the century, be-ing neutral before 2070 and a source of between −0.2 and
−0.3 Pg C yr−1after the 2070s. As a result, the region acts as a carbon source of 1.6 Pg C with an interannual stan-dard deviation of 0.24 Pg C yr−1 estimated with MIC-TEM and a sink of 27.6 Pg C with an interannual standard devia-tion of 0.2 Pg C yr−1estimated with TEM during the century (Fig. 4). When considering the uncertainty source of param-eters, MIC-TEM predicted that the region goes from acting as a carbon source of 64.8 Pg C to being a carbon sink of 58.6 Pg C during the century with a mean of−3.3±20.3 Pg at the end of 21st century (Fig. 4).
3.4 Model sensitivity to initial soil carbon
Under the RCP 2.6, without replacing the initial soil car-bon with inventory-based estimates (Tarnocai et al., 2009) in model simulations, TEM estimated that the regional SOC is 604.2 Pg C and accumulates an additional 12.1 Pg C during the 21st century. When using estimated soil carbon (Tarnocai et al., 2009) within depths of 30, 100, and 300 cm as initial pools in simulations, TEM predicted that regional SOC is
429.5, 689.3, and 1003.4 Pg C in 2000 and increases by 9.9, 16.0, and 22.8 Pg C at the end of the 21st century, and the regional cumulative carbon sink is 20.4, 34.0, and 48.1 Pg C, respectively, during the century. In contrast, using the same inventory-based SOC estimates, MIC-TEM projected that the region goes from acting as a cumulative carbon sink to being a source at 0.7, 2.2, and 3.0 Pg C. Under the RCP 8.5, both models predicted that the region acts as a carbon sink, regardless of the magnitudes of initial soil carbon pools used, with a TEM-projected sink of 71.7, 120, and 155.6 Pg C and a much smaller cumulative sink of 65.4, 88.6, and 109.8 Pg C estimated with MIC-TEM (Table 3).
4 Discussion
[image:7.612.109.488.66.257.2]tem-Figure 3.Spatial distribution of NEP simulated by MIC-TEM for the periods(a)1900–1930,(b)1931–1960,(c)1961–1990, and(d)1991– 2000. Positive values of NEP represent sinks of CO2into terrestrial ecosystems, while negative values represent sources of CO2to the atmosphere.
perature (R=0.91) than TEM (R=0.82), suggesting that MIC-TEM is more sensitive to environmental changes (Ta-ble S4).
Our regional estimates of carbon fluxes by MIC-TEM are within the uncertainty range from other existing studies. For instance, Zhuang et al. (2003) estimated the region to be a sink of 0.9 Pg C yr−1 in extratropical ecosystems for the 1990s, which is similar to our estimation of 0.83 Pg C yr−1 by MIC-TEM. White et al. (2000) estimated that, during the 1990s, regional NEP above 50◦N is 0.46 Pg C yr−1 while Qian et al. (2010) estimated that NEP increased from 0 to 0.3 Pg C yr−1for the high-latitude region above 60◦N dur-ing last century and reached 0.25 Pg C yr−1during the 1990s. White et al. (2000) predicted that, from 1850 to 2100, the re-gion accumulated 134 Pg C in terrestrial ecosystems, in com-parison with our estimates of 77.6 Pg C with MIC-TEM and 89 Pg C with TEM. Our projection of a weakening sink dur-ing the second half of the 21st century is consistent with previous model studies (Schaphoff et al., 2013). Our pre-dicted trend of NEP is very similar to the finding of White et al. (2000), indicating that NEP increases from 0.46 Pg C yr−1
in the 2000s and reaches 1.5 Pg C yr−1in the 2070s, then de-creases to 0.6 Pg C yr−1in the 2090s.
[image:8.612.111.490.67.380.2]man-Figure 4.Predicted changes in carbon fluxes:(a, b)NPP,(c, d)RH, and(e, f)NEP for all land areas north of 45◦N in response to transient climate change under(a, c, e)the RCP 8.5 scenario and(b, d, f)the RCP 2.6 scenario with MIC-TEM and TEM 5.0. The decadal running mean is applied. The blue area represents the upper and lower bounds of simulations.
agement of agricultural lands (Cole et al., 1997), but Zhuang et al. (2003) showed that the changes in agricultural land use in northern high latitudes have been small.
The largest limitation on this study is that we have not explicitly considered the fire effects. Warming in the north-ern high latitudes could favor fire in its frequency, intensity, seasonality, and extent (Kasischke and Turetsky, 2006; John-stone and Kasischke, 2005; Soja et al., 2007; Randerson et al., 2006; Bond-Lamberty et al., 2007). Fire has profound effects on northern forest ecosystems, altering the N cycle and water and energy exchanges between the atmosphere and ecosystems. An increase in wildfires will destroy most of aboveground biomass and consume organic soils, result-ing in less carbon uptake by vegetation (Harden et al., 2000), leading to a net release of carbon in the short term. However, a suite of biophysical mechanisms of ecosystems, including post-fire increase in the surface albedo and rates of biomass accumulation, may, in turn, exert a negative feedback on cli-mate warming (Amiro et al., 2006; Goetz et al., 2007), fur-ther influencing the carbon exchanges between ecosystems and the atmosphere.
Moreover, carbon uptake in land ecosystems depends on new plant growth, which connects closely with the
availabil-ity of nutrients such as mineral nitrogen. Recent studies have shown that when soil nitrogen is in short supply, most ter-restrial plants form symbiotic relationships with fungi; hy-phae provide nitrogen to plants, and in return, plants provide sugar to fungi (Hobbie and Hobbie, 2008, 2006; Schimel and Hättenschwiler, 2007). This symbiotic relationship has not been considered in our current modeling, which may lead to a large uncertainty in our quantification of carbon and nitro-gen dynamics.
[image:9.612.98.500.71.374.2]Table 3.Increasing of SOC, vegetation carbon (VGC), soil organic nitrogen (SON), vegetation nitrogen (VGN) from 1900 to 2000, and total carbon storage during the 21st century predicted by two models with observed soil carbon data of three different depths under(a)RCP 2.6 and(b)RCP 8.5.
(a)Model Units: Pg Without (control) 30 cm 100 cm 300 cm
TEM 5.0 SOC/SON in 2000 604.2/27.0 429.5/19.0 689.3/31.6 1003.4/46.2 Increase in SOC during the 21st century 12.1 9.9 16.0 22.8 VGC/VGN in 2000 318.3/1.48 238.4/1.05 394.2/1.80 556.7/2.53 Increase in VGC during the 21st century 15.5 10.5 18.0 25.3 Increase in total carbon storage during the 21st
century
27.6 20.4 34.0 48.1
MIC-TEM SOC/SON in 2000 591.5/26.8 420.3/18.6 686.0/31.2 990.7/45.3 Increase in SOC during the 21st century −2.0 −1.2 −2.4 −2.9 VGC/VGN in 2000 309.7/1.42 230.1/1.02 374.4/1.71 548.6/2.45 Increase in VGC during the 21st century 0.4 0.5 0.2 −0.1 Increase in total carbon storage during the 21st
century
−1.6 −0.7 −2.2 −3.0
(b)Model Units: Pg Without (control) 30 cm 100 cm 300 cm
TEM 5.0 SOC/SON in 2000 610.2/27.9 431.9/19.1 693.8/31.8 1007.1/46.4 Increase in SOC during the 21st century 44.2 33.0 56.5 74.6 VGC/VGN in 2000 324.9/1.50 242.1/1.07 399.6/1.83 570.2/2.57 Increase in VGC during the 21st century 54.5 38.7 63.5 81.0 Increase in total carbon storage during the 21st
century
98.7 71.7 120.0 155.6
MIC-TEM SOC/SON in 2000 596.0/27.1 424.6/18.8 689.1/31.5 995.5/46.1 Increase in SOC during the 21st century 33.3 27.4 36.9 42.9 VGC/VGN in 2000 316.0/1.44 233.5/1.02 380.0/1.72 568.3/2.56 Increase in VGC during the 21st century 46.2 37.0 51.7 56.9 Increase in total carbon storage during the 21st
century
79.5 65.4 88.6 109.8
is a common, bet-hedging strategy used by microorganisms when environmental conditions limit their growth and repro-duction (Lennon and Jones, 2011). Microorganisms in dor-mancy are not able to drive biogeochemical processes such as soil CO2production, and, therefore, only active microor-ganisms should be involved in utilizing substrates in soils (Blagodatskaya and Kuzyakov, 2013). Many studies have in-dicated that soil respiration responses to environmental con-ditions are more closely associated with the active portion of microbial biomass than total microbial biomass (Hagerty et al., 2014; Schimel and Schaeffer, 2012; Steinweg et al., 2013). Thus, the ignorance of microbial dormancy could fail to distinguish between microbes with different physiological states, introducing uncertainties into our carbon estimation.
5 Conclusions
This study used a more detailed microbial biogeochemistry model to investigate the carbon dynamics in the region for the past and this century. Regional simulations using MIC-TEM indicated that, over the 20th century, the region is a sink of 77.6 Pg C. This sink could reach 79.5 Pg C under the RCP 8.5
the 20th century suggests that the more detailed microbial decomposition should be considered to adequately quantify C dynamics in northern high latitudes.
Data availability. All data used in this study are available from the authors upon request.
Supplement. The supplement related to this article is available online at: https://doi.org/10.5194/bg-15-5621-2018-supplement.
Author contributions. QZ designed the study. JZ conducted model development, simulation, and analysis. JZ and QZ wrote the paper.
Competing interests. The authors declare that they have no conflict of interest.
Acknowledgements. This research was supported by an NSF project (IIS-1027955), a DOE project (DE-SC0008092), and a NASA LCLUC project (NNX09AI26G) to Qianlai Zhuang. We acknowledge the Rosen High Performance Computing Center at Purdue for computing support. We thank the National Snow and Ice Data center for providing Global Monthly EASE-Grid Snow Water Equivalent data and the National Oceanic and Atmospheric Administration for North American Regional Reanalysis (NARR). We also acknowledge the World Climate Research Programme’s Working Group on Coupled Modeling Intercomparison Project CMIP5, and we thank the climate modeling groups for producing and making available their model output.
Edited by: Alexey V. Eliseev
Reviewed by: two anonymous referees
References
Allison, S. D. and Martiny, J. B.: Colloquium paper: re-sistance, resilience, and redundancy in microbial com-munities, P. Natl. Acad. Sci. USA, 105, 11512–11519, https://doi.org/10.1073/pnas.0801925105, 2008.
Allison, S. D., Wallenstein, M. D., and Bradford, M. A.: Soil-carbon response to warming dependent on microbial physiology, Nat. Geosci., 3, 336–340, https://doi.org/10.1038/ngeo846, 2010. Amiro, B. D., Orchansky, A. L., Barr, A. G., Black, T. A.,
Chambers, S. D., Chapin Iii, F. S., Goulden, M. L., Litvak, M., Liu, H. P., McCaughey, J. H., McMillan, A., and Ran-derson, J. T.: The effect of post-fire stand age on the bo-real forest energy balance, Agr. Forest Meteorol., 140, 41–50, https://doi.org/10.1016/j.agrformet.2006.02.014, 2006.
Barichivich, J., Briffa, K. R., Myneni, R. B., Osborn, T. J., Melvin, T. M., Ciais, P., Piao, S., and Tucker, C.: Large-scale variations in the vegetation growing season and annual cycle of atmospheric CO2at high northern latitudes from 1950 to 2011, Glob. Change Biol., 19, 3167–3183, https://doi.org/10.1111/gcb.12283, 2013.
Blagodatskaya, E. and Kuzyakov, Y.: Active microor-ganisms in soil: Critical review of estimation crite-ria and approaches, Soil Biol. Biochem., 67, 192–211, https://doi.org/10.1016/j.soilbio.2013.08.024, 2013.
Bond-Lamberty, B. and Thomson, A.: Temperature-associated in-creases in the global soil respiration record, Nature, 464, 579– 582, https://doi.org/10.1038/nature08930, 2010.
Bond-Lamberty, B., Peckham, S. D., Ahl, D. E., and Gower, S. T.: Fire as the dominant driver of central Cana-dian boreal forest carbon balance, Nature, 450, 89–92, https://doi.org/10.1038/nature06272, 2007.
Callaghan, T., Björn, L. O., Chernov, Y., Chapin, T., Christensen, T. R., Huntley, B., Ims, R., Jolly, D., Jonasson, S., Matveyeva, N., Panikov, N., Oechel, W., and Shaver, G.: Chapter 7: Arctic tundra and polar desert ecosystems, Arctic climate impact assessment, 243–352, ACIA Overview report. Cambridge University Press, 1020 pp., 2005.
Chapin, F. S. and Starfield, A. M.: Time lags and novel ecosystems in response to transient climatic change in arctic Alaska, Climatic Change, 35, 449–461, 1997.
Christensen, J. H. and Christensen, O. B.: A summary of the PRUDENCE model projections of changes in European cli-mate by the end of this century, Climatic Change, 81, 7–30, https://doi.org/10.1007/s10584-006-9210-7, 2007.
Ciais, P., Sabine, C., Bala, G., Bopp, L., Brovkin, V., Canadell, J., Chhabra, A., DeFries, R., Galloway, J., Heimann, M., Jones, C., Quéré, C. L., Myneni, R. B., Piao, S., and Thornton, P.: Car-bon and other biogeochemical cycles, Climate change 2013: the physical science basis. Contribution of Working Group I to the Fifth Assessment Report of the Intergovernmental Panel on Cli-mate Change, 465–570, 2013.
Cole, C. V., Duxbury, J., Freney, J., Heinemeyer, O., Minami, K., Mosier, A., Paustian, K., Rosenberg, N., Sampson, N., Sauer-beck, D., and Zhao, Q.: Global estimates of potential mitigation of greenhouse gas emissions by agriculture, Nutr. Cycl. Agroe-cosys., 49, 221–228, 1997.
Cook, F. J. and Orchard, V. A.: Relationships between soil respi-ration and soil moisture, Soil Biol. Biochem., 40, 1013–1018, https://doi.org/10.1016/j.soilbio.2007.12.012, 2008.
Davidson, E. A. and Janssens, I. A.: Temperature sensitivity of soil carbon decomposition and feedbacks to climate change, Nature, 440, 165–173, https://doi.org/10.1038/nature04514, 2006. Davidson, E. A., Trumbore, S. E., and Amundson, R.:
Biogeochem-istry: soil warming and organic carbon content, Nature, 408, 789–790, https://doi.org/10.1038/35048672, 2000.
Dong, Y. and Somero, G. N.: Temperature adaptation of cytosolic malate dehydrogenases of limpets (genus Lottia): differences in stability and function due to minor changes in sequence correlate with biogeographic and vertical distributions, J. Exp. Biol., 212, 169–177, https://doi.org/10.1242/jeb.024505, 2009.
Duan, Q., Sorooshian, S., and Gupta, V. K.: Optimal use of the SCE-UA global optimization method for calibrating watershed mod-els, J. Hydrol., 158, 265–284, 1994.
Esteban G. Jobbágy, and Jackson, R. B.: The vertical distribution of soil organic carbon and its relation to climate and vegetation, Ecol. Appl., 10, 423–436, 2000.
German, D. P., Marcelo, K. R. B., Stone, M. M., and Allison, S. D.: The Michaelis-Menten kinetics of soil extracellular en-zymes in response to temperature: a cross-latitudinal study, Glob. Change Biol., 18, 1468–1479, https://doi.org/10.1111/j.1365-2486.2011.02615.x, 2012.
Goetz, S. J., Mack, M. C., Gurney, K. R., Randerson, J. T., and Houghton, R. A.: Ecosystem responses to recent climate change and fire disturbance at northern high latitudes: observations and model results contrasting northern Eurasia and North Amer-ica, Environ. Res. Lett., 2, 045031, https://doi.org/10.1088/1748-9326/2/4/045031, 2007.
Hagerty, S. B., van Groenigen, K. J., Allison, S. D., Hungate, B. A., Schwartz, E., Koch, G. W., Kolka, R. K., and Dijk-stra, P.: Accelerated microbial turnover but constant growth ef-ficiency with warming in soil, Nat. Clim. Change, 4, 903–906, https://doi.org/10.1038/nclimate2361, 2014.
Hansen, J., Sato, M., Ruedy, R., Lo, K., Lea, D. W., and Medina-Elizade, M.: Global temperature change, P. Natl. Acad. Sci. USA, 103, 14288–14293, https://doi.org/10.1073/pnas.0606291103, 2006.
Hanson, P. J., Edwards, N. T., Garten, C. T., and Andrews, J. A.: Separating root and soil microbial contributions to soil respira-tion: A review of methods and observations, Biogeochemistry, 48, 115–146, 2000.
Hao, G., Zhuang, Q., Zhu, Q., He, Y., Jin, Z., and Shen, W.: Quantifying microbial ecophysiological effects on the carbon fluxes of forest ecosystems over the conterminous United States, Climatic Change, 133, 695–708, https://doi.org/10.1007/s10584-015-1490-3, 2015.
Harden, J. W., Trumbore, S. E., Stocks, B. J., Hirsch, A., Gower, S. T., O’neill, K. P., and Kasischke, E. S.: The role of fire in the boreal carbon budget, Glob. Change Biol., 6, 174–184, 2000. Harris, I., Jones, P. D., Osborn, T. J., and Lister, D. H.:
Up-dated high-resolution grids of monthly climatic observations – the CRU TS3.10 Dataset, Int. J. Climatol., 34, 623–642, https://doi.org/10.1002/joc.3711, 2014.
Hayes, D. J., Kicklighter, D. W., McGuire, A. D., Chen, M., Zhuang, Q., Yuan, F., Melillo, J. M., and Wullschleger, S. D.: The impacts of recent permafrost thaw on land–atmosphere greenhouse gas exchange, Environ. Res. Lett., 9, 045005, https://doi.org/10.1088/1748-9326/9/4/045005, 2014.
He, Y., Yang, J., Zhuang, Q., Harden, J. W., McGuire, A. D., Liu, Y., Wang, G., and Gu, L.: Incorporating micro-bial dormancy dynamics into soil decomposition models to improve quantification of soil carbon dynamics of northern temperate forests, J. Geophys. Res.-Biogeo., 120, 2596–2611, https://doi.org/10.1002/2015jg003130, 2015.
Hobbie, J. E. and Hobbie, E. A.: 15N in symbiotic fungi and plants estimates nitrogen and carbon flux rates in Arctic tundra, Ecol-ogy, 87, 816–822, 2006.
Hobbie, E. A. and Hobbie, J. E.: Natural Abundance of 15N in Nitrogen-Limited Forests and Tundra Can Estimate Nitrogen Cy-cling Through Mycorrhizal Fungi: A Review, Ecosystems, 11, 815–830, https://doi.org/10.1007/s10021-008-9159-7, 2008. Holland, M. M. and Bitz, C. M.: Polar amplification of
cli-mate change in coupled models, Clim. Dynam., 21, 221–232, https://doi.org/10.1007/s00382-003-0332-6, 2003.
Houghton, R. A.: Balancing the Global Carbon Bud-get, Annu. Rev. Earth Pl. Sc., 35, 313–347, https://doi.org/10.1146/annurev.earth.35.031306.140057, 2007. Johnstone, J. F. and Kasischke, E. S.: Stand-level effects of soil
burn severity on postfire regeneration in a recently burned black spruce forest, Can. J. Forest Res., 35, 2151–2163, https://doi.org/10.1139/x05-087, 2005.
Kasischke, E. S. and Turetsky, M. R.: Recent changes in the fire regime across the North American boreal re-gion – Spatial and temporal patterns of burning across Canada and Alaska, Geophys. Res. Lett., 33, L09703, https://doi.org/10.1029/2006gl025677, 2006.
Knorr, W.: Annual and interannual CO2exchanges of the terrestrial biosphere: process-based simulations and uncertainties, Global Ecol. Biogeogr., 9, 225–252, 2000.
Lawrence, D. M., Oleson, K. W., Flanner, M. G., Thornton, P. E., Swenson, S. C., Lawrence, P. J., Zeng, X., Yang, Z.-L., Levis, S., Sakaguchi, K., Bonan, G. B., and Slater, A. G.: Parameterization improvements and functional and structural advances in Version 4 of the Community Land Model, J. Adv. Model. Earth Sy., 3, M03001, https://doi.org/10.1029/2011ms000045, 2011. Lennon, J. T. and Jones, S. E.: Microbial seed banks: the
ecologi-cal and evolutionary implications of dormancy, Nature reviews, Microbiology, 9, 119–130, https://doi.org/10.1038/nrmicro2504, 2011.
Lloyd, A. H.: Ecological histories from Alaskan tree lines provide insight into future change, Ecology, 86, 1687–1695, 2005. López-Urrutia, A., and Morán, X. A. G.: Resource limitation of
bac-terial production distorts the temperature dependence of oceanic carbon cycling, Ecology, 88, 817–822, 2007.
Mack, M. C., Schuur, E. A. G., Bret-Harte, M. S., Shaver, G. R., and Chapin III, F. S. C.: Ecosystem carbon storage in arctic tundra re-duced by long-term nutrient fertilization, Nature, 431, 440–443, 2004.
McGuire, A. D. and Hobbie, J. E.: Global climate change and the equilibrium responses of carbon storage in arctic and subarctic regions, in: Modeling the Arctic system: A workshop report on the state of modeling in the Arctic System Science program, 53– 54, 1997.
McGuire, A. D., Melillo, J. M., Joyce, L. A., Kicklighter, D. W., Grace, A. L., Moore III, B. M., and Vorosmarty, C. J.: Interac-tions between carbon and nitrogen dynamics in estimating net primary productivity for potential vegetation in North America, Global Biogeochem. Cy., 6, 101–124, 1992.
McGuire, A. D., Melillo, J. M., Kicklighter, D. W., and Joyce, L. A.: Equilibrium responses of soil carbon to climate change: Em-pirical and process-based estimates, J. Biogeogr., 22, 785–796, 1995.
McGuire, A. D., Anderson, L. G., Christensen, T. R., Dallimore, S., Guo, L., Hayes, D. J., Heimann, M., Lorenson, T. D., Macdon-ald, R. W., and Roulet, N.: Sensitivity of the carbon cycle in the Arctic to climate change, Ecol. Monogr., 79, 523–555, 2009. McGuire, A. D., Christensen, T. R., Hayes, D., Heroult, A.,
Melillo, J. M., McGuire, A. D., Kicklighter, D. W., Moore III, B., Vorosmarty, C. J., and Schloss, A. L.: Global climate change and terrestrial net primary production, Nature, 363, 234–240, https://doi.org/10.1038/363234a0, 1993.
Oechel, W. C., Vourlitis, G. L., Hastings, S. J., Zulueta, R. C., Hinz-man, L., and Kane, D.: Acclimation of ecosystem CO2exchange in the Alaskan Arctic in response to decadal climate warming, Nature, 406, 978–981, https://doi.org/10.1038/35023137, 2000. Pan, Y., McGuire, A. D., Melillo, J. M., Kicklighter, D. W., Sitch,
S., and Prentice, I. C.: A biogeochemistry-based dynamic vege-tation model and its application along a moisture gradient in the continental United States, J. Vegetation Sci., 13, 369–382, 2002. Parton, W. J., Ojima, D. S., Cole, C. V., and Schimel, D. S.: A gen-eral model for soil organic matter dynamics: sensitivity to litter chemistry, texture and management, SSSA Spec. Publ., 39, 147– 167, 1994.
Potter, C. S., Randerson, J. T., Field, C. B., Matson, P. A., Vitousek, P. M., Mooney, H. A., and Klooster, S. A.: Terrestrial ecosystem production: a process model based on global satellite and surface data, Global Biogeochem. Cy., 7, 811–841, 1993.
Qian, H., Joseph, R., and Zeng, N.: Enhanced terrestrial car-bon uptake in the Northern High Latitudes in the 21st century from the Coupled Carbon Cycle Climate Model Intercompari-son Project model projections, Glob. Change Biol., 16, 641–656, https://doi.org/10.1111/j.1365-2486.2009.01989.x, 2010. Raich, J. W. and Schlesinger, W. H.: The global carbon dioxide flux
in soil respiration and its relationship to vegetation and climate, Tellus B, 44, 81–99, 1992.
Randerson, J. T., Liu, H., Flanner, M. G., Chambers, S. D., Jin, Y., Hess, P. G., Pfister, G., Mack, M. C., Treseder, K. K., Welp, L. R., Chapin, F. S., Harden, J. W., Goulden, M. L., Lyons, E., Neff, J. C., Schuur, E. A. G., and Zender, C. S.: The impact of boreal forest fire on climate warming, Science, 314, 1130–1132, 2006. Running, S. W. and Coughlan, J. C.: A general model of forest
ecosystem processes for regional applications I. Hydrologic bal-ance, canopy gas exchange and primary production processes, Ecol. Model., 42, 125–154, 1988.
Schaphoff, S., Heyder, U., Ostberg, S., Gerten, D., Heinke, J., and Lucht, W.: Contribution of permafrost soils to the global carbon budget, Environ. Res. Lett., 8, 014026, https://doi.org/10.1088/1748-9326/8/1/014026, 2013.
Schimel, J. P. and Weintraub, M. N.: The implications of exoen-zyme activity on microbial carbon and nitrogen limitation in soil: a theoretical model, Soil Biol. Biochem., 35, 549–563, https://doi.org/10.1016/s0038-0717(03)00015-4, 2003.
Schimel, J. P. and Hättenschwiler, S.: Nitrogen transfer between de-composing leaves of different N status, Soil Biol. Biochem., 39, 1428–1436, https://doi.org/10.1016/j.soilbio.2006.12.037, 2007. Schimel, J. P. and Schaeffer, S. M.: Microbial control over carbon cycling in soil, Front. Microbiol., 3, 348, https://doi.org/10.3389/fmicb.2012.00348, 2012.
Schmidt, M. W., Torn, M. S., Abiven, S., Dittmar, T., Guggen-berger, G., Janssens, I. A., Kleber, M., Kogel-Knabner, I., Lehmann, J., Manning, D. A., Nannipieri, P., Rasse, D. P., Weiner, S., and Trumbore, S. E.: Persistence of soil or-ganic matter as an ecosystem property, Nature, 478, 49–56, https://doi.org/10.1038/nature10386, 2011.
Schuur, E. A. G., Bockheim, J., Canadell, J. G., Euskirchen, E., Field, C. B., Goryachkin, S. V., Hagemann, S., Kuhry, P., Lafleur,
P. M., Lee, H., and Mazhitova, G.: Vulnerability of permafrost carbon to climate change: Implications for the global carbon cy-cle, BioScience, 58, 701–714, 2008.
Serreze, M. C. and Francis, J. A.: The Arctic on the fast track of change, Weather, 61, 65–69, 2006.
Soja, A. J., Tchebakova, N. M., French, N. H. F., Flan-nigan, M. D., Shugart, H. H., Stocks, B. J., Sukhinin, A. I., Parfenova, E. I., Chapin, F. S., and Stackhouse, P. W.: Climate-induced boreal forest change: Predictions ver-sus current observations, Global Planet. Change, 56, 274–296, https://doi.org/10.1016/j.gloplacha.2006.07.028, 2007.
Somero, G. N.: Adaptation of enzymes to temperature: searching for basic “strategies”, Comp. Biochem. Phys. B, 139, 321–333, https://doi.org/10.1016/j.cbpc.2004.05.003, 2004.
Steinweg, J. M., Plante, A. F., Conant, R. T., Paul, E. A., and Tanaka, D. L.: Patterns of substrate utilization during long-term incubations at different temperatures, Soil Biol. Biochem., 40, 2722–2728, https://doi.org/10.1016/j.soilbio.2008.07.002, 2008. Steinweg, J. M., Dukes, J. S., Paul, E. A., and Wallen-stein, M. D.: Microbial responses to multi-factor climate change: effects on soil enzymes, Front. Microbiol., 4, 146, https://doi.org/10.3389/fmicb.2013.00146, 2013.
Stone, M. M., Weiss, M. S., Goodale, C. L., Adams, M. B., Fernandez, I. J., German, D. P., and Allison, S. D.: Temper-ature sensitivity of soil enzyme kinetics under N-fertilization in two temperate forests, Glob. Change Biol., 18, 1173–1184, https://doi.org/10.1111/j.1365-2486.2011.02545.x, 2012. Stow, D. A., Hope, A., McGuire, D., Verbyla, D., Gamon, J.,
Huemmrich, F., Houston, S., Racine, C., Sturm, M., Tape, K., Hinzman, L., Yoshikawa, K., Tweedie, C., Noyle, B., Sila-paswan, C., Douglas, D., Griffith, B., Jia, G., Epstein, H., Walker, D., Daeschner, S., Petersen, A., Zhou, L., and Myneni, R.: Remote sensing of vegetation and land-cover change in Arc-tic Tundra Ecosystems, Remote Sens. Environ., 89, 281–308, https://doi.org/10.1016/j.rse.2003.10.018, 2004.
Sturm, M., Racine, C., and Tape, K.: Climate change: increas-ing shrub abundance in the Arctic, Nature, 411, 546–547, https://doi.org/10.1038/35079180, 2001.
Tang, J. and Zhuang, Q.: Equifinality in parameterization of process-based biogeochemistry models: A significant uncertainty source to the estimation of regional car-bon dynamics, J. Geophys. Res.-Biogeo., 113, G04010, https://doi.org/10.1029/2008jg000757, 2008.
Tape, K. E. N., Sturm, M., and Racine, C.: The evidence for shrub expansion in Northern Alaska and the Pan-Arctic, Glob. Change Biol., 12, 686–702, https://doi.org/10.1111/j.1365-2486.2006.01128.x, 2006.
Tarnocai, C., Canadell, J. G., Schuur, E. A. G., Kuhry, P., Mazhi-tova, G., and Zimov, S.: Soil organic carbon pools in the north-ern circumpolar permafrost region, Global Biogeochem. Cy., 23, GB2023, https://doi.org/10.1029/2008gb003327, 2009. Todd-Brown, K. E. O., Hopkins, F. M., Kivlin, S. N., Talbot, J. M.,
and Allison, S. D.: A framework for representing microbial de-composition in coupled climate models, Biogeochemistry, 109, 19–33, https://doi.org/10.1007/s10533-011-9635-6, 2011. Todd-Brown, K. E. O., Randerson, J. T., Post, W. M., Hoffman, F.
models and comparison with observations, Biogeosciences, 10, 1717–1736, https://doi.org/10.5194/bg-10-1717-2013, 2013. White, A., Cannell, M. G. R., and Friend, A. D.: The high-latitude
terrestrial carbon sink: a model analysis, Glob. Change Biol., 6, 227–245, 2000.
Wieder, W. R., Bonan, G. B., and Allison, S. D.: Global soil carbon projections are improved by modelling mi-crobial processes, Nat. Clim. Change, 3, 909–912, https://doi.org/10.1038/nclimate1951, 2013.
Zhuang, Q., Romanovsky, V. E., and McGuire, A. D.: Incorporation of a permafrost model into a large-scale ecosystem model: Eval-uation of temporal and spatial scaling issues in simulating soil thermal dynamics, J. Geophys. Res.-Atmos., 106, 33649–33670, https://doi.org/10.1029/2001jd900151, 2001.
Zhuang, Q., McGuire, A. D., O’Neill, K. P., Harden, J. W., Romanovsky, V. E., and Yarie, J.: Modeling soil ther-mal and carbon dynamics of a fire chronosequence in in-terior Alaska, J. Geophys. Res., 108, FFR 3-1-FFR-3-26, https://doi.org/10.1029/2001jd001244, 2002.
Zhuang, Q., He, J., Lu, Y., Ji, L., Xiao, J., and Luo, T.: Car-bon dynamics of terrestrial ecosystems on the Tibetan Plateau during the 20th century: an analysis with a process-based biogeochemical model, Global Ecol. Biogeogr., 19, 649–662, https://doi.org/10.1111/j.1466-8238.2010.00559.x, 2010.
Zhuang, Q., Chen, M., Xu, K., Tang, J., Saikawa, E., Lu, Y., Melillo, J. M., Prinn, R. G., and McGuire, A. D.: Response of global soil consumption of atmospheric methane to changes in atmospheric climate and nitrogen deposition, Global Biogeochem. Cy., 27, 650–663, https://doi.org/10.1002/gbc.20057, 2013.
Zhuang, Q., Zhu, X., He, Y., Prigent, C., Melillo, J. M., McGuire, D. A., Prinn, R. G., and Kicklighter, D. W.: Influence of changes in wetland inundation extent on net fluxes of carbon dioxide and methane in northern high latitudes from 1993 to 2004, Environ. Res. Lett., 10, 095009, https://doi.org/10.1088/1748-9326/10/9/095009, 2015.