RESEARCH NOTE
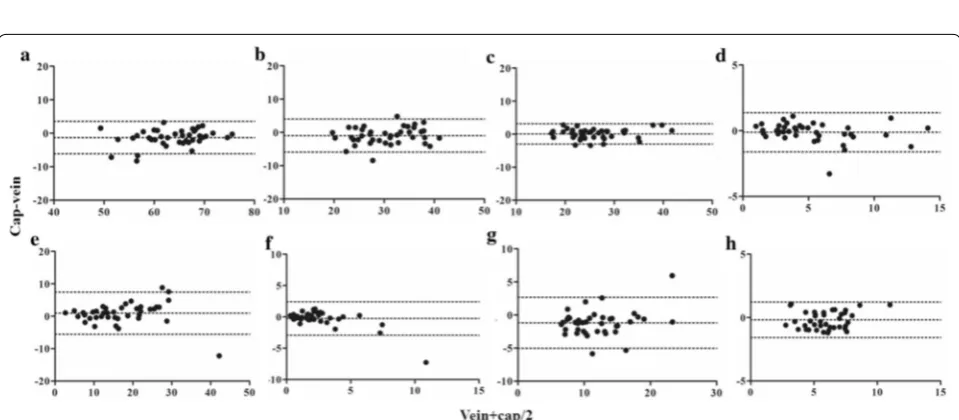
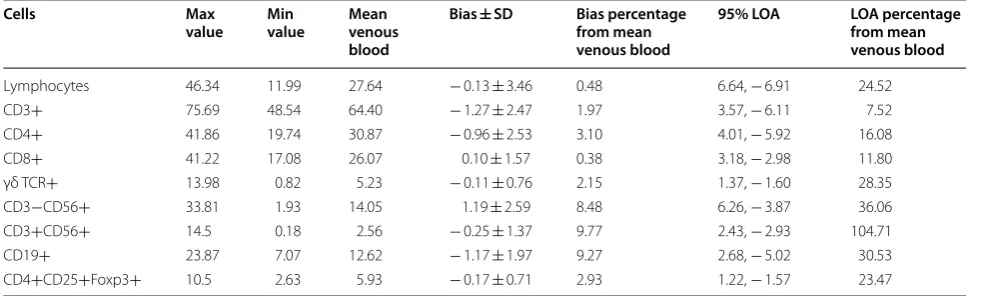
Capillary blood as an alternative specimen
for enumeration of percentages of lymphocyte
subsets
Supanart Srisala
1, Nutkridta Pongsakul
2, Thiantip Sahakijpicharn
2, Suradej Hongeng
2,
Somchai Chutipongtanate
2*and Nopporn Apiwattanakul
2*Abstract
Objective: Capillary blood has been increasingly used in point-of-care setting for clinical monitoring in immunol-ogy and infectious diseases. We explored whether percentages of lymphocyte subsets (T-cells; CD3+, helper T-cells; CD4+, cytotoxic T-cells; CD8+, B-cells; CD19+, NK cells; CD56+, gamma delta T-cells, and regulatory T-cells) with regard to total lymphocyte count from capillary and venous blood of healthy volunteers were in good agreement. Results: All percentages of lymphocyte subsets with regard to total lymphocyte count from capillary blood were significantly correlated with those from venous blood (r ≥ 0.9 for every cell type). However, Bland–Altman plots showed high agreement between capillary and venous samples only in those of CD3+, CD4+, and CD8+ cells (limit of agreement percentages from mean venous blood < 20%). However, the agreement of percentages of other lymphocyte subsets from venous and capillary blood was mediocre. We concluded that capillary blood could be used as an alternative for venous blood to determine percentages of CD3+, CD4+, and CD8+ cells with regard to total lymphocyte count.
Keywords: Point-of-care, Lymphocyte subsets, Staining and labeling, Flow cytometry, Correlation study
© The Author(s) 2019. This article is distributed under the terms of the Creative Commons Attribution 4.0 International License (http://creat iveco mmons .org/licen ses/by/4.0/), which permits unrestricted use, distribution, and reproduction in any medium, provided you give appropriate credit to the original author(s) and the source, provide a link to the Creative Commons license, and indicate if changes were made. The Creative Commons Public Domain Dedication waiver (http://creativecommons.org/ publicdomain/zero/1.0/) applies to the data made available in this article, unless otherwise stated.
Introduction
Lymphocyte subset enumeration by flow cytometry is widely used in the monitoring of many immunologi-cal and infectious diseases [1–4]. Patients with human immunodeficiency virus infection and those who have undergone stem cell transplantation require frequent lymphocyte subset enumerations to monitor the pro-gression of diseases and to guide treatment [2, 5], hence, several venipuncture is required. Since venipuncture can be difficult in young infants or patients with fragile veins, therefore, it would be more convenient if capillary blood can be used. Capillary blood has been increasingly used as a point-of-care testing because less blood vol-ume is needed and the technique used to obtain blood
is simple [6]. A previous study found that numbers of T-cells (CD3+), helper T-cells (CD4+), cytotoxic T-cells
(CD8+), B-cells (CD19+), and NK-cells (CD56+) from
both venous and capillary blood were highly correlated [7]. However, discrepancy in the absolute numbers of some lymphocytes from venous and capillary samples were also noted [7, 8]. Furthermore, the numbers of regulatory T-cells (CD4+CD25+FoxP3+) and gamma
delta (γδ) T-cells have not been compared using both techniques evaluated. Currently, these two lymphocyte subsets are increasingly recognized in immunology filed. Regulatory T-cells are involved in pathogenesis of several autoimmune diseases [9, 10], and sepsis [11]. Changes in γδ T-cells are associated with infection or the activity of inflammatory diseases [12–15]. If capillary blood is to be used for monitoring of these cells, it is essential to deter-mine whether the numbers of these cells from capillary blood can well represent those from venous blood which is served as the current gold standard. In this study, we
Open Access
compared percentages of lymphocyte subsets; CD3+, CD4+, CD8+, CD19+, CD56+, CD3+CD56+ (NKT-cells), regulatory T-cells and γδ T-cells, with regard to total lymphocyte count in both venous and capillary blood samples from healthy adults. We also analyzed the agreement of these lymphocyte subset percentages between capillary and venous blood samples by using the well-established Bland–Altman method which is widely used to determine the agreement between two assays [16].
Main text
Subjects and blood samples
This study protocol was approved by the Research Ethical Committee of Ramathibodi Hospital, Mahidol University (ID 09-59-23), and subjects provided written informed consents. Forty healthy adult volunteers were enrolled. The health status of the volunteers was confirmed after complete blood counts were done and a medical exami-nation by a medical doctor revealed that there was no inflammatory process in the volunteers. Non-fasting venous and capillary blood samples were collected from each volunteer. Venous blood were collected by veni-puncture from the right cubital fossae, and capillary blood was collected from the tip of the right ring or mid-dle fingers by a standard lancet (the OneTouch® Lancing Device; Lifescan, Inc., CA, USA) with the first drop of blood being discarded to eliminate the contamination of tissue fluid [17]. Blood samples were collected into potas-sium ethylenediamine tetraacetate-containing tubes (BD Microtainer, Franklin Lakes, NJ, USA). The specimens were maintained at room temperature and were pro-cessed for immunophenotyping within 2 h.
Immunophenotyping by flow cytometry
Lymphocyte subset phenotypes were determined by direct immunofluorescence staining with mononuclear antibodies (eBioscience Inc. San Diego, CA, USA) as following:
Panel 1: anti-CD3-FITC (0.2 μg/μL), Anti-CD4-APC (0.012 μg/μL), anti-CD8-APC-efluor780 (0.025 μg/ μL), anti-γδ TCR-PE (0.8 μg/μL), and anti-CD45-PECy7 (0.05 μg/μL).
Panel 2: anti-CD3-FITC (0.2 μg/μL), anti-CD19-APC (0.025 μg/μL), anti-CD56-PE (0.025 μg/μL), and anti-CD45-PECy7 (0.05 μg/μL).
Panel 3: anti-CD4-APC (0.012 μg/μL), anti-CD25-PECy7 (0.05 μg/μL).
Ten microliters of blood samples were incubated in darkness with the antibody (1:100 dilution) of each panel for 15 min at room temperature. Samples incubated with
the antibody of panels 1 and 2 were then mixed with 100 μL of red blood cell lysing solution (Lysing Solution, BD Bioscience. San Jose, CA, USA) for 5 min at room temperature. The samples were then washed and were subjected to flow cytometry. Samples incubated with the antibody of panel 3 were fixed and permeabilized in 100 μL of Fixation/Permeabilization solution (eBio-science Inc. San Diego, CA, USA) for 30 min at room temperature. Samples were then washed with permeabili-zation buffer (eBioscience Inc. San Diego, CA, USA), and incubated in 25 μL of permeabilization buffer containing 1:50 dilution of Anti-Foxp3-FITC (0.1 μg/μL) for 45 min at room temperature. After being washed, the samples were subjected to flow cytometry (BD FACSVerse; BD Biosciences, San Jose, CA, USA, 2012).
Cells were analyzed by using Flowjo software version 10 (Flowjo, LLC; Ashland, OR, USA). The gating strat-egy for each cell type is summarized in Additional file 1: Table S1. Since our study did not use a single platform approach, absolute cell count for each lymphocyte sub-set is not available, and only the percentages of lympho-cyte subsets with regard to total lympholympho-cyte count will be presented.
Statistical analysis
Statistical analysis was performed with SPSS version 20 (SPSS, Inc., Chicago, IL, USA). Data were first tested with Shapiro–Wilk test for normality. The differences of per-centages of lymphocyte subsets with regard to total lym-phocyte count between capillary and venous blood with normal distribution were analyzed by 2-tailed paired t-test and those without normal distribution were ana-lyzed by Wilcoxon Signed Ranks. The type I error rate (alpha level) of < 0.05 is set as statistical significance. Correlations between percentages of lymphocyte sub-sets from venous and capillary blood were analyzed by Pearson correlation. To determine agreement of percent-ages of lymphocyte subsets from venous and capillary blood, Bland–Altman analyses were performed. Dif-ferences between each pair of measurements (capillary value − venous value) were plotted on the vertical axis against the averages of the pair (capillary value + venous value)/2 on the horizontal axis [16]. Bias was the differ-ence of results between capillary and venous samples. Limit of agreement (LOA) was within two standard devi-ations from the mean bias [16].
Results
Additional file 2: Table S2). The percentages of CD3+, CD4+, and CD19+ cells from venous blood were slightly higher and that of CD56+ was slightly lower than those from capillary blood, the magnitudes of these differences were < 10% between each other. The percentages of other cell subsets did not significantly differ between venous and capillary blood. Pearson correlation coefficients for the percentages of all lymphocyte subsets from capillary and venous blood were all > 0.8 (Fig. 1a–h).
Bland–Altman bias plots were constructed by plotting the differences between the percentages of cells from venous and capillary blood against the mean percent-age values of the two methods (Fig. 2). Table 1 shows the Bland–Altman parameters, including ranges, bias val-ues, and limits of agreement (LOA). The percentages of LOA from mean venous values of CD3+, CD4+, CD8+
were < 20%, while those of γδ T-cells, regulatory T-cells, CD19+, and CD56+ cells were in the range of 20–40%.
Fig. 1 Correlations of percentages of lymphocyte subsets between venous and capillary blood. Pearson correlation analyses of percentages of lymphocyte subsets from venous and capillary blood were performed; a CD3+ cells, b CD4+ cells, c CD8+ cells, d γδ TCR+ cells, e CD3−CD56+ (NK−) cells, f CD3+CD56+ (NKT−) cells, g CD19+ (B−) cells, and h CD4+CD25+FoxP3+ (Treg) cells. r represents Pearson r value. 95% confidence intervals are provided in the parentheses. The correlations of all cell types were statistically significant difference (P < 0.05)
Fig. 2 Bland–Altman plots for agreement of percentages of lymphocyte subsets between venous and capillary blood. Bland–Altman analyses of percentages of lymphocyte subsets from venous and capillary blood were performed; a CD3+ cells, b CD4+ cells, c CD8+ cells, d γδ TCR+ cells,
[image:3.595.58.543.221.414.2] [image:3.595.58.538.466.676.2]The LOA of CD3+CD56+ cells showed the highest
value, exceeding 100%. Individual data of percentages of lymphocyte subset are provided in Additional file 3 and parameters derived from Bland Altman analysis of each lymphocyte subset are provided in Additional file 4.
Discussion
In this study, the percentages of lymphocyte subsets with regard to total lymphocyte count from capillary and venous blood were comparable and highly correlated. Although there were statistically significant differences in CD3+, CD4+, CD19+, and CD56+ cells, the
magni-tudes of differences were sufficiently subtle (< 10%) that they are unlikely to exhibit any clinical significance. We further analyzed this agreement by using the Bland–Alt-man method. Currently, the appropriate cut-off LOA percentages from mean venous blood of lymphocyte subsets to indicate that the results from capillary and venous blood are in good agreement if the LOA values calculated are below these cut-off values are still not known. The ranges of acceptable LOA may be extrapo-lated from some closely reextrapo-lated studies. The Clinical Lab-oratory Improvement Amendments of 1988 (CLIA-88) regulations designated that total white blood cell count should not fall outside 15% of the reference value [19]. Hollis et al. [18] found that the LOA percentages from the mean venous values of total white blood cell, gran-ulocyte, and lymphocyte, were all < 20%, while those of monocyte count was 40%. In our study, LOA percentages from the mean venous blood of CD3+ and CD8+ cells
were < 15%; that of CD4+ cells was 16%. This was quite
similar to the study of Sitoe et al. [20] who reported the LOA percentage of CD4+ cells from mean venous blood
of 18%. Our study suggests that capillary blood is a good alternative for venous blood to determine the percent-ages of CD3+, CD4+, and CD8+ cells with regard to
total lymphocyte count, based on the fact that the LOA percentages of these cells were quite low. However, judi-cious use of capillary blood for monitoring of γδ T-cells, regulatory T-cells, NK-cells, and B-cells is suggested, as the LOA percentages of these cells were quite high. Cap-illary blood should not be used for monitoring of NKT cells because the LOA percentage of this cell was very high (LOA 104%).
In previous studies, the results of agreement of cell enumeration between capillary and venous blood were varied. Yang et al. [8] demonstrated that the total and large leukocyte counts were significantly higher in capil-lary than in venous blood. Cracknell et al. [7] found that the numbers of most lymphocyte subsets were higher in capillary blood. However, these studies did not use Bland–Altman method to evaluate the agreement. Fur-thermore, there have been no studies showing the agree-ment of percentages of γδ T-cells and regulatory T-cells between capillary and venous blood. This study showed that the percentages of these two cell subsets did not dif-fer between the two sources and the correlation coeffi-cients of the percentages of these 2 cells between venous and capillary blood were > 0.9. However, the percentages of LOA from Bland–Altman bias plots for these 2 cells were slightly high when compared with those of CD3+,
CD4+, and CD8+ cells; 28 and 23%, respectively. This
emphasizes that if only the correlation coefficients were considered, the results could be misleading. This under-scores the importance of using Bland–Altman bias plots to evaluate agreement of a new method with the standard
Table 1 Bland–Altman parameters for agreement of percentages of lymphocyte and lymphocyte subsets between venous and capillary blood
SD standard deviation, LOA limit of agreement, TCR T cell receptor
Cells Max
value Min value Mean venous blood
Bias ± SD Bias percentage from mean venous blood
95% LOA LOA percentage from mean venous blood
Lymphocytes 46.34 11.99 27.64 − 0.13 ± 3.46 0.48 6.64, − 6.91 24.52
CD3+ 75.69 48.54 64.40 − 1.27 ± 2.47 1.97 3.57, − 6.11 7.52
CD4+ 41.86 19.74 30.87 − 0.96 ± 2.53 3.10 4.01, − 5.92 16.08
CD8+ 41.22 17.08 26.07 0.10 ± 1.57 0.38 3.18, − 2.98 11.80
γδ TCR+ 13.98 0.82 5.23 − 0.11 ± 0.76 2.15 1.37, − 1.60 28.35
CD3−CD56+ 33.81 1.93 14.05 1.19 ± 2.59 8.48 6.26, − 3.87 36.06
CD3+CD56+ 14.5 0.18 2.56 − 0.25 ± 1.37 9.77 2.43, − 2.93 104.71
CD19+ 23.87 7.07 12.62 − 1.17 ± 1.97 9.27 2.68, − 5.02 30.53
[image:4.595.55.546.113.261.2]method. Several reasons may explain the discrepancies in the percentages of lymphocyte subsets between the two sources. Squeezing the fingertip before puncture [8, 21] or the presence of tissue injury, which can induce adhe-sion of lymphocytes to capillary bed [22], may contribute to this discrepancy. This emphasizes the importance of practicing good techniques in obtaining capillary blood samples. Injury from fingertip puncture should be as minimal as possible by using appropriate lancets. Good blood flow after puncture should be obtained to mini-mize the need of squeezing.
The strength of our study is that we used Bland–Alt-man analysis to determine the agreement of percentages of lymphocyte subsets from venous and capillary blood. To our knowledge, apart from percentage of CD4+
T-cells [20], the agreement of percentages of other lym-phocyte subsets has not been previously reported. Our results showed that capillary blood could be used as an alternative for venous blood to determine percentages of CD3+, CD4+, and CD8+ cells with regard to total lymphocyte count. These data will support point-of-care assays using capillary blood as samples [23, 24]. Because mobile flow cytometers are currently available [25], sam-ples from capillary blood should facilitate point-of-care testing purposes for enumeration of CD3+, CD4+, and CD8+ cells which are frequently monitored in many dis-eases. However, additional studies are warranted before capillary blood can accurately be used as an alternative for venous blood for enumeration of percentages of γδ T-cells, NK-cells, B-cells, and regulatory T-cells as the agreement of the percentages of these cells with regard to total lymphocyte count is still mediocre.
Limitations
• Study was performed within a small number of sub-jects, and repeated measurements were not per-formed.
• Study did not include various subject categorizations based on age, sex, and underlying hematological or immunological diseases.
• Absolute lymphocyte count could not obtain from this study as we did not use a single platform approach. Complete blood count is needed to enu-merate the total count of each lymphocyte subset.
Application of capillary blood for lymphocyte subset enumeration with mobile flow cytometer as a point-of-care setting is promising but needs further validation before implementation.
Supplementary information
Supplementary information accompanies this paper at https ://doi. org/10.1186/s1310 4-019-4659-4.
Additional file 1: Table S1. Gating strategies for all lymphocyte subsets. All cells were initially gated from the CD45+ population, and then gated from the lymphocyte population, as determined by FSC/SSC plot.
Additional file 2: Table S2. Head to head comparison of median and mean percentages of lymphocyte subsets with regard to total lymphocyte count in venous and capillary blood (n = 40 for both capillary and venous blood samples).
Additional file 3. Individual data of percentage of each lymphocyte subset with regard to total lymphocyte count both from capillary and venous blood samples.
Additional file 4. Summary of data from Bland Altman analysis.
Abbreviations
CD3+: T-cells; CD4+: helper T-cells; CD8+: cytotoxic T-cells; CD19+: B-cells; CD56+: NK-cells (natural killer cells); CD3+CD56+: NKT-cells (natural killer T-cells); CD4+CD25+FoxP3+: regulatory T-cells; γδ T-cells: gamma delta T-cells; LOA: limit of agreement (in Bland–Altman analysis); within two stand-ard deviations from the mean bias (bias was the difference of results between capillary and venous samples); CLIA-1988: Clinical Laboratory Improvement Amendments of 1988.
Acknowledgements
This study was supported by Department of Pediatrics, Faculty of Medicine, Ramathibodi Hospital, Mahidol University, Thailand. We thank Ryan Chastain-Gross, Ph.D., from Edanz Group (www.edanz editi ng.com/ac) for editing a draft of this manuscript.
Authors’ contributions
Conceptualization: SC; methodology: SC, NA; software: NA; validation: SS, NA; formal analysis: SS, SC, NA; investigation: SS, NP, TS; resources: SH; data cura-tion: SS, NA; writing-original draft preparacura-tion: SS; writing-review and editing: SC, NA; visualization: SS; supervision: SC, NA; project administration: NA; fund-ing acquisition: SH. All authors read and approved the final manuscript.
Funding
This work is supported by Ramathibodi Foundation Children Cancer Fund Under Patronage of HRH Princess Som Sawali Ramathibodi Comprehensive Cancer Center and Faculty of Medicine Ramathibodi Hospital (CF_61004). This funding supported the design of the study, data collection, and data analysis. SC was financially supported for research activities by Faculty Staff Development Program of Faculty of Medicine Ramathibodi Hospital, Mahidol University, Thailand.
Availability of data and materials
All data generated or analysed during this study are included in this published article in Additional files.
Ethics approval and consent to participate
This study protocol was approved by the Research Ethical Committee of Ramathibodi Hospital, Mahidol University (ID 09-59-23), and subjects provided written informed consents.
Consent for publication
Not applicable.
Competing interests
•fast, convenient online submission •
thorough peer review by experienced researchers in your field • rapid publication on acceptance
• support for research data, including large and complex data types •
gold Open Access which fosters wider collaboration and increased citations maximum visibility for your research: over 100M website views per year •
At BMC, research is always in progress.
Learn more biomedcentral.com/submissions
Ready to submit your research? Choose BMC and benefit from:
Author details
1 Section for Research Center, Faculty of Medicine Ramathibodi Hospital, Mahidol University, 270 Rama VI Road, Bangkok 10400, Thailand. 2 Department of Pediatrics, Faculty of Medicine Ramathibodi Hospital, Mahidol University, 270 Rama VI Road, Bangkok 10400, Thailand.
Received: 15 July 2019 Accepted: 18 September 2019
References
1. Abdallah KO, Prak ET. B cell monitoring of transplant patients treated with anti-CD20. Clin Transpl. 2006:427–37.
2. Hoare RL, Veys P, Klein N, Callard R, Standing JF. Predicting CD4 T-cell reconstitution following pediatric hematopoietic stem cell transplanta-tion. Clin Pharmacol Ther. 2017;102:349–57.
3. Hogg RS, Yip B, Chan KJ, et al. Rates of disease progression by baseline CD4 cell count and viral load after initiating triple-drug therapy. JAMA. 2001;286:2568–77.
4. Siedner MJ, Ng CK, Bassett IV, Katz IT, Bangsberg DR, Tsai AC. Trends in CD4 count at presentation to care and treatment initiation in sub-Saha-ran Africa, 2002–2013: a meta-analysis. Clin Infect Dis. 2015;60:1120–7. 5. Mermin J, Ekwaru JP, Were W, et al. Utility of routine viral load, CD4 cell
count, and clinical monitoring among adults with HIV receiving antiretro-viral therapy in Uganda: randomised trial. BMJ. 2011;343:d6792. 6. St John A, Price CP. Existing and emerging technologies for point-of-care
testing. Clin Biochem Rev. 2014;35:155–67.
7. Cracknell SE, Hinchliffe RF, Lilleyman JS. Lymphocyte subset counts in skin puncture and venous blood compared. J Clin Pathol. 1995;48:1137–8.
8. Yang ZW, Yang SH, Chen L, Qu J, Zhu J, Tang Z. Comparison of blood counts in venous, fingertip and arterial blood and their measurement variation. Clin Lab Haematol. 2001;23:155–9.
9. Giang S, La Cava A. Regulatory T cells in SLE: biology and use in treat-ment. Curr Rheumatol Rep. 2016;18:67.
10. Ohl K, Tenbrock K. Regulatory T cells in systemic lupus erythematosus. Eur J Immunol. 2015;45:344–55.
11. Cao C, Ma T, Chai YF, Shou ST. The role of regulatory T cells in immune dysfunction during sepsis. World J Emerg Med. 2015;6:5–9.
12. Andreu-Ballester JC, Tormo-Calandin C, Garcia-Ballesteros C, et al. Associa-tion of gammadelta T cells with disease severity and mortality in septic patients. Clin Vaccine Immunol. 2013;20:738–46.
13. Perko R, Kang G, Sunkara A, Leung W, Thomas PG, Dallas MH. Gamma delta T cell reconstitution is associated with fewer infections and improved event-free survival after hematopoietic stem cell transplanta-tion for pediatric leukemia. Biol Blood Marrow Transplant. 2015;21:130–6.
14. Venet F, Bohe J, Debard AL, Bienvenu J, Lepape A, Monneret G. Both per-centage of gammadelta T lymphocytes and CD3 expression are reduced during septic shock. Crit Care Med. 2005;33:2836–40.
15. Lertbunrian R, Chonpaisan K, Srisala S, Anurathapan U, Apiwattanakul N. Decrease in gamma delta T-cell with microbiologically proven infection in septic oncologic children. J Med Assoc Thai. 2019;102:382–9. 16. Bland JM, Altman DG. Statistical methods for assessing agreement
between two methods of clinical measurement. Lancet. 1986;1:307–10. 17. MacLennan CA, van Oosterhout JJ, White SA, Drayson MT, Zijlstra EE,
Molyneux ME. Finger-prick blood samples can be used interchangeably with venous samples for CD4 cell counting indicating their potential for use in CD4 rapid tests. AIDS. 2007;21:1643–5.
18. Hollis VS, Holloway JA, Harris S, Spencer D, van Berkel C, Morgan H. Comparison of venous and capillary differential leukocyte counts using a standard hematology analyzer and a novel microfluidic impedance cytometer. PLoS ONE. 2012;7:e43702.
19. Medicare, Medicaid and CLIA programs; regulations implementing the Clinical Laboratory Improvement Amendments of 1988 (CLIA)-HCFA. Final rule with comment period. Fed Regist. 1992;57:7002–186. 20. Sitoe N, Luecke E, Tembe N, et al. Absolute and percent CD4+ T-cell
enu-meration by flow cytometry using capillary blood. J Immunol Methods. 2011;372:1–6.
21. Daae LN, Halvorsen S, Mathisen PM, Mironska K. A comparison between haematological parameters in ‘capillary’ and venous blood from healthy adults. Scand J Clin Lab Invest. 1988;48:723–6.
22. Cavender DE. Lymphocyte adhesion to endothelial cells in vitro: models for the study of normal lymphocyte recirculation and lympho-cyte emigration into chronic inflammatory lesions. J Invest Dermatol. 1989;93:88S–95S.
23. Jani IV, Sitoe NE, Chongo PL, et al. Accurate CD4 T-cell enumeration and antiretroviral drug toxicity monitoring in primary healthcare clinics using point-of-care testing. AIDS. 2011;25:807–12.
24. Mtapuri-Zinyowera S, Chideme M, Mangwanya D, et al. Evaluation of the PIMA point-of-care CD4 analyzer in VCT clinics in Zimbabwe. J Acquir Immune Defic Syndr. 2010;55:1–7.
25. Balsam J, Bruck HA, Rasooly A. Mobile flow cytometer for mHealth. Meth-ods Mol Biol. 2015;1256:139–53.
Publisher’s Note