Cost of Schooling 2007
Research Report DCSF-RR060
Mark Peters, Hannah Carpenter and Gareth Edwards
BMRB Social Research
Cost of Schooling 2007
Mark Peters, Hannah Carpenter and Gareth Edwards
BMRB Social Research
Nick Coleman, Consultant
Views expressed in this report are not necessarily those of the Department for Children, Schools and Families or any other Government department.
© BMRB Social Research 2009 ISBN 978 1 84775 291 8
Research Report No
Table of Contents
Acknowledgements ...12
Executive summary ...13
Introduction...13
Key findings ...13
Background and research questions...13
Methodology ...14
Main findings ...15
Total annual spending...15
Uniform and PE kit...16
School trips...17
Curriculum materials and stationery items...17
Swimming lessons...18
School fund...18
School lunch...19
Travel 19 Other expenditure...20
Attitudes towards costs of schooling...20
Ease of meeting the costs of schooling...21
Financial help available...21
Findings from the survey of children...21
Introduction ...23
Background to the study...23
Aims of the research ...23
Methodology ...24
Timing of fieldwork ...25
1 Sample profile ...28
1.1 Parents/carers - final sample profile...28
1.2 Schools – final sample profile...30
1.3 Children’s survey - final sample profile...32
Survey Findings ...33
2 Total annual spending ...33
2.1 Gender of child ...34
2.2 Household income...35
2.3 Social grade...36
2.4 Free school meals ...37
2.5 Comparisons with 2003 ...38
2.6 Total annual spending as a proportion of income ...39
3 Uniform and PE kit...41
3.1 Uniform requirements ...41
3.2 PE kit ...60
3.3 Where uniform and PE kit can be bought...78
3.4 Whether school provides new or second hand uniform ...81
3.5 Financial assistance with uniform...83
3.6 Consequences of not wearing uniform...87
3.7 Uniform and PE kit requirements for different groups of children ...89
4 School trips ...91
4.1 The number of invitations for school trips in 2007...91
4.6 Average cost of trips...95
4.7 Option to pay by instalments ...95
4.8 Consequences of not being able to afford trip ...96
4.9 Invitation to discuss payments with teachers ...98
4.10 Voluntary contributions for trips in school hours ...99
4.11 Schools survey ...99
4.12 Profile of trips...99
4.13 Compulsory and voluntary charges...100
5 Class materials ...107
5.1 Class materials requiring payment ...107
5.2 Average cost of class materials...108
5.3 Schools survey ...110
6 Stationery items ...113
6.1 Stationery items to be provided – parents/carers survey ...113
6.2 Stationery items to be provided – schools survey...115
6.3 Cost of stationery items – parents/carers survey ...117
6.4 Cost of stationery items – schools survey ...119
7 Swimming lessons ...120
7.1 Parents/carers survey...120
7.2 Schools survey ...121
8 School fund ...123
8.1 Whether parents/carers were asked to contribute to school fund ...123
8.2 Amount parents/carers contributed to the school fund...123
8.3 Whether schools asked for a contribution ...124
8.4 Amount schools asked parents/carers to contribute to school fund...124
8.6 What the school fund was used for ...125
8.7 Consequences of parents/carers being unable to pay the school fund contribution 126 9 School meals ...128
9.1 Typical costs of meals – parents/carers survey ...128
9.2 Typical cost of meals – Schools survey ...128
9.3 Options available and taken for school meals...129
9.4 Reasons for children not having a school meal ...130
9.5 Free school meals ...131
9.6 Organisation of free school meals...133
10 Travel ...136
10.1 Method of transport used to take children to school ...136
10.2 Who pays for travel costs? ...137
10.3 Cost of travel ...137
11 Other expenditure ...138
11.1 School photographs...138
11.2 Charity contributions...139
11.3 Contributions to other school activities...140
12 Attitudes towards cost of schooling ...142
12.1 Attitude towards costs of uniform and PE kit...142
12.2 Attitude towards cost of school trips...144
12.3 Feeling pressured into paying for school trips...145
13 Role of children in passing on requests for contributions to parents/carers...156
13.1 Passing on requests for contributions ...156
13.2 Why requests for contribution are not passed on to parents/carers ...157
13.3 The consequences if parents/carers could not afford to contribute ...158
13.4 Child perception of parents/carers’ ability to afford school items ...159
14 Literature review ...161
Appendix A: Cost calculations ...170
Parents/carers ...170
School Uniform and PE kit ...170
School Trips...170
Class materials, swimming lessons, travel, meals ...171
Capping of costs...172
Total annual costs calculation ...173
Inflation ...173
Appendix B: Response rates ...175
Parents/carers survey - Survey fieldwork report and response rates ...175
Schools survey - response rates ...176
Appendix C: Weighting ...177
Parents/carers data ...177
Schools survey ...179
Children’s survey (Youth Omnibus data) ...182
Appendix D: Key driver analysis...184
The technique...184
The results...185
Appendix E: Survey documents ...188
Appendix E(2) – Introduction letter sent to schools (prior to fieldwork)...223
Appendix E(3) – Reminder letter sent to schools...225
Appendix E(4) – Schools postal questionnaire ...227
Appendix E(5) - Schools telephone chase questionnaire (CATI)...248
Appendix E(6) - Access to Youth Questionnaire...252
Index of Tables
Table/Chart Name Page
Number
Table 1.1: Sample profile of respondents – Parents/carers survey 28
Table1.2: Sample profile of respondents – Schools survey 30
Table1.3: Sample profile of respondents – Children’s survey 32
Table 2.1: Average spend on all items in 2007 for parents/carers of primary schoolchildren
34
Table 2.2: Total average spend on all items in 2007 by type of school attended and gender
35
Table 2.3: Total average spend on all items in 2007 by household income 35
Chart 2.1: Average total annual spending by social grade 36
Table 2.4: Total average spend on all items in 2007 by qualification for free school meals
37
Table 2.5: Total average spend excluding spending on school meals by qualification for free school meals
37
Chart 2.2 Total average annual spending in 2003 (adjusted for inflation) and 2007 39
Table 2.6: Total spend on costs of schooling on ALL children in household as a proportion of household income
40
Chart 3.1: Items of uniform required 42
Table 3.1: Items of uniform required – Primary Schools 43
Table 3.2: Items of uniform required – Secondary Schools 44
Table 3.3: Number of items requiring logo and that could have an optional logo, by school type
45
Table 3.4: Uniform items requiring logo / could have an optional logo 46
Chart 3.2: Average number of items bought 48
Chart 3.3: Average costs of uniform per item 49
Table 3.5: Average cost of uniform, by buying restrictions 51
Table 3.6: Average cost of item of uniform - Schools & Parents/carers comparison 53
Chart 3.5: Average costs of uniform per item 54
Table 3.7: Average spend in 2007 on uniform items 56
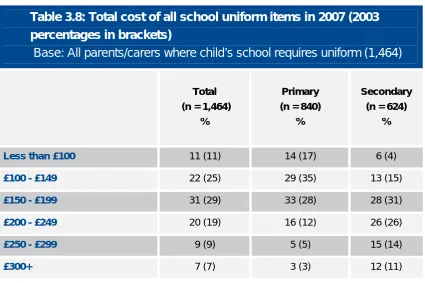
Table 3.8: Total cost of all school uniform items in 2007 58
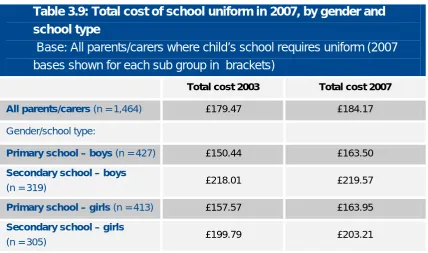
Table 3.9: Total cost of school uniform in 2007, by gender and school type 59
Table 3.10: Total cost of school uniform in 2007, by where uniform is available 60
Chart 3.6: Items of PE kit required 62
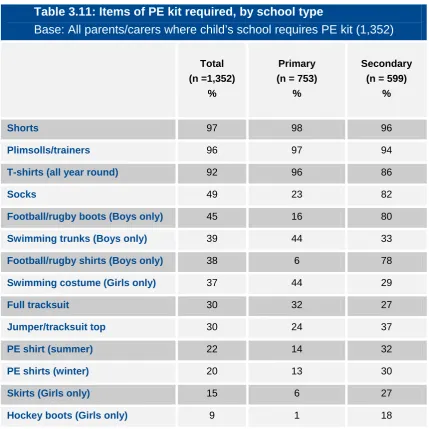
Table 3.11: Items of PE kit required, by school type 63
Table 3.12: Items of PE Kit required – Primary Schools 64
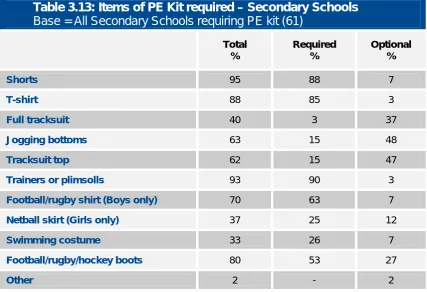
Table 3.13: Items of PE Kit required – Secondary Schools 65
Table 3.14: Number of items requiring logo and that could have an optional logo, by school type
66
Table 3.15: PE kit items requiring logo / could have an optional logo 67
Chart 3.7: Average number of items bought 68
Chart 3.8: Average costs of PE kit per item 69
Chart 3.9: Average costs of PE kit, by school type 70
Table 3.16: Ave cost of items of PE Kit required – Schools & Parents 72
Chart 3.10: Average costs of PE kit per item 74
Table 3.17: Average spend in 2007 on PE kit items 75
Table 3.18: Total cost of PE kit in 2007, by gender and school type 77
Table 3.19: Total cost of PE kit in 2007, by where uniform is available 78
Table 3.22: Sources of assistance for school uniform available to parents/carers 84
Table 3.23: Sources of assistance for PE kit available to parents/carers 85
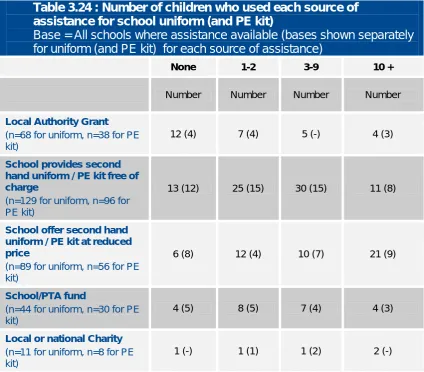
Table 3.24: Number of children who used each source of assistance for school uniform (and PE kit)
86
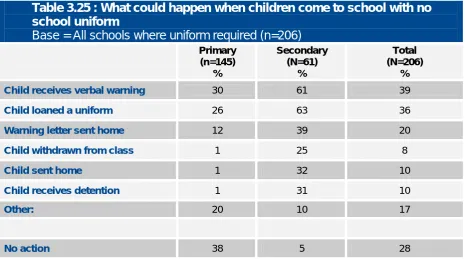
Table 3.25: What could happen when child comes to school with no school uniform
88
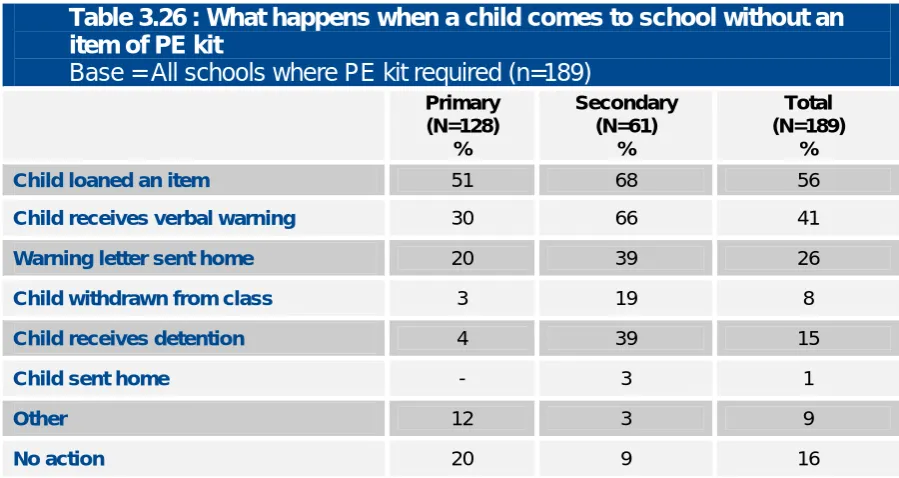
Table 3.26: What happens when a child comes to school without an item of PE kit
89
Chart 4.1: Number of trips asked to pay for in 2007 91
Chart 4.2: Type of trip 92
Chart 4.3: Reasons why child did not go on most recent trip 94
Table 4.1: Average cost of trips 95
Chart 4.4: What would happen if respondent could not afford to pay for trip 97
Chart 4.5: Whether invited to discuss difficulties 98
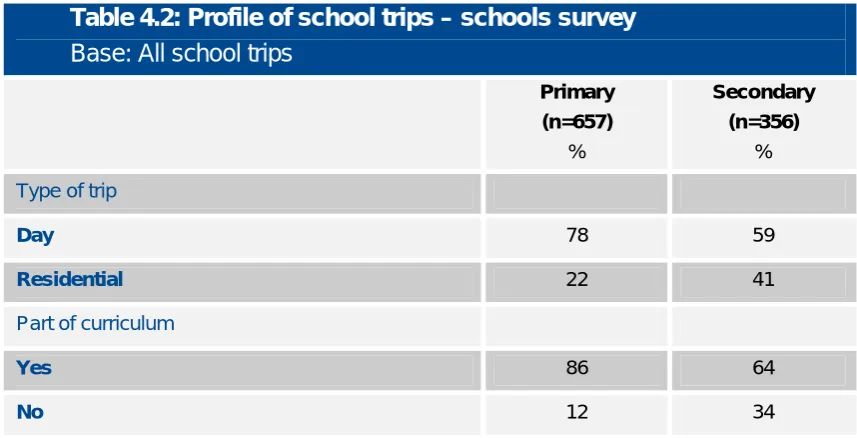
Table 4.2: Profile of school trips – schools survey 100
Table 4.3: Whether charges made for school trips, by type of trip – schools survey 101
Table 4.4: Whether charges made for school trips, by whether trip part of curriculum – schools survey
101
Table 4.5: Average cost of trips – schools survey 102
Table 4.6: Notice given to parents/carers about day trips – schools survey 103
Table 4.7: Notice given to parents/carers about residential trips – schools survey 104
Table 4.8: How schools cover the costs of board and lodgings on residential trips for children eligible for free school meals – schools survey
106
Chart 5.1: Class materials requiring payment 107
Chart 5.2: Average annual costs of class materials 109
Table 5.1: Class materials 110
Table 5.2: Class materials 111
Table 5.3: Whether any compulsory text books or revision guides for KS2, 3 or 4 children
112
school type
Chart 6.2: Proportions of parents/carers asked to provide stationery items, by school type
115
Chart 6.3: Proportion of parents/carers asked to provide stationary items in 2003 and 2007
116
Table 6.1: Compulsory and recommended stationery items for primary schools 117
Table 6.2: Compulsory and recommended stationery items for secondary schools 117
Table 6.3: Whether school or children provides stationery items, for primary schools 118
Table 6.4: Whether school or children provides stationery items, for secondary schools
118
Table 6.5: Average spend in 2007 on stationery items, by type of school 119
Table 7.1: Whether school provides swimming lessons, by school type 122
Table 8.1: Whether parents/carers were asked to contribute to school fund 124
Table 8.2: What school fund was used for 127
Table 9.1: Cost of school meal – Schools survey 130
Table 9.2: What type of meal child has during school 130
Table 9.3: School meals – options available for school meal 131
Table 9.4: Whether child eligible for free school meals 133
Table 9.5 : How parents/carers made aware of how to apply for free school meals 135
Table 9.6: School meals – how easy it is for children to know who receives a free school meal
136
Table 10.1: Main method of transport used to take children to school 137
Table 11.1: Average spend in 2007 on school photographs, by type of school 139
Chart 11.1: Other items/activities parents/carers asked to contribute to, by school type
kit, by where items can be bought
Chart 12.3: Happiness with the costs associated with school trips, by household income
145
Table 12.1: Agreement with statement “I sometimes feel pressurised into contributing to the cost of school trips”, by household income
146
Chart 12.4: Happiness with overall costs of schooling, by household income 147
Chart 12.5: Happiness with overall costs of schooling, by total spend on child's schooling in 2007
148
Table 12.2: Happiness with overall costs of schooling, by school type/year 148
Chart 12.6: Happiness with overall costs of schooling for 2003 survey and 2007 survey
149
Chart 12.7: Ease of meeting overall costs of schooling, by household income 150
Table 12.3: Ease of meeting overall costs of schooling, by school type, number of children at maintained school and total amount spent on child's schooling in 2007
151
Chart 12.8: Ease of meeting overall costs of schooling for 2003 survey and 2007 survey
152
Table 12.4 : Sources of assistance for costs of schooling available to parents/carers 154
Figure 12.1: Key driver analysis: overall happiness with costs of schooling 155
Chart 13.1: How often respondent passes on requests for money 157
Chart 13.2: Reasons why requests for payments are not passed on (2007 and 2003)
159
Table 13.1: Consequences if parents/carers could not afford to contribute 160
Chart 13.3: Agreement with the statement: 'Sometimes my parents/ carers find it difficult to afford things that I need for school'.
Acknowledgements
The authors would like to thank the many people who have contributed to making the
survey a success. We would like to acknowledge the support provided over the course of the project by Jenny Buckland at the Department for Children, Schools and
Families (DCSF), as well as the input from the other members of the project steering
group – Michele Weatherburn, Jacqui McLean, Ian Morrison, John Britton, Lisa Binks, and Lucy O’Sullivan from the DCSF, Katie Lane from Citizen’s Advice and
Gabrielle Preston from the Child Poverty Action Group (CPAG).
At BMRB we would like to thank Tim Brunwin for his contribution to setting up the project and ensuring consistency with the 2003 survey, and Helen Lambert for her
input on statistical analysis and weighting. We would also like to thank the
interviewers and supervisors who carried out the telephone and face-to-face interviews, the project managers at the company’s telephone unit and Omnibus
team, as well as colleagues in the data processing and coding departments.
Above all, we would like to thank the staff of all the schools who responded to the postal and web surveys, and all the members of the general public who took part in
Executive summary
Introduction
This research brief presents findings from the Cost of Schooling 2007 study, carried
out by BMRB on behalf of the Department for Children, Schools and Families (DCSF).
The 2007 study updates findings from a study of the cost of schooling in 2003,
commissioned and published by the then Department for Education and Skills (DfES) in 2004. Both studies investigated the additional costs to parents/carers of sending a
child to maintained primary and secondary school in England.
Key findings
• The total amount spent by parents/carers in 2007 was, on average, £683.79 for a child at primary school and £1,195.47 for a child at secondary school.
• Overall costs had increased very slightly (after adjusting for inflation) since 2003. The average increase was £34 (a 4 per cent increase).
• Most parents/carers were happy overall with the costs associated with their child’s schooling: 23 per cent were very happy and 60 per cent were quite
happy. However, 13 per cent of parents/carers were not very happy and 3 per cent were not at all happy with the costs. This represents a slight decline in
happiness since 2003.
• Six per cent of parents/carers said they found it very difficult to meet the costs associated with their child’s schooling and 32 per cent found it quite difficult; while 47 per cent of parents/carers found it quite easy and 14 per cent found
it very easy. This represents a slight decline in ease of meeting costs since
2003.
• Families with incomes of less than £15,000 were less likely to be happy with the costs of schooling, and more likely to find it hard to meet the costs
compared to families with higher incomes.
Background and research questions
Although education in maintained schools is nominally free, there are a number of
costs to parents/carers associated with a child’s education that can have an impact
on family budgets.
In 2004, the then DfES commissioned a study to investigate the costs associated
those costs (DfES Research Report 588). In 2008, the DCSF commissioned a follow-up study to follow-update the findings and investigate change over time. The studies
investigated costs that were incurred in the calendar years 2003 and 2007.
The research questions for the study of costs in 2007 included:
• What are the costs to parents and carers when sending their children to maintained primary and secondary schools in England?
• What voluntary contributions are parents and carers asked for by schools?
• What arrangements do schools have for asking for contributions?
• What happens if parents and carers are unable to meet certain costs?
• What role do children play (if any) in mediating what parents and carers pay for or know about?
• How do costs vary across different types of schools and across year groups?
• Have costs to parents and carers increased or decreased in real terms since 2003?
• Have there been any changes in the nature of what parents and carers are required or requested to pay for, and what is the impact of any change?
• Are parents/carers happy or unhappy with the costs of schooling, and have their views changed since 2003?
• Do parents/carers find it easy or difficult to meet the costs of schooling, and has this changed since 2003?
Methodology
The study involved three strands:
• A telephone survey of an achieved representative sample of 1,500 parents/carers of children aged 5 to 16 attending maintained schools in
England, using random digit dialling.
• A self-completion survey of maintained primary and secondary schools, with postal and online response options. Questionnaires were completed by 147
The samples for these three strands were not linked. Fieldwork for all three strands of the research took place between March and June 2008. (In the previous study, the
parents/carers and schools fieldwork took place between February and April 2004,
and the fieldwork with children between April and June 2004.)
In addition, a literature review was conducted to identify and synthesise findings from
other research on the costs of schooling. Findings from the literature review can be found in the full report.
When comparing 2003 costs with 2007 costs, 2003 costs have been adjusted for
inflation using the Retail Price Index.
Main findings
Total annual spending
The average total amount spent by parents/carers on the costs associated with a
child’s primary school education in 2007 was £683.79, and for secondary school
children the average was £1,195.47.
Costs were generally higher for boys than girls:
• At primary school, the average total amount was £691.88 for boys compared to £675.59 for girls.
• At secondary school, the average total amount was £1,235.09 for boys compared to £1,153.74 for girls.
Costs were lower on average for households with incomes of less than £15,000 per
year – although not substantially lower:
• For those with household incomes of less than £15,000, the average total amounts were £646.67 at primary school and £1,117.16 at secondary school.
• For those with household incomes of £15,000 or more, the average total amounts were £695.58 at primary school and £1236.40 at secondary school.
On average the total amount parents/carers spent on their child’s education had
increased by £34 since 2003 (after adjusting for inflation). This represents a 4 per cent increase in the costs of schooling.
Even though the overall costs have risen slightly, the cost of many individual
items/activities has decreased or remained about the same since 2003. This suggests that parents/carers on average paid for more items/activities in 2007 than
Uniform and PE kit
Almost all parents/carers (98 per cent) said that their child’s school required children
to wear a uniform. Where a uniform was required, the total annual cost of uniform
was £184.17 on average, and higher for secondary school children than for primary school children (£211.60 compared to £163.72). In secondary schools, the total
annual cost was higher for boys than girls (£219.57 compared with £203.21), due to
greater spending on school shoes. The most expensive items of uniform were shoes and blazers.
Individual items of uniform tended to cost less in 2007 than in 2003, although
parents/carers tended to buy more items in 2007 than they did in 2003. On average, the total cost of school uniform in 2007 was £184.17 compared to £179.47 in 2003
(adjusted for inflation); however, socks were not included in the 2003 total cost, and
these cost an average of £10 in 2007.
Nine in ten parents/carers said their child needed some form of PE kit, with more
specialist and seasonal items being more common in secondary schools. As these
items tended to be relatively expensive, the total cost of PE kit in 2007 was much higher for children at secondary school than at primary school (on average £129.74
compared with £53.22, where PE kit was required). In secondary schools, this total
cost was higher for boys than girls (£155.26 compared with £102.11), because of the cost of football or rugby shirts and boots.
Overall, the average cost of PE kit in 2007 was £87.22, slightly lower than in 2003
after adjusting for inflation (the adjusted 2003 cost was £89.42, and did not include socks, while the 2007 cost did).
One in six parents/carers (17 per cent) said that all items of uniform and PE kit had to
be bought from a designated shop or the school itself, while 22 per cent said that all items could be bought from anywhere (the remainder said that only some items had
to be bought from the school or a designated shop). Restrictions were more likely to
be in place in secondary than primary schools. These figures were very similar to those obtained in 2003, despite recent DCSF guidance to schools1 that items should
be available from a wide variety of outlets instead of a sole supplier.
The majority of parents/carers said that at least one item of uniform required a logo (97 per cent in secondary schools and 80 per cent in primary schools). In most of
Overall, one in three parents/carers said that second hand uniform was available from the school, either to buy or free of charge, and where this was the case the total
cost of uniform was lower, in both primary and secondary schools.
Four per cent of parents/carers said that they received financial help with buying their child’s school uniform. This figure was 11 per cent for those with an annual income of
less than £10,000 per year. The overall proportion of parents/carers receiving financial help has not changed since 2003.
School trips
The majority of parents/carers (87 per cent) said they had been asked to pay for a
school trip in 2007, and in most cases (92 per cent) the child went on the trip.
The average cost of a day trip was £9.47 in primary schools and £21.70 in secondary schools. Residential trips in the UK were of a similar cost in primary and secondary
schools (£153.14 and £160.07 respectively), while residential trips abroad cost £402.70 on average (figure for secondary schools only). Costs were similar to those
recorded in 2003 (after adjusting for inflation).
Overall, 44 per cent of parents/carers were offered the opportunity to pay by instalments, and this was higher for residential trips (89 per cent).
Around two in three parents/carers (68 per cent) said that they had been asked to
make a voluntary contribution towards a school trip that took place in school hours during 2007. Almost two fifths (38 per cent) were aware that no compulsory charge
should be made for these trips2.
The schools survey found that compulsory charges were imposed for one in ten curricular trips in primary schools and three in ten curricular trips in secondary
schools, even though no compulsory charge should be made for these trips3.
Half of parents/carers said that they sometimes felt pressurised into paying for school trips.
Curriculum materials and stationery items
Parents/carers of secondary school children were more likely than those with primary
school children to say they had to pay for various class materials. Overall, the
2
Education Act 1996 (Sections 449-462), as amended by the School Standards and Framework Act 1998 and the Education Act 2002.
average annual cost for music lesson materials was £102.65, and £65.90 for cookery materials. The annual cost of other class materials ranged from £10 to £33 on
average. Annual costs were generally similar in 2007 and 2003 (after adjusting for
inflation).
Parents/carers of primary school children did not generally have to provide as many
stationery items as parents/carers of secondary school children. As a result, the average total spend on stationery items was lower for primary than secondary school
children: £4.40 compared to £25.51.
Swimming lessons
Twelve per cent of parents/carers reported being asked to pay for swimming lessons
in 2007, and most of these were parents/carers of primary school children. Amongst those that were asked to pay, the average total amount spent on swimming lessons
in 2007 was £69.20.
There was a small minority of schools (6 per cent of primary and 4 per cent of
secondary schools) that made a compulsory charge for swimming lessons, while a
higher proportion asked for voluntary contributions (28 per cent of primary schools and 14 per cent of secondary schools). Amongst schools that did ask for a voluntary
contribution, the average amount per lesson was £2.03 for primary schools and
£1.72 for secondary schools.
School fund
Twenty nine per cent of parents/carers were asked to contribute to the school fund.
(33 per cent of parents/carers of secondary school children and 27 per cent of
parents/carers of primary school children).
Parents/carers were asked to contribute an average of around £35 a year. The
average annual contribution requested by secondary schools was higher than the
average requested from primary schools (£44 compared with £27). Parents/carers with higher incomes were more likely to be asked to contribute larger amounts
compared with parents/carers on lower incomes; the average amount was £25 for
Over a quarter (28 per cent) of schools said they asked parents/carers to contribute towards the school fund. All schools that asked for contributions said they were
voluntary. The school fund was used most frequently as a means to support school
trips; almost two thirds (64 per cent) of schools asking for contributions said this.
School lunch
Children in primary schools were more likely than their secondary school
counterparts to take a packed lunch (63 per cent versus 52 per cent). Secondary schoolchildren were more likely to have had a school dinner (41 per cent compared
with 35 per cent of primary schoolchildren).
The reason given most frequently by parents/carers as to why their child did not usually have a school meal was that their child preferred their usual lunch
arrangement (55 per cent). However, a minority (6 per cent) said meals were not
available at the school5.
The average daily amount spent by parents/carers on meals during the school day
was £1.86 (£1.97 when excluding parents/carers whose child was eligible for free
school meals). Meals were generally more expensive for secondary school children compared with their primary school counterparts (the average daily cost was £2.09
for secondary schoolchildren and £1.69 for primary schoolchildren)
A third (32 per cent) of parents/carers whose child was eligible for free school meals said their child did not take up the free school meal. The main reason (given by 69
per cent of these parents/carers) was that the child preferred another lunch
arrangement such as taking their own food or eating at home.
Travel
Children were most likely to travel to school by walking (48 per cent) or by car (32 per
cent).
Children from low-income households (less than £15,000) were more likely than those from higher income households (£15,000+) to walk to school (55 per cent
versus 44 per cent), and were less likely go by car (26 per cent versus 34 per cent).
5
Over half (53 per cent) of parents/carers whose child traveled to school by public transport, taxi or school bus said the local authority paid for this. In 2003, 26 per cent
of parents/carers said local authorities paid.
Parents/carers who paid for their child to travel to school by public transport, school bus or taxi spent an average amount of £9.54 a week.
Other expenditure
School photographs
Two-thirds of parents/carers (67 per cent) had bought school photographs in 2007,
and the average amount they spent was £18.86.
Schools were asked to give the cost of the basic package of school photographs,
which was £10.77 for primary schools and £11.90 for secondary schools.
Charity contributions
Nine in ten parents/carers (91 per cent) had been asked to contribute cash or items to charity on behalf of their child in 2007, and most of these had been asked on
several occasions. The average contribution per event was £2.56.
Schools held an average of just over three charity or non-uniform days each year. The average contribution requested for such events was £0.83 for primary schools
and £1 for secondary schools.
Other activities
Three quarters of parents/carers (75 per cent) had been asked to contribute to other
school activities such as cake stalls, raffles and jumble sales. The total spend on
such items/activities in 2007 was £12.47 on average.
Attitudes towards costs of schooling
When asked how happy they were with all the costs associated with their child’s
schooling, 23 per cent of parents/carers were very happy, 60 per cent were quite
happy, 13 per cent were not very happy and 3 per cent were not at all happy. Parents/carers of primary school children were generally happier with the costs, as
Eight in ten parents/carers (79 per cent) were very or quite happy with the costs of uniform and PE kit, but 15 per cent were not very happy and 5 per cent were not at
all happy. Parents/carers with lower incomes were generally less happy, as were
those who had to buy uniform and PE kit from a designated outlet, rather than being able to buy it from anywhere.
Around seven in ten parents/carers (72 per cent) were very or quite happy with the costs of school trips, but 20 per cent were not very happy and 7 per cent were not at
all happy. Again, parents/carers with lower incomes were generally less happy with
the costs, as were those who had been asked to pay for more than two trips.
Ease of meeting the costs of schooling
Fourteen per cent of parents/carers said they found it very easy to meet costs, while 47 per cent found it quite easy. Nearly a third (32 per cent) found it quite difficult,
while a significant minority (6 per cent) found it very difficult. Amongst families with incomes of £35,000 or more 20 per cent said it was difficult to meet costs, but this
figure rose to two-thirds (65 per cent) of families with incomes of less than £15,000.
Ease of meeting the costs of schooling has declined slightly since 2003. The proportion of parents and carers that found it very or quite easy to meet costs
declined from 72 per cent to 61 per cent; and the proportion who found it very or
quite difficult increased from 27 per cent in 2003 to 38 per cent in 2007.
Financial help available
One in five parents/carers (20 per cent) said they were aware of financial assistance
available from their child’s school. In contrast to this three-quarters (76 per cent) of
schools said financial assistance was available from the school fund. However, only a third of schools that offered this assistance said it was publicised, which may
explain the discrepancy.
Awareness of assistance was lower amongst families with incomes of less than £15,000, although it is not possible to say whether this is due to lack of publicity or
lack of assistance available in the schools their children attend.
Findings from the survey of children
The survey of children found that just over two thirds (68 per cent) said they always passed on letters from the school requesting payment from parents/carers, and a
quarter said they passed on such letters most of the time.
Two thirds (65 per cent) of those who said they did not always pass on requests from the school for payments to parents/carers said they had forgotten, while a quarter
lower income households were more likely than those with higher household incomes to say they did not pass on requests for money because they thought their
parents/carers could not afford it (7 per cent where annual household income was
less than £15,000 compared with 1 per cent for those with an annual income of £15,000 or more).
Children were asked for their level of agreement with the statement ‘Sometimes my parents/carers find it difficult to afford things that I need for school’. Seven in ten
respondents (70 per cent) disagreed with this statement. However, children from
households with an income of less than £15,000 a year were more likely to agree
Introduction
Background to the study
Although education in maintained schools is nominally free, there are a number of
costs to parents/carers associated with a child’s schooling that can have an impact on family budgets. These costs can include school uniform, PE kit, transport, school
meals and school trips, amongst others.
In order to investigate the impact of the cost of schooling on low income families, the then Department for Education and Skills (DfES) commissioned BMRB Social
Research to carry out a research project to investigate the costs associated with
sending children to maintained schools in England incurred during 2003.
The 2003 study estimated that the annual cost to parents/carers of sending a child to
school was approximately £560 for primary school children, and approximately £950 for secondary school children.
The Department for Children, School and Families (DCSF) commissioned BMRB
Social Research to conduct a repeat survey of costs in 2007 to investigate the costs of schooling that are met by parents and carers in England and any change over
time.
Aims of the research
The DCSF commissioned this study to answer the following research questions:
What are the costs to parents and carers when sending their children to maintained primary and secondary schools in England?
What voluntary contributions are parents and carers asked for by schools?
What arrangements do schools have for asking for contributions?
What happens if parents and carers are unable to meet certain costs?
What role do children play (if any) in mediating what parents and carers pay for or know about?
How do costs vary across different types of schools and across year groups?
Have costs to parents and carers increased or decreased in real terms since 2003?
Are parents/carers happy or unhappy with the costs of schooling, and have their views changed since 2003?
Do parents/carers find it easy or difficult to meet the costs of schooling, and has this changed since 2003?
Methodology
A key consideration for the approach was that findings would need to be comparable
with the 2004 survey. For this reason a very similar approach was adopted, and questionnaires were also kept largely similar, although amendments were made to
make sure the questionnaires were up to date and relevant.
A considerable amount of development work had been undertaken before the 2004 survey to inform both the methodology and questionnaire design. Further
development work was not considered necessary, although a pilot was conducted to
test the parents/carers questionnaire.
As well as the three strands of survey research described below, a literature review
was conducted to gather findings from other research that had been conducted
around this subject matter. This literature review can be found in chapter 14 of this report.
Parents/carers survey
The survey of parents/carers was carried out using a random-digit dialling telephone survey. Interviewers screened households to ensure that the respondent had a child
aged 5 to 16 in maintained education and that (s)he was the person best able to
discuss the costs associated with their child’s education. If there was more than one child aged 5 to 16 in maintained school in the household, one was selected at
random using the most-recent-birthday rule. All questions in the survey then related
to the selected child.
1,500 parents/carers were interviewed. Of those households that had been screened
and were known to be eligible for the survey 95 per cent took part.
Schools survey
The survey of schools was carried out using a 14 page postal questionnaire, with an
• Schools that had not responded to this initial mailout were sent a reminder letter with an additional copy of the questionnaire, and asked to complete and
return it within 3 weeks.
• Schools that did not respond to this reminder were then telephoned and asked to complete the questionnaire within 2 weeks.
• Finally, schools that had said at the telephone chase stage that they would complete and return the questionnaire, but had not done so, were sent a
reminder letter asking them to return the questionnaire.
Schools were selected for the survey using a stratified random sample of maintained
schools in England taken from EduBase. EduBase is a register of all educational
establishments in England and Wales, maintained by the DCSF.
208 schools took part in the survey which represents a 29 per cent response rate.
Children’s survey
A small number of questions were included on BMRB’s Youth Omnibus. These were asked of children aged 10 to 16 in maintained education. This was to try to assess
how often they passed on school requests for money to their parents/carers; if they
did not, why; and their perception of their family’s ability to pay for the things that were requested.
1,166 children were interviewed. As this survey was undertaken using random location sampling (a form of quota sampling) a response rate cannot be applied.
It should be noted that the samples for the three strands of research were not linked,
so the schools that took part in the schools survey are not the schools that are attended by the children of the respondents to the parents/carers survey.
Timing of fieldwork
Parents/carers telephone survey
The pilot stage of the parents/carers survey (to test the questionnaire) took place from 25th to 30th March 2008. Main stage fieldwork was carried out between 6th May
and 15th June 2008.
Schools postal and web survey
The fieldwork period for the schools stage of the project ran from 16th April to 30th
June 2008. This included a telephone chase of non responders carried out 2nd to 20th
Children’s Youth Omnibus survey
Questions were asked as part of BMRB’s weekly face to face Youth Omnibus
between 20th March and 18th June 2008.
Notes on reading the report
The percentages within charts and tables in the report do not always add up to 100
per cent. In some cases this is because respondents were able to give more than
one answer to the question. In other cases, where only one answer was allowed, this is due to a small proportion of respondents replying ‘don’t know’, or to computer
rounding.
Comparisons with previous survey data
Throughout the report findings are compared, where possible, to findings from the
previous Cost of Schooling survey conducted in 2004. The 2004 parents/carers
survey asked about costs in 2003 and the 2008 parents/carers survey asked about costs in 2007 so when comparisons are made it is these years that are compared.
When costs are compared, data from 2003 has been adjusted for inflation using the
retail price index. For more details see appendix A.
Subgroup comparisons
Throughout the report various crossbreaks have been examined to see where there
are differences between subgroups. Some of the key crossbreaks used in the report are:
Income: the parents/carers questionnaire collected banded gross household income. The question asked of respondents was “In which of the following bands does your TOTAL annual household income fall before tax is deducted?”, using the following
income bands:
• Less than £3,000 per year
• £3,000 - £5,999 per year
• £6,000 - £9,999 per year
• £50,000 or more per year
1,390 out of 1,500 parents/carers provided an answer about their household income.
Social grade: this socio-economic status variable has been assessed using an occupational classification system completed by the interviewer based on the
occupation of the chief income earner in the household (who was not necessarily the
respondent themselves). The classification consists of the following codes, and examples are shown:
• A: Upper middle class: Higher managerial administrative or professional occupations such as a doctor, solicitor, accountant;
• B: Middle class: Intermediate managerial administrative or professional people such as a teacher, nurse, or police officer;
• C1: Lower middle class: Supervisory or clerical and junior managerial administrative or professional occupations such as junior manager, student, or clerical worker;
• C2: Skilled working class: Skilled manual workers such as a foreman, plumber, or bricklayer;
• D: Working class: Semi and unskilled manual workers such as shop workers, apprentices;
• E: Those at the lowest levels of subsistence. All those entirely dependent on the State long term through sickness, unemployment, old age or other reasons, casual workers and those without a regular income.
These groups are often combined during the report to show which groups are above
or below the average for a particular question.
Statistical significance
Throughout the report when comparing subgroups and when comparing findings
1 Sample profile
1.1 Parents/carers - final sample profile
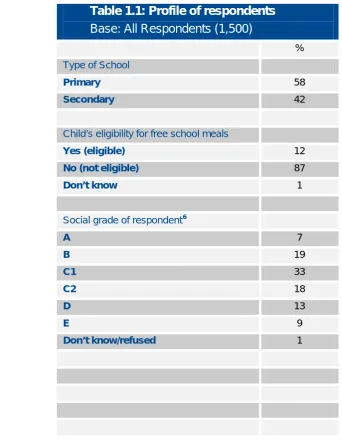
A breakdown of the final weighted sample profile of the parents/carers survey (1,500 interviews) is shown below. Details on weighting and response bias checks are
[image:31.595.99.442.189.633.2]included in Appendix C.
Table 1.1: Profile of respondents
Base: All Respondents (1,500)
%
Type of School
Primary 58
Secondary 42
Child’s eligibility for free school meals
Yes (eligible) 12
No (not eligible) 87
Don’t know 1
Social grade of respondent6
A 7
B 19
C1 33
C2 18
D 13
E 9
Don’t know/refused 1
6
Annual household income
Less than £,3000 2
£3,000 - £5,999 4
£6,000 - £9,999 6
£10,000 - £14,999 10
£15,000 - £24,999 17
£25,000 - £34,999 17
£35,000 - £49,999 20
£50,000 or more 18
Don’t know/refused 6
Ethnicity of respondent7
White 89
Black 3
Asian 4
Mixed 1
Other 2
Don’t know/refused 1
7
1.2 Schools – final sample profile
A breakdown of the final sample profile of the schools survey is shown below. A
relatively low response rate was achieved in the schools survey – 29 per cent overall (38 per cent amongst primary schools and 19 per cent amongst secondary schools).
This may have had a negative impact on the reliability of the data. As discussed
previously, non-responding schools were chased on several occasions. It is worth
noting that the overall pattern of non-response did not vary significantly by school type or other characteristics. Appendix C shows the profiles of responding schools
compared to population figures.
The response rate represents a decrease from 40 per cent (51 per cent in primary
schools and 27 per cent in secondary schools) in the previous Cost of Schooling
survey. This may in part be explained by a general decline in response rates achieved in school surveys.8
The data for secondary schools have been weighted in terms of type of funding to
Table1.2: Profile of respondents
Base: All Responding Schools (208)
Primary (n=147)
%
Secondary (n=61)
%
Type of Funding
Community 63 64 (70)
Foundation 1 19 (11)
Voluntary aided 24 17 (17)
Voluntary controlled 12 * (*)
Location
Urban LA 67 88 (87)
Rural LA 33 12 (13)
Number of children
>100 16 -
101-200 25 -
201-300 33 -
301-500 24 9
501-1000 2 43
1.3 Children’s survey - final sample profile
Details of weights applied to children’s survey data can be found in Appendix C.
Table1.3: Profile of respondents
Base: All Respondents (1,166)
%
Gender
Male 51
Female 49
Age
10-11 29
12-13 29
14-15 25
16 17
Social grade
AB 25
C1 29
C2 21
D 17
E 8
Annual household income
Less than £,3000 3
£3,000 - £5,999 4
£6,000 - £9,999 5
£10,000 - £14,999 8
£15,000 - £24,999 12
£25,000 - £34,999 12
£35,000 - £49,999 11
£50,000 or more 11
Survey Findings
2 Total annual spending
In this chapter the costs given for each area have been combined to calculate the
total annual spending for each respondent on all items of expenditure associated with sending a child to maintained school9. Subsequent chapters examine parents/carers
spending on individual areas of cost.
Please note that average annual costs examined in this chapter are based on all 1,500 parents/carers involved in the survey. This means the average costs shown in
this chapter are based on all respondents and therefore include all those parents/carers who have spent nothing on a particular area of expense. In later
chapters costs are examined only for parents/carers who had incurred that particular
cost and so average costs are different to those shown in table 2.1.
Table 2.1 shows the average annual spending on each area of expense for
parents/carers of primary and secondary schoolchildren.
As shown in table 2.1, for parents/carers of primary schoolchildren, the average total annual spending was £683.79, and the areas of expenditure that contributed most to
this figure were school lunch, uniform, school trips and PE kit.
This table shows that costs were considerably higher for parents/carers of secondary schoolchildren, amongst whom the average total annual spending was £1,195.47.
The areas of expenditure that contributed most to this figure were again school lunch,
school trips, uniform and PE kit, as well as class materials.
9
Table 2.1: Average spend on all items in 2007 for parents/carers of
primary schoolchildren
Base: All parents/carers (1,500)
Primary (n=866)
Secondary (n=634)
Uniform £158.99 £208.99
PE kit £46.22 £122.85
School trips £78.44 £289.71
Class materials £27.15 £95.52
Stationery items £4.40 £25.51
Swimming lessons £15.08 £0.00
School fund £7.34 £14.49
School lunch £304.84 £376.69
Travel £6.20 £41.07
School photographs £15.14 £9.26
Charity contributions £8.79 £5.02
Other activities/items £11.21 £6.35
Total annual spending £683.79 £1,195.47
2.1 Gender of child
Spending on male children was slightly higher than spending on female children,
particularly amongst secondary schoolchildren. Much of the cost difference between girls and boys at secondary schools can be explained by boys having higher costs for
Table 2.2: Total average spend on all items in 2007 by type of
school attended and gender
Base: All parents/carers (1,500)
Total annual expenditure
Annual expenditure on
uniform
Annual expenditure on
PE kit
Primary male (n=439) £691.88 £159.53 £46.76
Primary female (n=427) £675.59 £158.43 £45.66
Secondary male (n=325) £1,235.09 £216.46 £148.74
Secondary female (n=309) £1,153.74 £201.10 £95.47
2.2 Household income
As might be expected, there was a link between the total spending on costs of schooling and household income. Parents/carers with household incomes of less
than £15,000 per year spent less on average than those with higher incomes. These
results are shown in table 2.3.
Table 2.3: Total average spend on all items in 2007 by household
income
Base: All parents/carers who gave their household income (1,390)
Primary Secondary
Less than £15,000 (n=315) £646.67 £1117.16
£15,000 - £34,999 (n=499) £698.24 £1278.95
£35,000 or more (n=576) £693.32 £1204.31
These differences by income are greatly reduced (and no longer statistically
significant) when looking at the total cost excluding school meals. This suggests that
the lower costs for those with lower incomes can be (at least partly) explained by families with lower incomes being eligible for free school meals, and therefore
spending less on school lunch.
Amongst low income families (those with household incomes of less than £15,000 a year), those in work10 had spent more on average on their child’s schooling in 2007
10
than those who were not working. This difference was significant for parents/carers of primary schoolchildren, but not for secondary schools (due to the smaller base sizes
available). The average amounts spent by low income families on their child at
primary school were:
• £712.11 amongst those in work
• £518.53 amongst those not in work
Again, this difference is lessened (and no longer statistically significant) if the cost of school meals is excluded, suggesting that free school meals may well be the cause
of much of the difference in costs.
2.3 Social grade
Social grade is closely related to household income, and shows a similar pattern. Parents/carers in lower social grades (D and E) spent less on average than those in
higher social grades11.
Chart 2.1 Average total annual spending by social grade
Base: All for whom social grade could be assessed (1,479)
£1,251.98
£1,199.07 £1,269.31
£1,048.89
£697
.64
£695
.24
£712
.45
£633.
35
AB C1 C2 DE
Secondary Primary
2.4 Free school meals
Total costs were examined by eligibility for free school meals. Firstly, the total annual
costs including money spent on school meals were compared. These data are shown
in table 2.4.
Table 2.4: Total average spend on all items in 2007 by qualification
for free school meals
Base: All parents/carers who knew whether their child was eligible for
FSM (1,462)
Total average annual expenditure
Qualify – primary (n=104) £533.79
Not qualify – primary (n=742) £707.07
Qualify – secondary (n=63) £951.51
Not qualify – secondary (n=553) £1224.29
Table 2.4 shows that parents/carers of both primary and secondary schoolchildren
who did not qualify for free school meals spent more than those who did qualify.
However, as shown earlier in this section, school meals were, on average, the largest area of expenditure for parents/carers of both primary and secondary schoolchildren.
It is therefore useful to compare the total expenditure excluding school meals, this is
shown in table 2.5.
Table 2.5: Total average spend excluding spending on school meals
by qualification for free school meals
Base: All parents/carers who knew whether their child was eligible for
FSM (1,462)
Total average annual expenditure excluding school
meals
Qualify – primary (n=104) £360.57
Not qualify – primary (n=742) £383.64
Qualify – secondary (n=63) £767.15
Once spending on school meals had been excluded from the total, the average expenditure was not statistically significantly different between families who did
qualify for free school meals, and those that did not.
2.5 Comparisons with 2003
In order to make comparisons with 2003 some items had to be removed from the
total costs calculation (stationery items, school uniform socks, PE kit socks, and
deposits for textbooks, lockers or other items) as these items were not included in the previous survey. There was also one cost that was excluded from 2003 data for the
purposes of comparison (materials for sewing lessons). This has ensured that a
like-for-like comparison has been made, but means the figures in this section differ slightly from those in the rest of this chapter.
The total amount parents/carers were spending on their child’s education was slightly
higher in 2007 than in 200312. The overall average cost for all respondents was £837.47 in 2003 and £871.17 in 2007, an increase of around £34. This represents a
4 per cent increase in the costs of schooling between 2003 and 2007.
This slight increase in costs may seem surprising given that the cost of many individual items/activities has decreased or remained about the same since 2003.
The reason for the increase therefore seems to be that parents/carers were asked to
pay for more items/activities in 2007 than they were in 2003.
Chart 2.2 shows the average annual spending for 2003 (adjusted for inflation) and
Chart 2.2 Total average annual spending in 2003 (adjusted for inflation) and 2007
Base: All respondents (1,500)
£1,046.54 £1,107.05 £639.66
£642.01 £837.47
£1,108.20 £1,186.61 £659.11
£676.35 £871.17
Secondary female Secondary
male Primary
female Primary male
Total
2007 2003
Analysis was undertaken to assess what sort of parents/carers had found costs
increased in 2007 by looking at breakdowns by income. Families with mid-range
incomes (between £15,000 and £34,999 per year) experienced a 12 per cent increase in costs between 2003 and 2007, while those with lower or higher incomes
had not seen a rise in costs.
2.6 Total annual spending as a proportion of income
It is possible to make a very approximate estimate of the proportion of parents/carers’ income being spent on sending their children to maintained school. In order to do this
the number of children aged 5-16 attending maintained school in each household has
been taken into account: parents/carers gave costs for one child only when they were surveyed, and the total costs for this child have been multiplied by the number of
children in the household.
It should be noted that there are several sources of inaccuracy in this analysis:
• Exact income was not collected: parents/carers were instead asked which band their income fell into. For the purposes of this analysis the midpoint of
each band has been used.
• Gross household income was collected, rather than take-home income.
• Where respondents had more than one child at maintained school, it’s likely that the costs are not identical for each child (spending requirements vary by
• The analysis does not take account of the fact that there may well be cost savings for parents/carers with more than one child at maintained school (for
example uniform and PE kit items might be passed down to younger siblings).
Overall, Over half (59 per cent) of parents/carers were spending 5 per cent or less of their income on the costs of sending their children to maintained school, whilst a
notable minority (8 per cent) were spending over 20 per cent of their household
income on this.
As shown in table 2.6 parents/carers with lower incomes tended to spend a higher
proportion of their income on their children’s schooling than parents/carers with
higher incomes, and the proportion of income spent on children’s schooling also increased with the number of children in the household.
Table 2.6: Total spend on costs of schooling on ALL children in
household as a proportion of household income
Base: All parents/carers who gave their household income (1,390)
Up to 5% 6% - 10% 11% - 20%
21% or more
All parents/carers (n=1390) % 59 21 12 8
Household income
Less than £15,000 (n=315) % 14 27 31 27
£15,000 - £34,999 (n=499) % 55 29 12 4
£35,000 or more (n=576) % 88 10 1 *
Number of children in household
1 (n=638) % 74 15 8 3
2 (n=591) % 52 25 13 10
3 Uniform and PE kit
In October 2007 non-statutory guidelines were issued to schools from the DCSF with
regards to school uniform. The guidance encourages all schools to have a school
uniform, but states that any set policy must be affordable, non-discriminatory and sensitive to the needs of children. The guidance states that “no school uniform
should be so expensive as to leave pupils or their families feeling unable to apply to,
or attend a school of their choice, due to the cost of the uniform”.
The guidance also advises that schools that have exclusive contracts with suppliers
may be subject to enforcement action under the terms of the Competition Act. Overly
expensive uniform policies may also contravene the Schools Admissions Code, which places a statutory duty on all governing bodies to ensure that their policies and
practices do not disadvantage any children.
This chapter examines these issues, by asking parents/carers and schools whether a uniform and PE kit are required, what items make up the uniform/kit and their
estimate of the cost of each item. It then looks at any restrictions over where uniform
can be bought, whether schools make second-hand uniforms available to
parents/carers, and whether parents/carers receive any financial assistance with
buying their child’s school uniform.
3.1 Uniform requirements
Virtually all parents/carers (98 per cent) said that their child’s school required children to wear a school uniform. This is higher than the figure recorded in the 2003 survey
(95 per cent). As in the previous survey, parents/carers whose child was at primary
school were slightly less likely to say that their child needed a uniform than those whose child was at secondary school (97 per cent compared with 99 per cent in the
2007 survey).
Parents/carers survey - Which items of uniform are required?
Parents/carers were then asked which items their child’s school uniform consisted of.
A list of possible items was then read out – tailored according to the child’s gender –
and parents/carers were asked to confirm which items were included in their child’s uniform. Chart 3.1 shows the percentages for each item of uniform. Please note that
the figures for shirts/blouses, skirts/kilts and dresses/pinafores are based on female
Chart 3.1 Items of uniform required
Base: All parents/carers where child's school requires uniform (1,464)
11%
26%
40%
42%
44%
54%
72%
77%
88%
91%
92%
95%
97%
Hat Blazer Tie Socks Dress/pinafore (Girls only) Shorts (Boys only) Skirt/kilt (Girls only) Schoolbag Trousers Shoes Jumper/sweatshirt Shirt (Boys only) Shirt/blouse (Girls only)
Chart 3.1 shows that a number of items were needed by almost every child requiring a school uniform.
The requirements varied between primary and secondary schools. Parents/carers
whose child was at primary school were more likely than those at secondary school to specify a jumper or sweatshirt (98 per cent compared with 85 per cent), a skirt or
kilt (83 per cent compared with 58 per cent, based on female children only), a dress
or pinafore (71 per cent compared with 6 per cent, again based on female children only), shorts (62 per cent compared with 43 per cent, based on male children only)
and a hat (17 per cent compared with 2 per cent). By contrast, secondary school
parents/carers were more likely than primary school parents/carers to specify a tie (65 per cent compared with 22 per cent) and a blazer (53 per cent compared with 7
per cent).
Schools survey – Which items of uniform are required?
Schools were also asked to record the items of school uniform clothing that were
required or optional. A slightly different list was used for the schools questionnaire,
enabling items such as a specific type of coat and scarf to be included (where time constraints meant they could not be part of the parents/carers questionnaire). An
“other” option was also included.
The tables below show which items were included in the school uniform and whether each item was required or optional, for both primary and secondary schools.
Table 3.1 : Items of uniform required – Primary Schools
Base = All Primary schools requiring uniform (n=145)
Required %
Optional %
Total %
Sweatshirt/jumper/cardigan 72 28 100
Blouse/shirt 56 30 86
Trousers/skirt 63 26 89
Dress/pinafore (Girls only) 28 48 76
Shorts (Boys only) 31 30 61
Blazer 1 3 4
Tie 10 10 20
Specific type of shoes 19 8 27
Specific type of coat 2 12 14
Bag 13 40 53
Specific type of socks 3 7 10
Cap/Hat 2 17 19
Specific scarf - 1 1
Table 3.2 : Items of uniform required – Secondary Schools
Base = All Secondary schools requiring uniform (n=61)
Required %
Optional %
Total %
Sweatshirt/jumper/cardigan 70 25 95
Blouse/shirt 92 - 92
Trousers/skirt 97 2 99
Dress/pinafore (Girls only) 5 7 12
Shorts (Boys only) 23 7 30
Blazer 46 2 48
Tie 52 - 52
Specific type of shoes 49 - 49
Specific type of coat 12 5 17
Bag 35 12 37
Specific type of socks 14 2 16
Cap/Hat - 2 2
Specific scarf - 3 3
Other 13 2 15
There were differences between secondary and primary schools in terms of the items
required for uniform and the pattern was similar to the findings from the
parents/carers survey. Primary schools were more likely to include a dress or
pinafore, a pair of shorts or a cap/hat in their uniform. Secondary schools were more
likely to include trousers or skirt, a blazer, a specific type of shoes and a tie.
Primary schools were more likely than secondary schools to say an item of uniform
was optional rather than required of children.
These figures were very similar to the 2003 findings. However, fewer secondary
Parents/carers survey - Use of school logo on uniform
Table 3.3 shows the number of items that required a logo, and (if not required) where
a logo was optional.
Table 3.3: Number of items requiring logo and that could have an
optional logo, by school type
Base: All parents/carers requiring at least one item of uniform (1,464)
Logo required Optional logo
Primary (n = 840)
%
Secondary (n = 624)
%
Primary (n = 840)
%
Secondary (n = 624)
%
None 20 3 44 79
One 38 36 24 11
Two 29 40 19 3
Three 8 13 6 1
Four 3 5 3 1
Five or more 2 3 2 1
Don’t know * * 3 4
Most parents/carers said that at least one item of uniform required a logo. The proportion was higher in secondary schools than in primary schools (97 per cent
compared with 80 per cent). Optional logos were more common in primary schools.
Within primary schools, there was also a difference between girls and boys: 75 per cent of parents/carers with a female child at primary school said that a logo was
required on at least one item, compared with 85 per cent of parents/carers with a
male child at primary school.
If the figures for required and optional logos are combined, all but 3 per cent of
parents/carers said that their child’s uniform had at least one item which needed a
logo or had an optional logo.
Schools survey - Use of school logo on uniform
Schools were asked to record which uniform items required the school logo and
which items could have an optional school logo. This was asked for items of uniform that were either required or optional. Table 3.4 shows the items requiring a school
The main items that required a logo or where a logo was optional were: sweatshirt/ jumper/ cardigan (88 per cent); blazer, and school tie (both 75 per cent). Small base
numbers (especially amongst secondary schools) prevent analysis by school type.
Table 3.4: Uniform items requiring logo / could have an optional logo
Base: All schools requiring children to wear each item of uniform (bases are shown for
each individual item of uniform)
Logo required %
Optional logo %
Sweatshirt/jumper/cardigan (n=203) 47 41
Blouse/shirt (n=180) 10 31
Trousers/skirt (n=188) 2 9
Dress/pinafore (Girls only) (n=117) 2 14
Shorts (Boys only) (n=106) 1 5
Blazer (n=33) 67 8
Tie (n=60) 33 42
Specific type of shoes (n=68) - 6
Specific type of coat (n=30) 17 23
Bag (n=104) 16 25
Specific type of socks (n=24) - -
Cap/Hat (n=29) 17 41
Specific scarf (n=3) 100 -
Other (n=14) 49 34
Schools were also asked if parents/carers could sew school logo badges onto
uniform items that had been bought from non-specialist shops. Almost half (47 per
cent) said parents/carers were n