.5'W
NATIONAL INSTITUTE OF OCEANOGRAPHY
WORMLEY, GODALMING, SURREY
' '"'•I gl x.aVZ
111
Waves at Tongue Light Vessel,
outer Thames Estuary
by
a m
L. DRAPER and EILEEN G. D O B E L LJ''
N.I.O. INTERNAL REPORT NO. A. 49
1-1:
A U G U S T 1971
• UBHARY NotUTGl
UNIT Qr C
-Bcscon i
felefjtSiie: 0323
XK;' :,-i:;n..noN : evr.tc, I, -'t set
WAirONAL INSTITUTE OP OCEAWOGRAFHY
Wonnley, G-odalming, Surrey,
Waves at the Tongue Li^t Vessel,
outer Thames Estuary
by
L. Draper and Eileen G-, Dob ell
N.I.O. Internal Report No, A.49
CONTENTS
Description of the investigation Discussion of results
Acknowledgements References Page 1 2 3 h-Figures;
Wave Hei^t Exceedance Winter Spring Summer Autumn Wave Period Occurraace Winter Spring Summer Autumn
Spectral iridth Parameter Occurrence V/hole Year Scatter Diagram '.Thole Year Persistence Diagram Whole Year
'Lifetime' Wave Height Prediction G-raph
- 1
-Waves have been recorded by a Shiphome Wave Recorder (Tucker, 1 956) placed on the Tongue Light Vessel which is stationed in the outer Thames Estuary in 7 fathoms of water 8 miles north of Margate, The records from one year of operation, from mid December 19^5 to mid December 1966 have been analysed, mainly following the method of analysis developed by Tucker (I96I) from theoretical studies by Cartwri^t and
Longuet-Higgins (1956). The method of presentation is that recommended for data for engineering purposes (Draper, 1966).
Records were taken at three-hourly intervals, and the analysis yields the following parameters:
(a) = The sum of the distances of the highest crest and the lowest trough from the mean water level. (b) H2 = The sum of the distances of the second highest
crest and the second lowest trough from the mean water level,
(c) Tjj = The mean zero-crossing period, (d) Tq = The mean crest period.
From these measured parameters the following parameters have been calculated, after allowing for instrumental response:
(e) H = The significant wave height (mean height of the ^ highest one-third of the waves): this is calculated
separately from both and H2, and an average taken. The relationship between the parameters is
Hi = f(Hg) where f is a factor related to the number of zero-crossings in the records (Tucker, 1963). A similar relationship is used for the calculation of Hg from H2.
( f ) Q h o u r s ) ~ T h e m o s t p r o b a b l e V a l u e o f t h e h e i g h t o f
the highest wave which occurred in the recording interval (Draper, 1963).
(g) ^ - The spectral width parameter, which is calculated from Tg and T^ (Tucker, 1961):
^ 2 = 1 - (Tg / T J 2
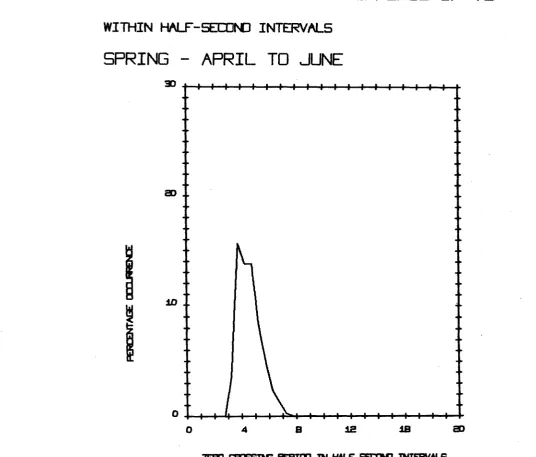
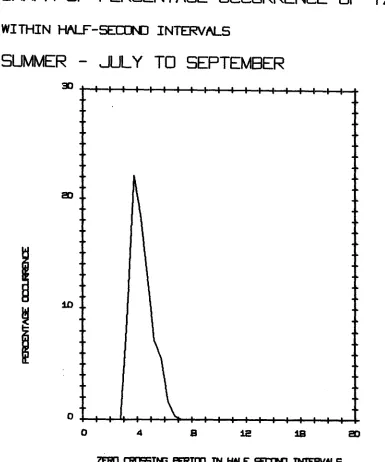
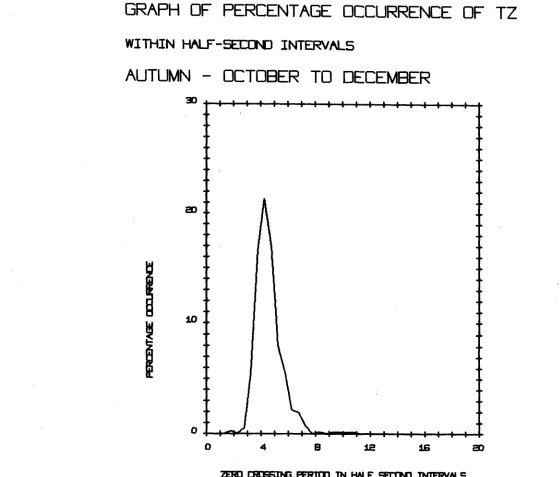
The results of these measurements are expressed graphically divided into seasons thus;
Winter; January February March Spring; April May June Summer: July August September Autumn: October November December
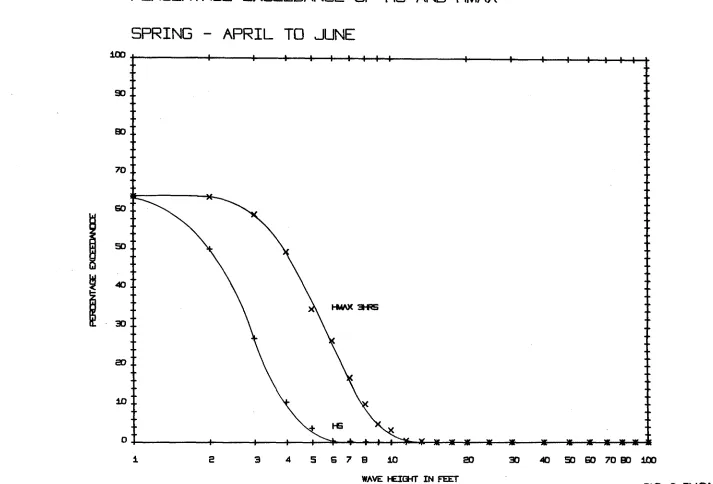
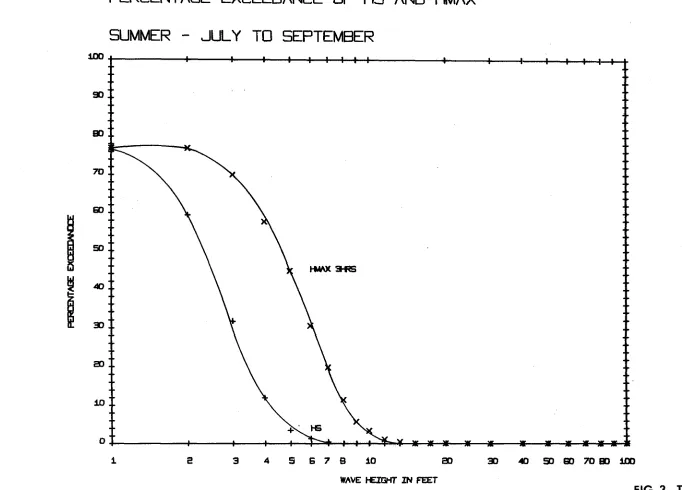
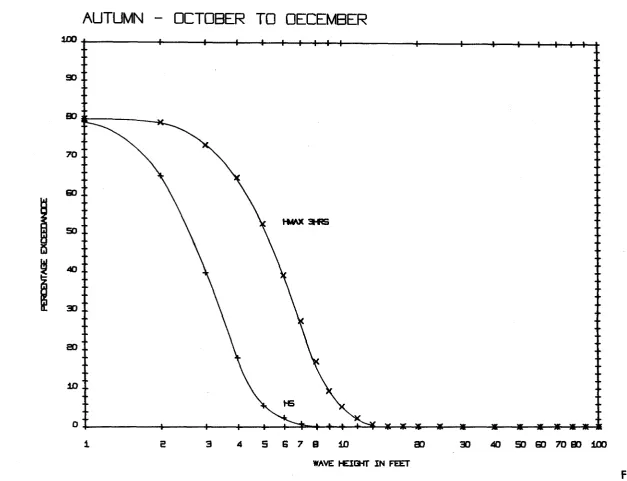
For each season a graph (Figures 1 - 4 ) shows the cumulative distribution of sigiiflcant wave height Hg, and of the most probably value of the height of the highest wave in the recording interval, Hmax (3 hours)*
- 2
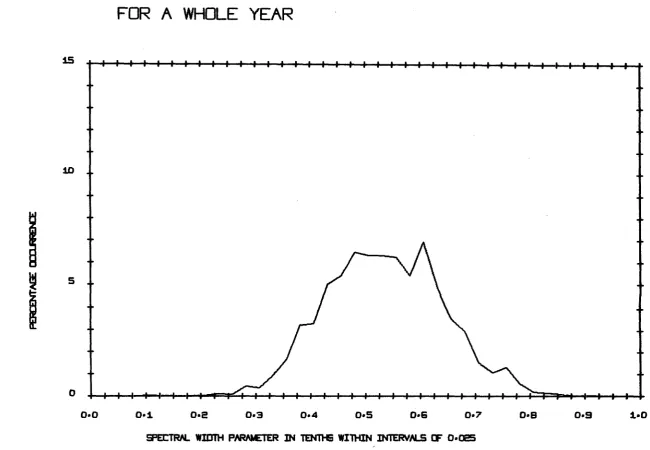
-The distribution of the spectral width parameter is given for the whole year (Figure 9).
Figure 10 is a scatter diagram relating signiiicant wave height to zero-crossing period, for the whole year.
Figure 11 is a persistence diagram for the whole year. Figure 12 is a 'Lifetime' wave height prediction graph. Discussion of Results
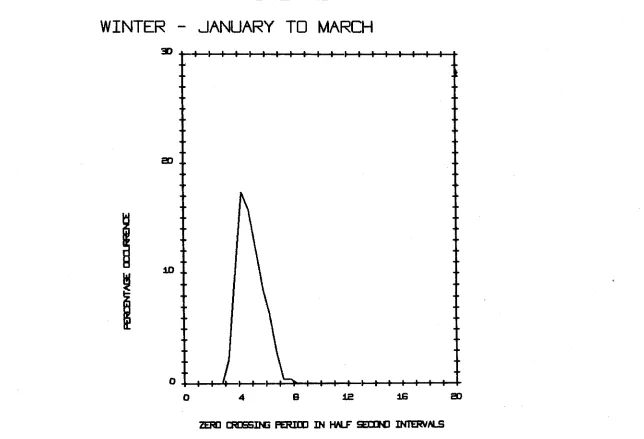
Because of the extensive areas of sandbanks around this location, and because the predominant wind direction is from the land, wave conditions in this area are not as severe at at Light Vessel stations such as V a m e (N.I.O. Internal Report A.34) or Smith's Knoll (N.I.O. Internal Report A.33). % e highest measured wave (Hi) of 13.5 feet with a zero-crossing period of 5.7 seconds, occurred on 14th April, althou^ waves almost as high occurred on 21 st July, and at other times during the winter, i'here is little seasonal variation in either the wave peiiod or spectral width parameter. The scatter diagram of Figure 10 relates the significant wave height to zero-crossing period, with the numbers of occurrences expressed in parts per thousand, for
example, the most common wave conditions were those with a significant height of between 2 and 3 feet and a zero-crossing period of between
3.5 and 4.5 seconds, which occurred for 146 thousandths, or 14*6 per cent, of the time. The rapid attenuation of the shorter waves with depth means that the pressure units, which are necessarily situation at about 4.9 feet below mean water level, do not record waves which have a period of less than about 3 seconds; this is the cause of the cut-off below that period. The figure 257 in the lower left-hand comer denotes the occurrence of calms, i.e., 25.7/S of the time.
A parameter which is sometimes of interest is the wave steepness, expressed as wave height: wave length; it may also be expressed as a decimal number. It should be noted that the steepness of a wave is not the same as the maximum slope of the water surface during the passage of a wave. Lines of constant steepness of 1 : 20 and 1 : 40 are drawn on Figure 10. (In this case, steepness relates to significant wave height: wave length calculated from the zero—crossing period), au important feature of this analysis is the number of waves with high values of steepness, which would appear to result in the occurrence of individual waves steeper than that theoretically possible, fhe reason for this is almost certainly the presence of tidal currents, which can reach 1.7 knots, according to the Admiralty chart. As the vessel is anchored, when the current is flowing strongly in the same direction as the waves, the vessel behaves as though it were travelling through the water at a speed equal
to that of the current, resulting in an encounter period shorter than the true wave period. The effect of this on the subsequent analysis is that the apparent period, and therefore the apparent wavelength, is shorter, giving increased steepness, 'ihe converse situation also applies when the tidal flow is reversed, resulting in a longer encounter period. The overall result of this effect is that there is a spread of apparent wave period introduced by the method of recording, but this is more important in its effect at shorter periods and nearly negligible at longer periods.
3
-the currents achieve 2,8 knots. (See W.I.O. Report A,46).
From the persistence diagram, Eigure 11, maybe deduced the number and duration of the occasions in 1 year on which waves persisted at or above a given height, For example, if the limit for a particular operation of a vessel is a significant height of if feet, it would have been unable to operate for spells in excess of 10 hours on 40 occasions,
or spells in excess of 20 hours on 13 occasions.
From Figure 12 may be estimated the most probable value of the height of the hi^est wave likely to occur in various long durations of time, Por example, the graph suggests that the height of the hi^est wave in a fifty-year duration is likely to be about 23 feet.
Comparisons of wind conditions during the year in question with 'nonnal' conditions.
During the time in idiich wave measurements were made the wind records at Shoebuiyness, the most appropriate meteorological statxon in the area, were rather more severe than the 11-year average. The mean wind speed was 12^,1 knots, whilst the 11 -year (1960-1970) average was 12.9 knots. The number of gale-hours was 81 compared with the average of 55. The figures are as follows:
Year 1960 61 Mean Speed 11.5 11.4 Knots
No. of hours 10 3b of gale
11-year 67 66 69 70 Mean 13.6 13.1 12,7 13.1 12,9 73 35 16 25 55
Vi'ind data Shoebuiyness
62 63 64 65 66
113 75 65 76 81
j?'rom this it may be reasonable to deduce that the recorded wave heights were somewhat higher than average. If one accepts the Darbyshire coastal waters relationship where wave height is proportional to the wind speed to the power of 1,5, then the heights given in this report should be reduced by about l6^b to achieve "average" conditions. Wave period is proportional to the square root of wind speed, aind the data should be decreased by 5/L As the waters here are shallower than those to which this DaAyshire relationship applies, the reductions to the measured parameters should be used with caution.
Acknowledgements
The authors wish to thank the Elder Brethren of Trinity House for permission to install the equipment in the vessel, and to express their appreciation of the efforts of the Piasters and Crew in taking the Records and the authors' colleague Mr. J.Wi Cherriman in installing and maintaining the equipment.
4 -RBFEREIfCES
CARTuTEGHT, D.E. and LONGUET-HI&G-INS, M.S. 1956 The statistical distribution of the maxima of a random flinotion,
Proc, roy, Soc, A 237, 212-232,
DRAPER, L. 1963 (The derivation of a 'design-wave* from instrumental measurements of ma waves.
Proc. Inst. civ. Jingrs. 26, 291-304,
DRAPISR, L, 1966 The analysis and presentation of wave data - a plea for uniformity,
Proc, 10 Conf, on Coastal Engineering, Tokyo, Chapters 1 and 2,
DRAPER, L, 1968 Y'aves at Smith's Knoll Light Vessel, North Sea R.I.O. Internal Report A.33,
DRAPER, L, and GRAVES, R. I968 ./aves at V a m e Light Vessel Dover Strait.
N.I.C. Internal Report A.34.
TUCKER, M.J. 1^56 A Shipbome Wave Recorder,
Trans, Instn. nav, Archit. Lond. 98, 236-250. 'lUCKER, M.J. 1961 Simple measurement of wave records,
Proc. Conf, ave Recording for civ. Engrs, (N.I.O.) 22-3, 'iUCKER, M.J. 1963 Analysis of records of sea waves,
PERCENTAGE EXCEEDANCE OF HS AND HMAX
WINTER - JANUARY TD MARCH
iOO 4 1 1 1—I—I I I I I 1 1—I—+•
3 4 5 G 7 B 1 J O 20
WAVE HEIGHT IN FEET
30 40 50 60 70 BO 100
PERCENTAGE EXCEEDANCE OF H5 AND HMAX
SPRING - APRIL TO JUNE
100 4 1 1 1 1 K
4 1 1 1 1
k-4-4 5 e 7 B 10 SO
WAVE HEIGHT IN FEET
30 40 50 GO 70 00 100
[image:9.847.67.780.58.542.2]PERCENTAGE EXCEEDANCE OF HS AMD HMAX
SUMMER - JULY TO SEPTEMBER
100
90 ..
80 ..
H 1 1 1 I I 4 1 1 1 1
1-4-4 5 E 7 B 10 20
WAVE HEIGHT IN FEET
30 40 50 GO 70 80 100
[image:10.846.81.763.56.546.2]PERCENTAGE EXCEEDANCE OF H5 AND HMAX
AUTUMN - OCTOBER TO OECEMBER
lOO
a 4 5 6 7 8 ID ao
WAVE HEIGHT IN FEET
[image:11.847.111.739.73.554.2]30 40 50 BO 70 80 100
GRAPH OF PERCENTAGE OCCURRENCE OF TZ
WITHIN HALF-SECOND INTERVALS
WINTER - JANUARY TO MARCH
30
4—I—I—I—I—I—I—I—I—I—I—I—I—I—I—I—1—4—I-ao ..
10 ..
o —I—1—4—I—I—I—A-4—I—I—I—I—I—I—I—I—I—H
o 4 B I S UB ao
ZERO CROSSING PERIOD IN HALF SECOTC INTERVALS
CALM = 23.47 PER CENT
[image:12.842.134.778.91.530.2]GRAPH OF PERCENTAGE OCCURRENCE OF TZ
WITHIN HALF-SECOND INTERVALS
SPRING - APRIL TO JUNE
30
ao ..
ID ..
B 12 IB ao ZERO CROSSING PERIOD IN HALF S E C O W INTERV,V_S
CALM = 3G.12 PER CENT
[image:13.846.136.673.60.517.2]GRAPH OF PERCENTAGE OCCURRENCE OF TZ
WITHIN HALF-SEEDhO INTERVALS
SUMMER - JLLY TO SEPTEMBER
30
» I » I I I I I I I I I I I I I I I I
ao ..
ID . .
B 12 I B ao ZERO CROSSING PBRIOO IN HALF SBOON] INTERV/\LS
CALM = 23.03 PER CENT
[image:14.850.211.596.60.522.2]GRAPH OF PERCENTAGE OCCURRENCE OF TZ
WITHIN HALF-SECOND INTERVALS
AUTUMN - OCTOBER TO OECEMBER
S!
B IS 16 ao ZERO LHUablNB PERIOD IN HALF SECOhD INTERVALS
CALM = 19.97 PER CENT
[image:15.851.84.644.49.526.2]GRAPH OF SPECTRAL WIDTH PARAMETER
FOR A WHOLE YEAR
15 « ' I « I I t I I t I I I I I I I I I I I I I I I I I I I I I I I I I i I I I
ID . .
y 5 ..
H—I—I—t-H—I—I I r- i •> I
I—I-0*0 0*1 0«a 0.3 0*4 0.5 O'G 0.7 O'B 0*9 l.O
SPECTRAL WIDTH PARAMETER IN TENTHS WITHIN INTERVALS OF 0.025
CALM = S5.G5 PER CENT
[image:16.847.121.772.84.534.2]SCATTER DIAGRAM FOR THE WHOLE YEAR
IN PARTS PER THDLBAND
»» = 1 DCCURRENCE, + = E OCCURRENCES
ao 4 1 h 4 1 1
4 — 1 1 1 1 1 1 1 1—4 1 1 1 1 1
1-IB IB 14 le
5
$
a 10 B S 4 2 ."94 1 1 1 h
i \ Z
2 1 4 4 2 1 2 /
-12 SB 3 2 ^ 9 \ 3 \4 ^ 2 5 \ 1 0 « V il'%i_S/i4 13 ^ 4 IS 12 10 4
4 1 1 1 1
1-4 5 G 7 8 9 1 D 1 1 1 2
ZERO CROSSING PERIOD IN HALF SECOhO INTERVALS
[image:17.847.79.779.67.546.2]4 1 1 1 1 1 1 1 1 1 ( 1 1 1 1 1 1 1 #-13 14 15 IB ±7 IB
NLMBER OF OCCURRENCES OF WAVE CONDITIONS
EXCEEDING A GIVEN OLRATION
g s e S S S S I
i §
o
Z
o
ni
(1)
U) 0) N m 6 "i
8 ••
8 8 8 8 •' 3
8
I I I I I I I—I I I I I I I I I I I I I I I I I I I I I I
i
If)
t
•
H
I
s
0 0001
00002
00005
0-001
0002
0 0 0 5
0 0 1
0 05
0 1
02
LU
u
0 5
i
S
2
LU U
X
c
LU ^
TONGUE 1966
1 UJ
10
20
Z
LU u(K 30
LU