Title: Activity Based Costing and Process Benchmarking: An
Application to General Insurance
Sarath Delpachitra
Journal: Benchmarking: An International Journal
ISSN: 1463-5771
YEAR: 2008
DOI: 0.1108/14635770810864857 Publisher: Emerald
Abstract: Purpose – Aim of this paper is to set some cost benchmarks for the cost of processing an insurance application and processing a claim.
Design/methodology/approach – Activity Based Costing (ABC) model. The ABC model was applied to a unified business process and set the benchmarks for the cost of processing an application and a claim.
Findings: The average cost per application is approximately AUD221 and the cost of processing a claim is AUD260. The cost of support functions is higher in the case of application processing and back office direct costs are higher in the case of claim processing.
Research limitations/implications – The success of benchmarking exercises depends on the cooperation of the benchmarking partners. Furthermore the benchmarks can be more accurate when ABC is applied to the business processes. Most insurance
providers are yet to adopt the ABC model.
Originality/value - This paper introduces the breakdown of the processing costs for general insurance. The breakdown is given on the basis of direct and indirect costs as well as front office, back office and support function costs. To the best of author’s knowledge this is the first application of process benchmarking to the insurance industry.
Keywords: Activity Based Costing, Process Benchmarking, Application Processing, Claim Processing
Activity Based Costing and Process Benchmarking: An Application
to General Insurance *
Sarath Delpachitra
Department of Finance and Banking Faculty of Business
University of Southern Queensland Toowoomba, QLD 4350, Australia Ph: 61 7 4631 1363
Fax: 61 7 4631 1527 email: [email protected]
Sarath Delpachitra is a senior academic in the Faculty of Business at the University of Southern Queensland.
Acknowledgements
Introduction
The application of activity based costing (ABC) to financial services in Australia has been evolving slowly. When applying ABC to financial services, the basic premise is that an institution’s outputs give rise to the need for operating, management and control activities, and that there are costs incurred in providing such activities. If a cost can be assigned to those activities in delivering the outputs, and the activities can be traced back to resources along with their routing, such information can be used not only to predict the demand for various activities but also the costs of those activities. Furthermore, ABC models have the capacity to generate a performance statement which is sometimes identified as a “forth financial statement” in predictive accounting (Brimson, 2002). To generate useful information, ABC models require a properly identified business process, with each activity in the process defined and measured using an appropriate measurement (in terms of costs or time), and a clearly identified relationship between the product or services to the activities and costs (Hicks, 1998). This shows why financial institutions have been slow to adopt ABC models; adopting ABC models requires investment in a considerable amount of human resources, external consultants and painful system identification or re-thinking. However, ABC models generate economic-cost items related to activities that can be used effectively in decision making processes. Another advantage of ABC models is that they provide a basis for business process re-engineering (BPR) or restructuring. The development in ABC models and differences in their application are examined by Kellermanns and Islam (2004).
The application of ABC and/or BPR will not be successful unless process benchmarking is included in the strategy. In particular, process benchmarking is an effective tool in monitoring performance of each activity in the business process and provides valuable information required for the forth financial statement described above. The popularity and benefits of the application of benchmarking in the area of financial services are well documented (McNair and Leibfried, 1992; Elmuti and Kathawala 1997, Anderson 1999; Rolston et al. 2001; Delpachitra and Beal, 2002; Batiz-Lazo; 2004 and Ho and Wu, 2006). The nature of difficulties in adopting process benchmarking has also been well documented in the literature (see, for example, Gable et al., 1993; Rogers et al., 1995; Whymark, 1998 and Yasin, 2002). However, the benefits of benchmarking, such as reduced costs, higher productivity and improved customer services, outweigh the problems of benchmarking (see Yasin and Zimmerer, 1995; Whymark, 1998; Dorsh and Yasin, 1998). Besides, benchmarking facilitates strategic planning and provides a clearer focus for strategic goal setting (Zairi, 1994; Smith, 2000).
benchmarking study with a discussion of key findings. The final section summarises the major conclusions of the process benchmarking study.
ABC and claim management
The insurance industry across the world has been under intense pressure from competitors for market share. Particularly in Australia, the last decade has seen a dramatic increase in market concentration for insurance products, as many banks and other small financial institutions began to offer a variety of insurance products through different partnership arrangements. This has led to a number of new issues as described below.
1.The firms in the industry needed to control/reduce costs of generating an application or processing a claim to remain competitive.
2.With outsourcing becoming more popular, firms needed to decide between in-house processing and outsourcing to improve processing efficiency and productivity.
3.Firms were forced to streamline processing through the use of information technology because it proved to be more productive.
4.The industry drew more attention from the regulators, thus adding more compliance costs.
The upward pressure on claim costs has increased due to both external and internal factors. The external factors include an increase of the regulatory burden and reporting requirements, increase in insurance frauds and claims leakage. In addition, the compensation culture is becoming the norm in the event of human-made disasters such as terrorism. The internal factors not only included the cost of facing external factors but also the drive by firms to retain clients and ensure customer satisfaction, and the desire to offer an efficient processing system to meet customer expectations. The industry in general had to manage the cost issues through BPR using an appropriate mix of human resources and technology.
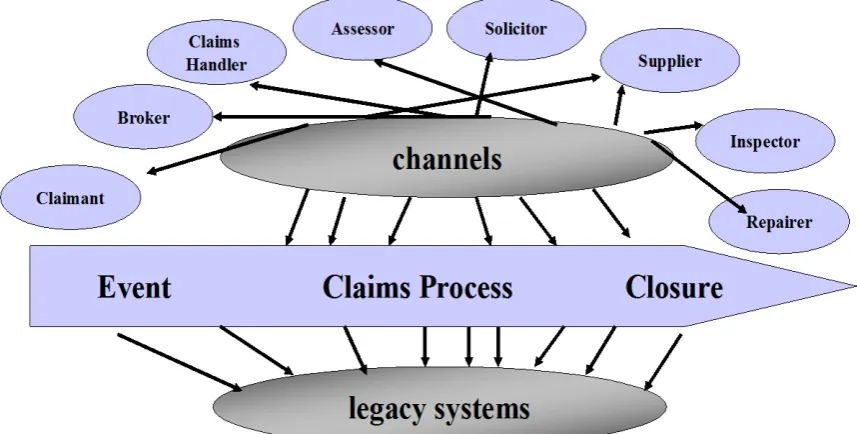
The complexity of the claims function is depicted in Figure 1. This complexity clearly illustrates why institutions are reluctant to apply ABC models. The recent advent of insurers dealing with multi-channel processes, applications with wider customer bases (such as inter-state customers in Australia) and related changes in legal obligations have made the application of ADB quite a tedious and costly exercise.
[Figure 1 taken in about here]
Process Benchmarking in Insurance
competitiveness and overall business performance. Thus process benchmarking is a method of continuous measurement to compare a firm’s business processes with its competitors to obtain information that will help to identify its key strengths and weaknesses and then to take appropriate measures to eliminate the weaknesses while maintaining the strengths. If a firm can improve its efficiency over the others, either through technical or allocative means, it could be in a much stronger position to weather adverse climates.
The value of process benchmarking and it applicability to the financial services industry was first examined by Delpachitra and Beal (2002). In particular, process benchmarking analyses the discrete work processes involved in a range of business systems such as accounts payable, budgeting, invoicing, settlements and handling customer complaints. This form of benchmarking seeks to identify the most effective operating practices in a collection of many institutions that perform similar work functions. Therefore, process benchmarking could be considered to be an indirect measure of operational efficiency. In other words, process benchmarking guides firms to use their limited resources more productively and efficiently.
It is generally accepted that process benchmarking involves a substantial commitment of resources, in particular, time and personnel. Furthermore, it is very difficult to form benchmarking partnerships because process benchmarking involves divulging information that is generally considered to be commercially sensitive or confidential to the institutions. Financial institutions in Australia, and indeed in the world, have been slow to adopt process benchmarking for two reasons. First, they have strictly guarded their confidential internal processing information. Second, they are reluctant to invest in the application of ABC models, despite the perceived advantages of their application, due to resource constraints. Therefore, they have tended to concentrate more on convenient performance and strategic benchmarking which do not require sharing commercially sensitive information. A substantial body of empirical research has been published on benchmarking the efficiency of financial institutions using secondary data sources (Berger and Humphrey, 1997). Despite the difficulties of applying ABC models, some insurers in Australia have taken a pioneering step by adopting them for costing internal processes. However, they have not been able to benchmark their processes with the industry due to difficulties in forming benchmarking partnerships. Recognising this fact, with the support of Fuji Xerox Financial Australia Pty Ltd, this project was undertaken to develop process benchmarking partnerships among leading general insurers. This paper describes the extension of the use of ABC to benchmark the general insurance application and claim processes.
Research objectives and methodology
The process benchmarking study was conducted for two financial institutions using three brand names.1
1
Thus the sample included three separate operations as financial statements were prepared based on the brands.
•Separate processing costs to gain a better understanding of the end to end processes.
•Identify the cost and time involved in the application and claim to estimate benchmarks.
•Analyse and determine the reasons for the different cost structures between sample institutions’ front- and back-office operations and processes.
In order to identify a standard business process, recommendations from an advisory panel comprising members of six major insurance providers were sought.2
•personnel costs, including salaries and wages, bonuses, directors’ fees, packaged salary items, on-costs and residual costs such as recruitment and training;
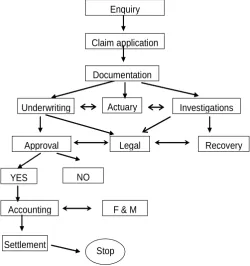
The standard insurance claim process used for benchmarking is given in Figure 2.
[Figure 2 takes in about here]
Eight standardised major cost line item categories were developed based on the outcomes of Delpachitra and Beal (2002) and the recommendations of the advisory panel. The costs were:
• information technology costs, including hardware, software, maintenance, development and other costs such as printing and backup;
• premises costs, including rent/leasing charges, leasehold improvements, furniture and fittings, outgoings such as rates and electricity, and repairs and maintenance;
• communications cost, including telephones, facsimiles, postage and couriers;
• transaction-based operating expenses such as filing fees, bank charges, commissions and stamp duty;
• professional fees, including corporate and association membership fees and external professional advice such as audits and consultancies;
• marketing and public relations costs; and
• other residual costs, such as income tax and printing and stationery.
In order to standardise organisational and operating structures, three major cost categories, namely support functions, front office and back office, were used. Support functions included cost centres such as marketing, portfolio management, human resources management, head office charges, compliance and reporting, information technology and updating customers. Front office included enquiry, application and documentation while back office covered actuary, investigation, approval, legal, underwriting, settlement and accounting, the last of which included filing and maintenance.
Benchmarking partners were provided with a spreadsheet template for the detailed recording of their costs against the standardised cost line items and functions for the financial year. They were also given the definitions of each cost category for reference purposes. The partners traced all line item costs to appropriate operating and support functions to determine the direct cost of each function. They also traced the direct costs of front- and back-office functions to products as far as practicable. Finally, they traced all direct costs of support functions to front- and back-office
2
functions and then to products. These allocations were subsequently checked to ensure consistency before calculating standard benchmark measures. The average cost, average percentage of total cost, and average cost per application/claim measures (See Appendix 1) were applied to the computed full cost of core operating functions related to applications and claims.
Results and discussion
Tables 1 provides an analysis of the distribution of costs among front office direct costs, back office direct costs and support function costs, which are considered as indirect costs. The full cost of the product is calculated by adding the direct and indirect costs traced to an application and a claim of each participating institution. The average cost of processing an application is $221.28. The share of back-office direct costs is approximately 13% of the total cost. Similarly, the share of support function costs of an application is approximately 65%. This implies that generating applications involves substantial support costs. In contrast, the average cost of processing a claim is $260.05. Unlike the case of application, the share of back-office direct cost is over 35%. The share of support function costs of an application is approximately 35%. This means that claim processing involves a much greater proportion of direct costs than indirect costs. These results will undoubtedly be useful in process improvement or re-engineering exercises.
[Table 1 takes in about here]
Table 2 further examines the costs of processing an application. As might be expected, the front office cost of generating a policy document is much higher than the back office costs. The lowest total cost of processing an application is theoretically $121. However, this figure should be treated with caution because it comprises the total of the lowest costs for all functions and all bands considered in this study. In reality, it is unlikely that a single institution would consistently achieve the lowest cost for all functions. The cost of underwriting showed the largest variation among the brands, which may be an indicator of the market power of underwriting. Brands that employed an internal underwriting service as opposed to outsourcing had lower underwriting costs than the benchmarks.
[Tables 2 take in about here]
The institution that utilised non-branch based distribution channels, such as brokers and dedicated sales, to originate applications had higher average costs. The documentation cost comprises approximately 0.42% of the back-office costs. This indicates the benefits of adopting document solution systems in application processing. .
[Table 3 takes in about here]
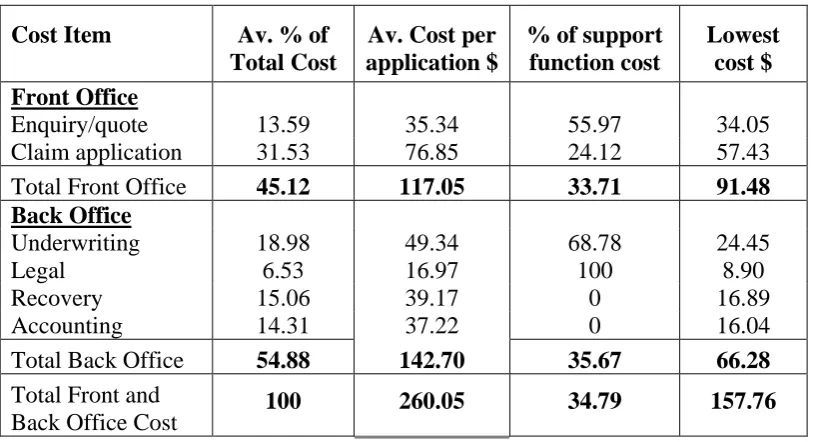
Table 3 further shows that the lowest total cost of processing a claim is approximately $158. As in the case of applications, this figure too should be treated with caution because it comprises the total of the lowest costs for all functions in all bands considered in this study. Here too, it is unlikely that a single institution would consistently achieve the lowest cost for all functions but it shows that firms should set benchmarks when applying continuous process improvements.
The most intriguing result observed in this study was that both institutions offered an almost identical range of general insurance products but reported substantial differences in activity costs. This suggests that the type of delivery channels used and the excess capacity maintained may have contributed to the gaps in costs between the institutions. For instance, the institutions that relied on broker networks and dedicated sales outlets reported substantially higher costs. Unfortunately the data related to these differences cannot be shown due to commercial sensitivity.
In general, three important lessons can be learnt from this study.
1. The ABC models are slowly being adopted by the financial institutions as they provide valuable information about the value chain, but benchmarking is currently confined to internal activities only.
2. The benefits of forming benchmarking partnerships are obvious. However, financial institutions are yet to apply ABC or even to identify the key processes and related activity costs. Therefore they have not been able to reap the benefits of process benchmarking.
3. Some Australian insurance service providers in particular have undertaken comprehensive BPR but have not integrated process benchmarking because the relationship between BPR and benchmarking is not recognised. As a result they have not been able to achieve the expected benefits of BPR. This paper shows the benefits of applying process benchmarking.
The implications of these lessons are that there is potential for further research in the application of benchmarking to financial institutions tracing the process back to multiple delivery channels.
Conclusion
Whilst process benchmarking is relatively simple, it provides useful information for users to maintain their market competitiveness when it is combined with ABC models. In a highly competitive, globalized financial market environment, if an institution could maintain cost efficiency in its internal processes, it would be strategically in a stronger position to face competition and retain a healthy market share. Calculation of process benchmarks enables participating institutions to consider critically their cost structures by highlighting functions where the individual institution has either a comparative cost and time advantage or disadvantage over competitors.
improve profitability in their business operations and lead to improved efficiency across the institution.
The benchmarking study presented in this paper highlights the fact that institutions have been able to diversify the internal processes involved in general insurance. They have been able to make substantial cost savings in the value chain through diversified operations such as outsourcing and alternative distribution channels. However, such diversifications need to be carefully considered along with the cost drivers.
Although process benchmarking involves the dedication of valuable resources in terms of personnel and time and also divulging commercially sensitive information, this research provides evidence that all institutions, regardless of size and the scale of operation, can greatly improve their ability to sustain a competitive edge by participating in benchmarking exercises on a regular basis. Increased participation in benchmarking will lead to the re-engineering of their operational processes and improvement of efficiency.
References
Anderson, B. (1999), “Industrial benchmarking for competitive advantage", Human Systems Management, Vol. 18 No. 3/4, pp. 287-296.
Batiz-Lazo, B. (2004), “Benchmarking financial services and on-line innovations”,
Benchmarking – An International Journal, Vol. 11 No. 5, pp. 431-446.
Berger, A.N. and Humphrey, D.B. (1997), “Efficiency of FIs: a review and preview of research past, present and future”, Journal of Banking and Finance, Vol. 17, pp. 221-249.
Bogan, C.E. and English, M.J. (1994), Benchmarking for Best Practices: Winning Through Innovative Adoption, McGraw-Hill, New York
Brimson, A. J. (2002) Process – Based Accounting: Leveraging Processes to Predict Results, American Institute of Certified Practicing Accountants Inc, New York.
Delpachitra, S. and Beal, D. (2002), “Process Benchmarking: An Application to Lending Products”, Benchmarking - an International Journal, Vol. 9, No.4 pp. 409-420.
Dorsch, J.J. and Yasin, M.M. (1998), “A framework for benchmarking in the public sector: literature review and directions for future research", International Journal of Public Sector Management, Vol. 11, pp. 2-3.
Elmuti, D. and Kathawala, Y. (1997), “An overview of benchmarking process: a tool for continuous improvement and competitive advantage”, Benchmarking for Quality Management & Technology, Vol. 4 No 4, pp. 229-243.
Gable, M., Fairhurst, A, Dickinson, R. (1993), “The use of benchmarking to enhance marketing decision making”, Journal of Consumer Marketing, Vol. 10 No. 1, pp. 52-60.
Hicks. D. T., (1998), Activity Based Costing, 2nd Edition, John Wiley & Sons, Inc. Toronto.
Ho, T. and Wu, Y. (2006), “Benchmarking performance indicators for banks”,
Benchmarking – An International Journal, Vol. 13 No 1/2, pp. 159 -
Kellermanns, F.W. and Islam, M. (2004), “US and German activity-based costing: A critical comparison and system acceptability propositions, Benchmarking – An International Journal, Vol. 11 No. 1, pp.31-51.
McNair, C.J. and Leibfried, K.H.J. (1992), Benchmarking, Harper Collins, New York Porter, M.E. (1985), Competitive Strategy: Techniques for Analysing Industries and
Competitors, Free Press, New York.
Rogers, D.S., Daugherty, P.J. and Stank, T.P. (1995), “Benchmarking programs: opportunities for enhancing performance”, Journal of Business Logistics, Vol. 16 No. 2, pp. 43-63.
Ralston, D., Wright, A. and Kumar, J. (2001), “Process benchmarking as a market research tool for strategic planning”, Marketing Intelligence and Planning, Vol. 19 No. 4, pp. 273-281.
Smith A. M. (2000), “Using consumer benchmarking criteria to improve service sector competitiveness”, Benchmarking: An International Journal, Vol. 7 No. 5, pp. 373-388.
Whymark, J. (1998), "Benchmarking and credit risk management in financial services",
Yasin, M.M, and Zimmerer, T.W. (1995), “The role of benchmarking in achieving continuous service quality”, International Journal of Contemporary Hospitality Management, Vol. 7 No. 4, pp. 27-32.
Yasin, M.M. (2002), “The theory and practice of benchmarking: then and now”,
Benchmarking – An International Journal, Vol. 9 No. 3, pp. 217 – 243.
Zairi, M. (1994) “Benchmarking: the best tool for measuring competitiveness”,
Figure 2: Insurance Claim Process
Claim application Enquiry
Approval
NO YES
Documentation
Investigations
Legal
Accounting F & M
Underwriting
Settlement
Recovery Actuary
Appendix 1: Definition of benchmark measures
Benchmark Measure Definition
1. Average Cost The average of a cost line item, function or product cost. 2. Average % of Total
Cost
A cost line item or function cost as a percentage of a relevant total item or function cost, averaged for all brands.
3. Average Cost per application/claim
A cost line item, function or product cost divided by total application volume, averaged for all brands.
4. Lowest Cost per application/claim
A lowest cost line item, function and product cost per loan within the sample firms that reported that cost line item, function or product.
Table 1: Benchmarks for major cost categories
Cost item
Application processing Claim processing
Average % of total
cost
Average Cost per application
$
Average % of total
cost
Average Cost per application
$
Front office 22.06 54.24 29.91 77.79
Back office 13.09 23.54 35.30 91.80
Support Functions
64.85 143.50 34.79 90.47
Total 100.00 221.28 100 260.05
Table 2: Benchmarks for processing cost of an application
Cost Item Av. % of Total Cost
Av. Cost per application $
% of support function cost
Lowest cost $ Front Office
Enquiry/quote 36.04 79.75 38.79 68.99
Policy document 20.06 44.39 87.78 20.80
Total Front Office 56.10 124.14 56.31 89.79
Back Office
Actuary 1.09 2.40 0 1.84
Documentation 0.42 0.93 0 .70
Underwriting 40.37 89.34 82.37 25.37
Accounting 2.02 4.47 0 3.39
Total Back Office 43.90 97.14 75.76 31.30
Total Front and
Back Office Cost 100 221.28 64.85 121.09
[image:15.595.99.504.339.554.2]Table 3: Benchmarks for processing cost of a claim
Cost Item Av. % of
Total Cost
Av. Cost per application $
% of support function cost
Lowest cost $ Front Office
Enquiry/quote 13.59 35.34 55.97 34.05
Claim application 31.53 76.85 24.12 57.43
Total Front Office 45.12 117.05 33.71 91.48
Back Office
Underwriting 18.98 49.34 68.78 24.45
Legal 6.53 16.97 100 8.90
Recovery 15.06 39.17 0 16.89
Accounting 14.31 37.22 0 16.04
Total Back Office 54.88 142.70 35.67 66.28
Total Front and
Back Office Cost 100 260.05 34.79 157.76