OTDM Add–Drop Multiplexer Based on
Time–Frequency Signal Processing
Paulo J. Almeida, Periklis Petropoulos, Francesca Parmigiani, Morten Ibsen, and David J. Richardson
Invited Paper
Abstract—A time-division add–drop multiplexer capable of high-extinction-ratio operation is presented both theoretically and experimentally. The approach used is based on time-to-frequency domain conversion of optical signals and relies upon the switch-ing of linearly chirped optical pulses. By convertswitch-ing a 40-Gb/s optical time-division multiplexing (OTDM) signal to 4×10-Gb/s wavelength-division multiplexing (WDM) channels and using fiber Bragg gratings for frequency-domain add–drop multiplexing, a timeslot suppression ratio in excess of 30 dB and error-free opera-tion for the dropped, through, and added channels were achieved. A further stage of WDM-to-TDM signal conversion was used to map the resulting signal back into the time domain. Moreover, it is shown that it is straightforward to simultaneously operate on multiple channels by simply cascading gratings to make more complex filtering functions without the requirement for any fur-ther synchronization of the tributary channels.
Index Terms—Chirp modulation, multiplexing, optical fiber switches, optical signal processing.
I. INTRODUCTION
F
UTURE high-speed optical networks will require en-hanced functionality in the optical layer in order to exploit the full potential of the optical fiber and reduce the latencies associated with optical to electrical (O/E) conversion and elec-tronic processing. The optical fiber itself can be viewed as a powerful and convenient optical processing tool, and significant research has focused on developing fibers with optimized pa-rameters for specific applications. One of the more fundamen-tal optical processing applications is time-division add–drop multiplexing (TADM), which allows the removal and aggrega-tion of tributaries from an ultrahigh-speed network at interme-diate points of the transmission system without affecting any adjacent channels.Several groups have previously demonstrated TADM based on three different concepts, namely 1) nonlinear switching, 2) multiple-wavelength conversion, and 3) ultrafast electroop-tic modulation [1]–[11]. TADM devices based on nonlinear switching are normally four-port systems. The two input ports contain the data signal and a synchronized clock, which is
Manuscript received November 21, 2005; revised April 4, 2006. This work was supported in part by the Sixth Framework Program (FP6) European Network of Excellence e-Photon/ONe+, VD-T. The work of P. J. Almeida was supported by the Fundação para a Ciência e Tecnologia (FCT) of Portugal.
The authors are with the Optoelectronics Research Centre, University of Southampton, Southampton SO171BJ, U.K. (e-mail: [email protected]; [email protected]).
Digital Object Identifier 10.1109/JLT.2006.875947
responsible for changing the state of the switch. The data signal is then transmitted to either of the two output ports depending on whether the switch is excited or not. Several nonlinear switching mechanisms have been proposed for TADM, such as wavelength shifting [1], polarization rotation [2]–[4], and cross-phase modulation (XPM) in a nonlinear loop mirror [5]–[7]. Though this technique has the advantage of a simple configu-ration, the typical extinction ratio of the switching window, as defined by the nonlinear transfer function of the switch, gives limited clearing efficiency within the dropped-channel timeslot in most cases.
In multiple-wavelength-conversion schemes, two wavelength translation processes are used [8]–[10]. Two clock signals at different wavelengths are prepared: One at the repetition rate of a single tributary and the other an (N−1) ×multiplexed clock signal, whereNis the total number of tributary channels. The clock signals are synchronized to the incoming data stream, and the clock and data are coupled into a wavelength converter, which separates the data into two different wavelengths. A further stage of wavelength conversion is necessary if it is required to maintain the original wavelength for both of the separated signals. The ultrafast-modulators-based approach has the advantage of low total power consumption but requires separate modulators for the drop and add functions [11].
Although all the previous techniques are capable of operating at very high bit rates, the associated dropped-channel suppres-sion ratios are typically less than 25 dB. This can be a severe limitation to cascaded add–drop multiplexing. Jepsenet al.[12] reports a study of the requirements for cascading TADMs in terms of the dropped-channel timeslot suppression and pulse-peak-to-pedestal ratio for the added channel. It shows that in a realistic cascaded add–drop operation at 40 Gb/s, where it is not always the same channel that is dropped, an extremely high pulse-peak-to-pedestal ratio, i.e., in excess of 40 dB, is necessary to guarantee error-free performance within a 1-dB power penalty for slot suppression values under 25 dB. It also shows that the pulse quality of the added channel can be relaxed if the timeslot clearing efficiency is increased; for example, for the same system, a suppression ratio of 35 dB reduces the peak-to-pedestal extinction of the added channel to 33 dB. Beyond the 35-dB slot suppression, there is no significant improvement, and the quality of the added pulse is the dominant factor that affects scaling to higher bit rates. Therefore, timeslot suppression ratios in excess of 30 dB are a key requirement when cascading add–drop nodes.
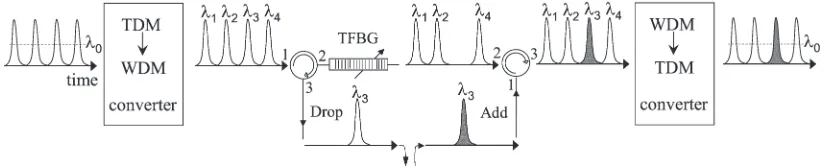
Fig. 1. Concept of the OTDM add–drop multiplexer based on time-to-wavelength conversion.
In this paper, we demonstrate a novel TADM technique op-erating at 40 Gb/s based on the principle of time-to-wavelength conversion, which is capable of providing a timeslot suppres-sion ratio of 35 dB. The origins of our technique lie in the observation that whereas many optical processing functions are best performed in the time domain, superior performance can also be achieved for others by processing in the spectral (frequency) domain. If one is able to efficiently convert opti-cal signals between the time and frequency domains, then it becomes possible to develop systems in which the required optical processing steps are performed in whichever domain provides the best performance, enabling such functions as compression/expansion of waveforms [13] and flexible channel multiplexing [14] by simply including conventional passive elements in the system.
Unlike TADM, which normally requires critical synchroniza-tion and state-of-the-art ultrafast switches, high-suppression-ratio wavelength add–drop multiplexing (WADM) can readily be achieved using commercially available passive optical filters. In our TADM approach, we therefore convert the incoming OTDM signal into a mixed time-division-multi-plexing–wavelength-division-multiplexing (TDM–WDM) rep-lica, which maps the individual tributary channels onto discrete separate wavelengths while retaining the critical pulse-timing information, opening the possibility to process the signal directly within the frequency domain (and additionally, within the time domain if required). We demonstrate that a peak dropped-channel timeslot suppression ratio of 35 dB can readily be achieved by this means. Because it is possible to create relatively complex filters with well-defined phase and amplitude responses over large bandwidths, e.g., using fiber Bragg grating (FBG) technology, all the tributary channels can be processed simultaneously in a single fiber without the need for additional channel synchronization, making the device power efficient and compact.
This paper is organized as follows: In Section II, we describe the principle of the proposed add–drop multiplexing technique and define the separate building blocks required to implement it. The following three sections describe in detail each of these building blocks: Section III concerns the generation of linearly chirped pulses with a flat intensity profile, which are the key to our time-to-wavelength-conversion mechanism; Section IV looks into the details of nonlinear switching of these pulses using XPM (this analysis is in the context of a nonlinear optical loop mirror (NOLM), which is our preferred switch embodiment); and Section V details the implementation of the add–drop function using FBGs and their characterization. The demonstration of the 40-Gb/s TADM system as a whole is described in Section VI, and finally, conclusions are drawn in Section VII.
II. PRINCIPLE OFTADM USING
TIME-TO-WAVELENGTHCONVERSION
The TADM technique we propose is illustrated in Fig. 1. An incoming transmitted high-speed TDM signal is first con-verted into a mixed time–wavelength multiplexed format. The specific technological approach we have adopted to perform the TDM–WDM conversion is shown in Fig. 2 and is based on the nonlinear switching of linearly chirped pulses in a low-pulse-walkoff broadband NOLM. In this mixed format, the sig-nal maintains its time sequence, whereas each tributary channel is shifted onto a different wavelength. We have identified that, in the case of the NOLM gate, a minimum chirp rate is required to map the incoming data pulses onto distinct wavelength-multiplexed bands, as will be discussed in Section IV. The dual time–wavelength mapping of the data signal allows the use of spectral filters (as well as ultrafast switches if desired) for the manipulation of the signal.
For example, add–drop multiplexing in a mixed-format sig-nal can be performed using a reflective FBG filter in a two-circulator configuration commonly used in WADM (Fig. 1). The tunable FBG (TFBG) filter is centered at the wavelength of one of the tributary channels, which is reflected to port 3 of circulator 1. The signal transmitted through the FBG filter into port 2 of circulator 2 corresponds to the remaining tributary channels with one timeslot (and the corresponding wavelength) cleared out. A new channel can be added to the cleared timeslot and within an empty spectral region. Furthermore, this process can be extended to any of the remaining tributary channels simply by cascading more TFBG stages within the setup. A final conversion back to a pure single wavelength TDM signal might be necessary if the add–drop multiplexer is in the mid span of a transmission line. Fig. 3 shows a diagram of the WDM–TDM converter used in this paper, which is based on carving a continuous-wave (CW) beam at the desired wavelength with the mixed TDM–WDM signal representation using a NOLM designed for broadband operation with low interchannel temporal walkoff.
Our particular TADM was designed to operate at 40 Gb/s with four 10-Gb/s tributary channels. The detailed design and performance characteristics of the full system are described in Section VI. In the succeeding sections, we review the detailed operation of the individual subcomponents of the system.
III. GENERATION OFLINEARLYCHIRPEDPULSES
Fig. 2. Schematic diagram of the TDM to mixed TDM–WDM converter.
Fig. 3. Schematic diagram of the mixed TDM–WDM to pure TDM converter.
the aggregated tributaries. The chirp rate has to be sufficiently large so that adjacent tributaries become spectrally distinct after TDM–WDM conversion. Linearly chirped pulses can be easily obtained by dispersive propagation of short pulses emitted by a mode-locked laser. However, the typical band-width of high-repetition-rate telecommunication lasers does not exceed ∼2 nm, which is not sufficient for our application. Therefore, the first issue is the broadening of the laser source spectrum. Ultrawide spectral broadening spanning several hun-dreds of nanometers has been previously reported by many authors based on supercontinuum generation processes, but pulse breakup and phase coherence degradation can be severe during the generation process if the spectrum extends into the anomalous dispersion regime. Even at high repetition rates (i.e., higher than 1 GHz), where the relatively low achievable peak powers yield only self-phase modulation (SPM)-induced spectral broadening, phase coherence can be severely degraded by modulation instability [15], [16].
For the generation of spectral broadening suitable for telecommunications applications, the use of either dispersion-decreasing fibers (DDFs) [17] or low normal-dispersion dispersion-flattened fibers (N-DFFs) [18] has been reported. The use of DDFs can give significant spectral broadening. However, the flatness of the spectrum is usually compromised by high-order soliton effects, unless adiabatic soliton com-pression is used. Moreover, such fibers are difficult to source commercially. The schemes employing N-DFFs take care to ensure that the zero-dispersion wavelength of the fiber lies well outside the generated wavelength range in order to avoid the onset of modulation instability, which may also compromise the spectral flatness achievable.
Apart from spectral broadening, the temporal envelope of the highly chirped pulses also has to be stretched to overlap all the aggregated tributaries. For example, for the experiments described herein, the pulses should be 100 ps wide to accom-modate all four 10-Gb/s tributaries. For illustrative purposes, the intensity traces in Figs. 4 and 5 were obtained at the reduced repetition rates of 1.25 and 2.5 GHz, respectively,
Fig. 4. (Top) Schematic of the chirped-pulse generator using DCF as pulse stretcher. (Bottom) Experimental traces of chirped-pulse spectrum and intensity profile.
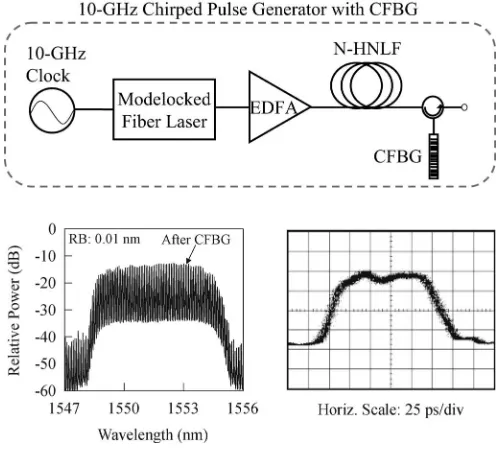
Fig. 5. (Top) Schematic of the chirped-pulse generator using CFBG as pulse stretcher and shaper. (Bottom) Experimental traces of chirped-pulse spectrum and intensity profile.
TABLE I
CHIRPED-PULSEGENERATORSFIBERPARAMETERS
[image:3.594.306.554.333.558.2] [image:3.594.307.554.628.667.2]broadening, which is typical in the generation of SPM in fibers, is a major limitation to this scheme, as pulse stretching results in a Fourier transformation of the spectral envelope into the time domain [19] (see oscilloscope trace in Fig. 4). Such s trong intensity fluctuations can be detrimental to the performance of a nonlinear switch, as they can induce large waveform distortion and amplitude noise. Although an HNLF with a smaller dis-persion slope than N-HNLF can generate symmetric spectral broadening and reduce rippling to 1–2 dB, the smooth edges of the spectrum will always result in long trailing and leading tails for the stretched pulse, which is similar to the case in Fig. 4. Thus, a chirped FBG (CFBG), with sharp edges that slices a flat portion of the broadened spectrum is a better suited pulse stretcher option for our applications (Fig. 5). The CFBG we used in our experiments sliced a flat portion of 6 nm (between 1548 and 1554 nm) of the broad spectrum of Fig. 4, as shown in Fig. 5, with an extinction of∼25 dB. Furthermore, the CFBG had a linear chirp that was such in order to ensure that the reflected pulses had a duration of∼100 ps (Fig. 5). In this case, the stretched pulse develops into a rectangular waveform. It will be shown in the following section that the 6-nm bandwidth of the linearly chirped pulses is suitable for mapping 40-Gb/s pulses into four 10-Gb/s WDM channels. It should be noted, however, that several promising techniques have been reported in the literature, which can potentially be used to generate even broader flat-topped and sharp-edged spectra [20]–[22], as would be required for the scaling of the technique to higher bit rates.
IV. NONLINEARSWITCHING OFLINEARLY
CHIRPEDPULSES
The scheme proposed herein for the conversion of TDM to mixed TDM–WDM format is based on gating a linearly chirped pulse at the tributary channel rate with the high-speed OTDM (line rate) signal using a NOLM switch (Fig. 2). The linearly chirped pulses are stretched to a 100% duty cycle so that in the NOLM switch, each tributary channel gates the linearly chirped pulse at a different instant across the pulse and thus at a different frequency offset. Consequently, the tributary chan-nels are mapped onto different wavelengths. A fundamental requirement for suitable time-to-wavelength conversion is that there is a one-to-one relation between the temporal and spectral waveforms so that frequency filtering can remove one channel without perturbing the rest. However, in order to achieve this, the relation between the amount of chirp in the linearly chirped pulses and the pulsewidth of the OTDM data signal has to be carefully chosen. In Fig. 6, we present early experimental data taken on a switch similar to that shown in Fig. 2 that demonstrates this point.
We prepared ∼100-ps linearly chirped pulses at 10 GHz using the procedures described in Section III and coupled them to the signal port of the NOLM. At the control port of the NOLM, we coupled 10-GHz pulses, the full-width at half-maximum (FWHM) of which could be varied from 2 to 10 ps, and observed the switched output for different cases of pulse-width and control pulse-peak power.
The cases presented in Fig. 6(a) and (b) correspond to control pulsewidths of 2.5 and 9.5 ps, respectively, whereas in both cases, the maximum induced nonlinear phase shift was π.
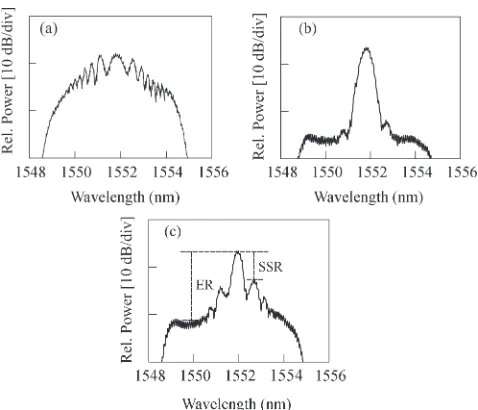
Fig. 6. Measured spectra of pulses obtained by gating linearly chirped pulses in a NOLM for various modulating pulsewidths and induced nonlinear phase shifts (ER, NOLM extinction ratio; SSR, sideband suppression ratio). (a)τ= 2.5ps, φ0∼=π. (b)τ= 9.5ps, φ0∼=π. (c)τ= 9.5ps, φ0∼= 2π.
The shape of the spectra of the two switched signals exhibit vastly different characteristics. In the instance that the shortest control pulses were used [Fig. 6(a)], a multilobed spectrum was obtained. By contrast, when broader control pulses were used for the same nonlinear phase shift [Fig. 6(b)], a cleanly carved switched spectrum, which consists of a well-defined channel band, was obtained with a peak-to-pedestal extinction ratio of
∼20 dB (which we associate with the finite switching extinction ratio of the NOLM). In Fig. 6(c), the pulses were the same as in Fig. 6(b), but the induced maximum phase shift was a factor of two higher in this instance. In this case, a multilobed spectrum was obtained again.
It is to be anticipated that the existence of spectral sidebands on the switched pulses would result in significant degradation in signal quality. For example, if the spectral sidebands extend into spectral regions, associated with neighboring channels, they would give rise to interchannel crosstalk and degrade the overall TADM performance. Additionally, further processing of the switched signal (e.g., using dispersive effects in optical fibers as required for packet compression) would lead to severe pulse shape distortion.
A. XPM in Linearly Chirped Pulses
In the analysis that follows, we derive an expression for the evolution of the spectrum of the linearly chirped pulses as they experience XPM during copropagation with a single short data pulse through a length of fiber. In essence, this analysis describes the nonlinear evolution of the linearly chirped pulses as they travel in a clockwise direction within the NOLM, as shown in Fig. 2. The analysis allows us to understand the origin of the sidebands, as observed in Fig. 6, without (initially) the added complication of the effects of the interferometer. It will be shown that when a linearly chirped pulse is switched by a much shorter Gaussian pulse, its power spectrum is modulated by two factors: one varying as a Gaussian and the other as a non-periodic modulation [see (18)]. The relative balance between these two effects ultimately determines the form of the resultant spectrum.
The electrical field of the XPM signal is given as
E(τ) =Ecp(τ)·exp (iφxpm(τ)) (1)
where Ecp(τ) is the flat-topped linearly chirped pulse and φxpm(τ)is the nonlinear phase shift induced by the switching pulse. Here, we have assumed the linearly chirped pulse to be well approximated by a super-Gaussian shape of the fourth order; however, it should be noted that the exact shape of the pulse envelope is not critical for the analysis as long as its width (τcp)is far longer than the width of the switching pulse (τ0), i.e.,τ0τcp. Thus
Ecp(τ) =
Pcpexp
−ln 2
2
2τ τcp
8
·exp(iCτ2) (2)
wherePcpis the peak power andCis the linear chirp rate. When the pulse is highly chirped so that|C|τcp2 1, there is an asymptotic solution for its complex spectrum, which is given as
Ecp(ω) =
πPcp
|C| exp
−ln 2
2 ω Cτcp 8 ·exp −i ω2
4C −sgn(C) π 4
. (3)
The derivation of (3) is given in the Appendix.
From (3), one can extract the magnitude and phase as
E cp(ω)
2
=πPcp
|C| exp
−ln 2 ω Cτcp 8 (4) and
ϕcp(ω) =− ω2
4C+ sgn(C) π
4 (5)
respectively. For the XPM form in (1), we considered the pulses in the line data stream to be Gaussian-like in shape, which is a reasonable assumption for the return-to-zero (RZ)
signal format. A mathematical description of the modulation is given as
φxpm(τ) =φ0·exp
−τ2
τ2 0
(6)
whereφ0is the maximum phase shift induced by the switching pulse in the nonlinear medium andτ0 is the half-width at1/e of the maximum intensity of the same pulse.
Equation (1) is similar in form to pulse SPM, for which the Fourier transform was derived using asymptotic analysis in [23]. In that case, an expression for the complex spectrum that was valid for large values of spectral broadening was obtained. However, the analysis followed in [23] assumed that the phase of the modulated field includes the SPM term only and therefore cannot be applied to our case, where the pulse undergoing phase modulation has a linear chirp. Consequently, in order to include the phase modulation induced by XPM on a chirped pulse, we derived the spectrum for the case of small phase modulation (φ01), in which case, (1) can be closely approximated by
E(τ)∼=Ecp(τ) +iEcp(τ)·φxpm(τ). (7)
We considered this assumption reasonable, as the experimental observation of the switched spectrum showed that spectral sidebands are still obtained for low values of nonlinear phase bias of the NOLM switch.
Now, the power spectrum of the electrical field is given as
S(ω) =
∞
−∞
E(τ)·exp(iωτ)dτ 2
. (8)
Substituting (7) into (8) yields
S(ω) =Ecp(ω) 2
+Expm(ω) 2
+ 2Ecp(ω)·Expm(ω)·cos (ϕcp(ω)−ϕxpm(ω)) (9)
where for simplicity of expression, we have defined
Expm(τ)iEcp(τ)·φxpm(τ) (10)
andEcpandExpmwere expressed in their phasor form, where ϕcpandϕxpmrepresents their respective phase.
Substituting (6) and (2) in (10) yields
Expm(τ) =i
Pcpφ0exp
−τ2
τ2 0
·exp(iCτ2). (11)
The waveform described in (11) has the form of a chirped Gaussian pulse with the same linear chirp rate as the probe-chirped pulse. The spectrum of (11) is analytically solved and given in [24] as
Expm(ω) =
Pcpπφ0τ0
4
1 +C2τ4 0
exp
−τ02
1 +iCτ2 0
ω2
4 (1 +C2τ4 0) ·exp iarctan
Cτ02+π 2
By expressing (12) in a phasor form, one can extract the magnitude and phase as
E xpm(ω)
2
= Pcpπφ
2 0τ02
1 +C2τ4 0
exp
− ω2
2∆ω2 xpm
(13)
and
ϕxpm(ω) =−
∆ωm2 4|C|∆ω2
xpm
ω2+arctan
Cτ02+π
2 (14)
respectively, where we have defined
∆ωxpm=
(1 +C2τ4 0) τ0
(15)
and
∆ωm=|C|τ0 (16)
which represents the modulated bandwidth.
Substituting (4), (5), (13), and (14) into (9), the power spectrum can be explicitly calculated as
S(ω) =πPcp
|C| exp
−ln 2
ω Cτcp
8
+ Pcpπφ
2 0τ02
1 +C2τ4 0
exp
− ω2
2∆ω2 xpm
+2πPcpφ0τ0
|C|1 +C2τ4 0
exp
− ω2
4∆ω2 xpm
·cos
1 4C
∆ωm2 ∆ω2
xpm −1
ω2+θ0
(17)
whereθ0is a constant phase term.
The last term in (17), which we label asSss(ω), indicates that the spectral sidebands are generated through XPM of the linearly chirped pulses by Gaussian pulses, and for simplicity of analysis, it can be rewritten as
Sss(ω)∝exp
−κ1
2 ω
2·cosκ2
2 ω
2+θ 0
(18)
where κ1 is the curvature of the Gaussian at the center fre-quency andκ2is the chirp rate of the cosine function.
This term indicates that the spectral envelope function is given by a chirp apodized by a Gaussian envelope, which describes well the spectrum observed in Fig. 6(a). Whereas the extent of the spectral sidebands depends onκ1, which relates to the bandwidth of the Gaussian envelope, the number of sidebands under this envelope depends on the ratio between κ1andκ2. Thus, ifκ2κ1, then a large number of lobes is produced as a wide Gaussian envelope apodizes a fast chirp. Ifκ2κ1 instead, then one main lobe with no sidebands is produced as the chirp is slow. For κ2=κ1, it follows from relating (18) to (17) thatCτ2
0 = 1. For a fixed chirp rate(C), (15) shows that the bandwidth affected by XPM is minimum atCτ2
[image:6.594.41.547.66.274.2]0 = 1. A physical interpretation is that if the bandwidth of the switching pulse (1/τ0) is larger than the modulated bandwidth(∆ωm=|C|τ0), a one-to-one relation between time and frequency is impossible, and spectral beats are generated
Fig. 7. Experimental setup for the characterization of XPM in linearly chirped pulses.
Fig. 8. XPM spectra of linearly chirped pulses after switching with 2 ps pulses and for various induced nonlinear phase shifts. (a) Measured power spectra. (b) Retrieved spectral envelopes.
because more than one frequency can occur at the same instant in time. At the opposite limit of a narrow switching pulse bandwidth compared to the modulated bandwidth (i.e., a broad switching pulse), the spectrum of the switched pulse is chirp dominated, and no spectral beating is generated.
In order to validate our theoretical derivation, we performed experimental measurements of the modulated spectrum using the setup shown in Fig. 7. The linearly chirped pulses, as shown in Fig. 5, were coupled together with 2-ps control pulses at a repetition rate of 10 GHz into an HNLF, resulting in a Cτ02 product of+0.03. An amplifier at the input of the control pulses allowed the XPM strength to be varied. At the output, the con-trol pulses were filtered out. Fig. 8(a) shows two resulting XPM spectra for low- and high-intensity control pulses. In order to compare these with our theoretical derivation, which gives the spectral envelope of a single pulse rather than the spectrum of a train of pulses, we needed to extract the corresponding spectral envelope from the measured spectrum. The Fourier transform of a train of pulses is the product of the spectral envelope with the spectral lines associated with the repetition rate of the pulses within the train. The separation of the spectrum into these two multiplicative terms (i.e., envelope and lines) was performed using cepstral analysis [25]. The retrieved experimental spectra, which use the cepstral algorithm, are shown in Fig. 8(b) for the two values of peak phase shift. These traces were then compared to the calculated spectra given by (17). Fig. 9 shows this comparison for the case of a maximum phase modulation of0.3π. For the theoretical model, we usedτ0equal to 1.2 ps (which corresponds to an FWHM of 2 ps); τcp was 100 ps, θ0 was −2.4 rad, and C was +0.02 ps−2. As can be seen, the theoretical model predicts the extension and position of the spectral sidebands with good accuracy. We attribute the experimental spectral asymmetry to the nonoptimized operation of the chirped-pulse generator.
B. NOLM Switching of Linearly Chirped Pulses
[image:6.594.62.289.328.456.2]Fig. 9. Comparison between a measured (solid line) and a calculated (dashed line) XPM spectral envelope.
interferometric effects of the NOLM switch. For simplicity, as before, we have considered only the XPM effect in the nonlinear fiber in the NOLM and neglected any dispersive effects. The electrical field of the switched signal at the NOLM transmission port is given as
E(τ) =αEcp(τ)·exp (iφxpm(τ))−(1−α)Ecp(τ) (19)
whereEcpandφxpmare described in (2) and (6), respectively, andαis the splitting ratio of the NOLM input coupler.
The performance of the NOLM was first modeled for various settings of the control pulsewidth. At first, we assumed a typical value for the NOLM extinction ratio of 25 dB, which is a real-istic working level allowing for practical limits in splitting ratio balance for the NOLM coupler, and for imperfections in the alignment of the polarizations of the two counterpropagating beams. This corresponds to a splitting ratio parameter(α)of 0.527 (i.e., ignoring any polarization-based effects). We fixed the maximum phase shift(φ0)atπ(which corresponds to max-imum switching efficiency) and the chirp rate parameter(C) at +0.04 ps−2, again relating to reasonably practical values. Fig. 10(a)–(c) shows the chirp, intensity profiles, and spectra of the switched pulses for various values of theCτ2
0 product and indicates that as the modulating pulsewidth(τ0)increases, the chirp evolves gradually from a strong nonmonotonic to a monotonic function. The simulation shown in Fig. 10(d) is for the same case as that in Fig. 10(c) but assumes an infinite NOLM extinction(α= 0.5). No significant degradation to the pulse frequency chirp is observed between the two cases, apart from the tails of the switched pulse, where the switched-pulse intensity is comparable to that of the residual intensity of the chirped pulses that have not been perfectly suppressed by the NOLM. The predictions from these calculations are in good agreement with the experimental performance characteristic shown in Fig. 6 and highlight the importance of a correct choice of chirp for a given data pulsewidth. Using the same model, we estimated the peak-to-sidelobe ratio [or sideband suppression ratio (SSR)] in the calculated switched-pulse spec-trum. Fig. 11(a) shows this ratio as a function of the maximum induced phase shift when the chirp-width product (Cτ2
0) is equal to 1. For larger values than0.8π, sidelobes appear over the 25-dB NOLM extinction ratio limit. The results presented in this figure can be compared to the experimental observations of Fig. 6(b) and (c), where a good agreement between experiment
Fig. 10. Numerical calculations of the NOLM switched pulse for different values ofCτ2
0andα. Left: frequency chirp (solid line) and intensity envelope (dashed line) forφ0=π. Right: corresponding spectral envelopes (right). (a) Cτ2
0 = 0.05, α= 0.527. (b) Cτ021= 1, α= 0.527. (c) Cτ 2 02= 1.6, α= 0.527. (d)Cτ2
[image:7.594.75.260.68.217.2]02= 1.6, α= 0.5.
Fig. 11. Spectral SSR as a function of (a) the nonlinear phase shift and (b) the chirp-width product. The NOLM extinction ratio (ER) is 25 dB. (a)Cτ2
0 = 1. (b)φ0=π.
and theory in terms of spectral shape is observed. In Fig. 11(b), we show the SSR estimation as a function of the modulating pulsewidth when the maximum phase shift isπ. A comparison of this figure with (17) shows that the strength of the sidebands follows the trend of the exponentially varying bandwidth of S(ω)and minimizes forCτ2
[image:7.594.308.556.533.631.2]and crosstalk suppression is dominated by the NOLM extinc-tion ratio. Unfortunately, (17), which was derived for small values ofφ0, cannot fully describe this trend. Instead, it is best to examine the behavior of the chirp profile of the switched pulses. The chirp function can be derived by first rewriting (19) in a single amplitude and phase form. It is only possible to obtain an analytical expression if we assume α= 0.5, for which the NOLM extinction is infinite. Under this assumption and using fundamental relations between circular functions, we have
E(τ)∝sin
φ0
2 exp
−τ2
τ2 0
·exp (iϕ(τ)) (20)
where the phase is given as
ϕ(τ) = π 2 +Cτ
2+φ0
2 exp
−τ2
τ2 0
. (21)
Equation (20) shows that all-optical gating using a NOLM switch alters the pulse shape. It strongly affects the top of the pulse if the maximum phase modulation is aboutπ. If the application involved requires pulse-shape preservation, then the switching efficiency has to be traded off by operating the NOLM within the linear range of the sine function, for example considering NOLM operation at a maximum phase shift of 0.7π (rad). The chirp function can then be derived by taking the time derivative of (21) and is given as
δω(τ) =−∂ϕ ∂τ =−
2C−φ0 τ2 0
exp
−τ2
τ2 0
·τ. (22)
A change in the sign of the chirp slope would give rise to tem-poral beating of certain frequency components and formation of ripples in the spectral domain. This can be avoided when the chirp is monotonous, i.e.,
∂δω
∂τ <0 ∀τ∈]− ∞,+∞[ (23)
for the case of a positive chirp rate C. Substituting (22) in (23) yields
Cτ02> φ0
2 . (24)
When the switching efficiency is maximum (φ0=π), (24) yields
Cτ02>π
2 ∼= 1.6 (25)
which is in agreement with the numerical result of Fig. 11(b). Note that the limited NOLM extinction ratio and the assumption ofα= 0.5that we have used in our analysis does not signifi-cantly affect the chirp of the switched pulses [as also shown in Fig. 10(c) and (d)], especially whenC >0.
Using Fig. 11(b) as a basis, it is now important to evaluate the total bandwidth required for producing switched pulses under a specified chirp-width product(Cτ2
0). From (2), one can easily calculate the bandwidth of the linearly chirped pulses as the first derivative of the phase, as true for chirp-dominated signals, such as these pulses. The width of these pulses is equal to the
period of the tributary signals1/Bbase, whereBbaserepresents the tributary bit rate. Hence, their bandwidth is
∆ωTotal=
2C Bbase
. (26)
This can be expressed as a function ofCτ2 0 as
∆ωTotal=
2Cτ2 0 τ2
0Bbase
(27)
which shows that for a given value of the Cτ2
0 product, the bandwidth requirements for the linearly chirped pulses are minimized when the pulsewidth of the aggregate data signal is maximum. For RZ signals, as required in ultrafast OTDM, the FWHM of the pulses should not exceed one-third of the duration of the bit slot, i.e., the maximum pulsewidth is
τ0=
1 3·1.665·Bline
(28)
where Blineis the line bit rate. Note that, as in Section IV-A, Gaussian pulses have been assumed and the factor 1.665 is used for the conversion from FWHM to the half-width at the 1/e point. Introducing (28) in (27) yields
∆ωTotal= 2Cτ02
(3·1.665·Bline)2 Bbase
(29)
or expressed in terms of wavelengths
∆λTotal= λ2 πcCτ
2 0
(3·1.665·Bline)2 Bbase
(30)
where c is the speed of light in a vacuum, and λ is the wavelength of operation. Forλ= 1550nm, this yields
∆λTotal∼= 0.065Cτ02 B2
line Bbase
. (31)
The wavelength bandwidth is given in nanometers when the bit rates are expressed in Gigabit per second. Consequently, the channel separation is given by the total bandwidth divided by the number of tributary channels Bline/Bbase, which is expressed as
∆λsep∼= 0.065Cτ02Bline. (32)
Fig. 12. Crosstalk level between adjacent channels as a function of the chirp-width product for a NOLM with 25-dB extinction ratio.
Fig. 13. (a) Minimum bandwidth requirement for the linearly chirped pulse for TDM–WDM conversion atCτ2
0 = 0.6 as a function of the aggregate OTDM bit rate. (b) Corresponding WDM channel separation.
can generally be tolerated by the OTDM signals. For example, the OTDM signal extinction ratio is limited by the extinction of the LiNbO3 data modulators, which typically ranges between 15 and 20 dB. Fig. 12 shows that this value can be achieved by operating at a chirp-width product of 0.6. This reduces the bandwidth requirement for operation at 160 Gb/s to 100 nm. At a tributary rate of 40 Gb/s, the required bandwidth would be just 25 nm. It is possible to shape the broad spectrum in Fig. 4 using, for example, a commercial dynamic gain equalizer to produce a rectangular chirped pulse with a 30-nm bandwidth. In [26], which uses this approach, equalized time-to-wavelength mapping onto a 22-nm bandwidth of 10 tributary channels of a 100-Gb/s OTDM signal is shown. Therefore, a practical implementation of this technique, at the line rate of 160 Gb/s operating on 40-Gb/s tributaries, should be possible. Fig. 13(a) shows the minimum bandwidth required for the TDM–WDM conversion as a function of the line bit rate forCτ2
0 = 0.6and for the cases of 10- and 40-Gb/s tributaries. The corresponding channel separation, as shown in Fig. 13(b), is independent of the repetition rate of the tributary signals (32).
V. TIME ANDWAVELENGTHADD–DROPPORT
Once the signal has been converted into a mixed TDM– WDM format, it can be processed either in the time or the wave-length domain. For example, we have previously shown that by making use of the chirped nature of the converted signal, a time lens can be implemented and used for packet compression or expansion [13]. As far as add–drop multiplexing is concerned, spectral processing is preferred because it allows the use of pas-sive spectral filters using mature technology originally
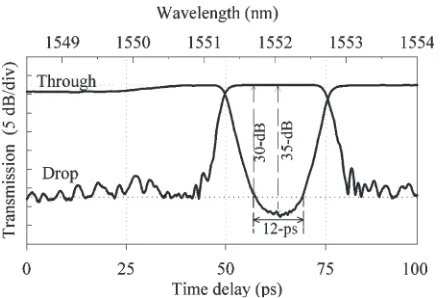
devel-Fig. 14. Experimental characterization of the add–drop port.
oped for WDM systems. Several devices for WDM add–drop multiplexing have been proposed and demonstrated using var-ious filtering technologies such as arrayed waveguide gratings, FBGs, Mach–Zehnder filters, and ring resonators. All can filter out an individual channel without affecting the other channels aggregated in the same optical fiber. One essential feature of an add–drop multiplexer is high dropped-channel suppression because the accumulation of crosstalk can lead to severe signal degradation. The application of FBGs for wavelength add–drop multiplexing has already been studied extensively (e.g., see [27]). FBG add–drop filters are now available with a spectral band reflectivity well over 99.9%, whereas significant design improvements have helped to overcome what were traditionally thought to be limitations in the performance of these devices, such as in-band dispersion [28]. Furthermore, recent research effort has moved toward the development of TFBG technology that is suitable for dynamic WDM networks [29].
As shown previously in Section III, the stretched temporal envelope of highly chirped pulses mirrors the spectral en-velope. Therefore, when an FBG carves the spectrum of a linearly chirped pulse, a temporal window of similar features is produced. The duration of the temporal window is defined by the pulse chirp rate. For our particular system, we have used pulses with a linear chirp rate of 6 nm over 100 ps and an FBG with characteristics as shown in Fig. 14. As the −3 dB bandwidth of the FBG is 1.5 nm, a switching window of 25 ps is produced. For reference, the spectral traces shown in the figure were taken with a resolution of 0.01 nm, which corresponds to a temporal resolution of 170 fs. These traces also show that the FBG had a maximum transmission loss at the bandgap center of 35 dB, which corresponds to a reflectivity of 99.97%. Overall, the channel suppression was better than 30 dB within a 12-ps window. An attractive feature of the add–drop FBG filters is the possibility to tailor the filter shape. As shown in the figure, the reflectivity of the FBG filter has a squarelike shape, which ensures that the channel is dropped without distortion while imposing high suppression on the adjacent channels. In order to be able to drop any of the tributary channels, the FBG was mounted on a compression stage so that it could be tuned to match any of the tributary channels.
VI. SYSTEMDEMONSTRATION
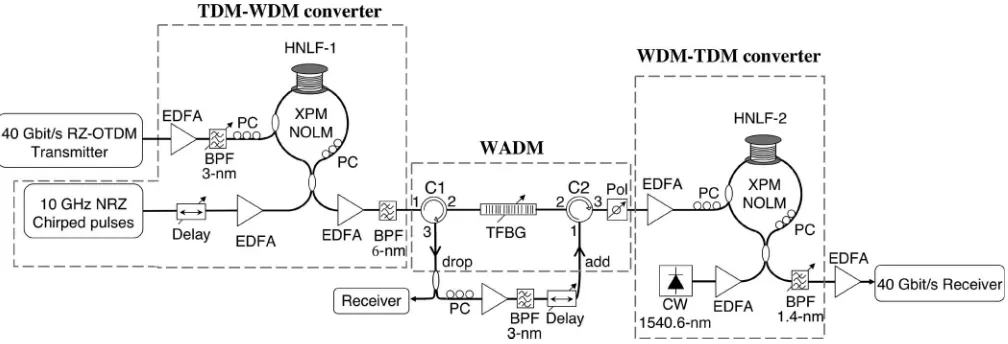
[image:9.594.322.542.67.216.2] [image:9.594.45.292.257.356.2]Fig. 15. Experimental setup for time-division add–drop multiplexing at 40 Gbit/s (HNLF, highly nonlinear fiber; TFBG, tunable FBG; EDFA, erbium-doped fiber amplifier; PC, polarization controller; BPF, bandpass filter).
Fig. 16. Spectra and eye diagrams at different stages of the OTDM add–drop multiplexer. Left: optical spectra (vertical scale: 5 dB/div, horizontal scale: 2 nm/div, span: 1537–1557 nm, RB: 0.01 nm). Right: eye diagrams (horizontal scale: 20 ps/div). (a) Back-to-back 40 Gb/s RZ-OTDM. (b) TDM-WDM. (c) Through-Channels. (d) Dropped-Channel. (e) 40 Gb/s TDM with added-channel.
Fig. 15. The 40-Gb/s RZ-OTDM transmitter consisted of a gain-switched diode laser that produces 9.5-ps pulses (τ0=
5.7ps)at 10 GHz and a central wavelength of 1546 nm. The pulses were externally modulated with a231−1pseudorandom binary sequence (PRBS) data sequence and then multiplexed to a line rate of 40 Gb/s. Fig. 16(a) shows the corresponding eye diagram. At the add–drop multiplexer input, the 40-Gb/s data were amplified to an average power of 20 dBm and launched
TABLE II
[image:10.594.302.549.295.481.2]NOLM SWITCHESFIBERS’ PARAMETERS
Fig. 17. Autocorrelation traces of the incoming 40-Gb/s OTDM signal and the converted mixed TDM–WDM signal.
into the control port of an HNLF optical loop mirror. Details of the HNLF used are given in Table II. The signal to the NOLM comprised the 100-ps linearly chirped super-Gaussian pulses at a 10-GHz repetition rate and a flat-top bandwidth of 6 nm(C= +0.024ps−2), as described previously. Under these conditions, the NOLM switch was operated at a chirp-width product(Cτ2
0)of 0.8. The chirped pulses were amplified to an average power of 15 dBm and launched into the signal port of the NOLM. After switching in the NOLM, these pulses were carved into a TDM–WDM replica of the original data, as shown in Fig. 16(b). The 3 dB bandwidth of each channel was 0.7 nm, and the spacing between them was 1.4 nm. By filtering out the original 40-Gb/s signal with a 6-nm bandpass filter, a suppression ratio of∼30 dB was achieved.
in Fig. 15. The drop port was then port 3 of C1, and the add port of a new 10-Gb/s channel was port 1 of C2. Fig. 16(c) and (d) shows the spectra and eye diagrams of the through and dropped channels, respectively. The spectrum of the through channels shows more than 30-dB suppression of the dropped channel, which confirms high-quality channel clearing. The dropped channel is depicted in Fig. 16(d), where one can see that the extinction ratio between this channel and the rest of the band was>25 dB.
In order to demonstrate the add function of the multiplexer, we then coupled a signal onto the remaining channels in the line, which were transmitted through the TFBG. As long as it was temporally synchronized with the rest of the data, this signal could be operating at any wavelength. In our case, and for practical reasons, we chose to reinject the same channel to the add port. This represents the worst case for coherent crosstalk between the residual channel energy transmitted through the FBG filter and the newly added channel. However, the high reflectivity of the FBG used (99.97%) reduces the crosstalk noise level to less than the typical laser or nonlinear switch noise. A tunable optical delay line was used on the add channel to ensure that these pulses were injected on the cleared timeslot. In our scheme, a further stage of nonlinear switching is required to convert the signal from mixed TDM–WDM back to TDM format (Fig. 3). The signal was first coupled to a fiber polarizer to equalize the states of polarization of all channels. The TDM–WDM signal with a new added channel was then amplified to an average power of 18 dBm and used as the NOLM control to switch a CW beam at 1540.6 nm. At the output of the NOLM, a 1.4-nm bandpass filter isolated the switched signal from the control, as shown in Fig. 16(e). Open eye diagrams were obtained, albeit with a slight increase in amplitude noise. We attribute this increase at the end of the system to a nonoptimum choice of the HNLF used in the last switching.
To assess the add–drop operation, we measured the bit error rates (BER) before and after the add–drop multiplexer using a 40-Gb/s receiver comprising a 40 : 10 Gb/s electroabsorption modulator-based demultiplexer. Fig. 18 shows the achieved BER performance in comparison with the 40-Gb/s back-to-back signal. Error-free operation was achieved within a 2-dB power penalty for all cases, and no degradation due to crosstalk was observed for the added channel. As for the dropped chan-nel, a BER improvement was observed, which is mainly due to the reduction of the significant intersymbol interference that existed on the original 40-Gb/s signal.
As discussed previously, a very attractive feature of the scheme proposed herein, as compared to time-domain tech-niques, is the potential for the simultaneous dropping of several tributary channels by simply cascading tunable FBG filters. For example, the dropping of two channels is possible using the arrangement of circulators and TFBGs shown in Fig. 19. The figure shows eye diagrams of the through channels after two tributary channels have been dropped off from the 40-Gb/s OTDM signal, confirming the practicality of the system.
VII. CONCLUSION
[image:11.594.329.535.69.211.2]In this paper, we have presented a technique for the process-ing of optical signals usprocess-ing time-to-wavelength conversion,
Fig. 18. Measured BER versus received optical power for the 40-Gb/s OTDM add–drop multiplexer.
Fig. 19. WADM scheme and eye diagrams (25 ps/div) for simultaneous add–drop multiplexing of two tributary channels.
both theoretically and experimentally. The technique relies on the generation of spectrally (and temporally) flat linearly chirped pulses and their nonlinear switching with short data pulses in a NOLM switch. This procedure generates a spectral representation of data packets, which can then be processed either temporally or spectrally.
Our theoretical analysis has investigated the conditions un-der which a one-to-one time-to-wavelength conversion can be achieved without greatly distorting the data signal. It has been shown that the two main parameters to consider are the chirp rate(C)of the linearly chirped pulses and the pulsewidth(τ0) of the data pulses. Switching without any distortion is achieved when the chirp of the switched pulses after the NOLM is monotonic, a condition which is satisfied when Cτ2
0 > π/2. However, because this condition requires impractically broad bandwidths for the linearly chirped pulses, a more practical compromise is to useCτ2
0 in the range of 0.6–1, which still ensures distortion-free conversion with a 20-dB-sideband sup-pression ratio.
We have applied this technique to the demonstration of a TADM operating at 40 Gb/s. In our experiments, we have used linearly chirped pulses with a chirp rate of+0.024ps−2and a data pulsewidth of 9.5 ps, corresponding to aCτ2
[image:11.594.335.524.246.402.2]We have also demonstrated that serial add–drop can be achieved by simply cascading more than one multiplexing FBG. This technique benefits from allowing the flexibility to use either time or frequency-based processing tools and can find a number of applications requiring the processing of time-domain signals on the bit level.
APPENDIX
COMPLEXSPECTRUM OF ALINEARLYCHIRPEDPULSE
In this section, we present the derivation of the Fourier transform of a linearly chirped super-Gaussian pulse given by (2). In the most general case, the spectrum of this pulse cannot be described in a closed mathematical form. However, an approximate solution can be found by using the method of stationary phase when the pulse is highly chirped so that one can safely assume that the phase is rapidly varying across the duration of the pulse. The condition for this is thatCτ2
cp1. For example, in our experiments, the linearly chirped pulses were 100-ps long (τcp) and had a chirp rate(C)of 0.02 ps−2, which gives aCτ2
cpof64π(rad).
We used the definition of Fourier transform, which is ex-pressed as
Ecp(ω) =
∞
−∞
Ecp(τ)·exp(iωτ)dτ. (33)
Substituting (2) in (33) yields
Ecp(ω) =
Pcp ∞ −∞ exp
−ln 2
2
2τ τcp
8
·expiCτ2+iωτdτ. (34)
Substituting the variableτbyT τcp, (34) can be written as
Ecp(ω) =
Pcpτcp
∞
−∞
exp
−ln 2
2 (2T)
8
·expiCτcp2T2+iωτcpT
dT. (35)
In (35), the phase goes to infinity in the asymptotic limit Cτ2
cp→ ∞. Consequently, the integrand oscillates rapidly and cancels over most of the range. Cancellation, however, does not occur in the neighborhood of a stationary point(Tsp), at which
∂ϕ(T, ω, C) ∂T
T=Tsp
= 0orTsp=− ω 2Cτcp
. (36)
Therefore, by using the method of stationary phase [30], (35) can be approximated as
Ecp(ω)
Pcpτcpexp
−ln 2
2 (2Tsp)
8
· ∞
−∞exp
iCτcp2Tsp2+iωτcpTsp+iCτcp2(T−Tsp)2
dT. (37)
Calculating (37) at the stationary point given in (36) yields
Ecp(ω)
Pcpτcpexp
−ln 2
2 ω Cτcp 8 ·exp
−iω 2 4C · ∞ −∞ exp
iCτcp2 (T −Tsp)2
dT. (38)
The integral in (38) is explicitly evaluable, and therefore, the complex spectrum of a highly linearly chirped super-Gaussian pulse can then be given as
Ecp(ω)
πPcp |C| exp
−ln 2
2 ω Cτcp 8 ·exp −i ω2
4C −sgn(C) π 4
. (39)
ACKNOWLEDGMENT
The authors would like to thank K. Mukasa of Furukawa Electric Company Inc. for providing HNLFs for the experiment.
REFERENCES
[1] J. Li, B.-E. Olsson, M. Karlsson, and P. Andrekson, “OTDM add–drop multiplexer based on XPM-induced wavelength shifting in highly nonlin-ear fiber,”J. Lightw. Technol., vol. 23, no. 9, pp. 2654–2661, Sep. 2005. [2] C. Schubert, C. Schmidt, S. Ferber, R. Ludwig, and H. Weber, “Error-free
all-optical add–drop multiplexing at 160 Gb/s,”Electron. Lett., vol. 39, no. 14, pp. 1074–1076, Jul. 2003.
[3] J. Turkiewicz, E. Tangdiongga, H. Rohde, W. Schairer, G. Lehmann, G. Khoe, and H. de Waardt, “Simultaneous high speed OTDM add–drop multiplexing using GT-UNI switch,” Electron. Lett., vol. 39, no. 10, pp. 795–796, May 2003.
[4] E. Tangdiongga, J. Turkiewicz, H. Rohde, W. Schairer, G. Lehmann, E. Sikora, Y. Zhou, A. Lord, D. Payne, G. Khoe, and H. de Waardt, “160 Gb/s OTDM add–drop networking using 275 km installed fibres,”
Electron. Lett., vol. 40, no. 9, pp. 552–554, Apr. 2004.
[5] A. Poustie and K. Blow, “Demonstration of an all-optical Fredkin gate,”
Opt. Commun., vol. 174, no. 1–4, pp. 317–320, Jan. 2000.
[6] J. H. Lee, T. Tanemura, Y. Takushima, and K. Kikuchi, “All-optical 80-Gb/s add–drop multiplexer using fiber-based nonlinear optical loop mirror,” IEEE Photon. Technol. Lett., vol. 17, no. 4, pp. 840–842, Apr. 2005.
[7] E. Verdurmen, Y. Zhao, E. Tangdiongga, J. Turkiewicz, G. Khoe, and H. De Waardt, “Error-free all-optical add–drop multiplexing using HNLF in a NOLM at 160 Gb/s,”Electron. Lett., vol. 41, no. 6, pp. 349–350, Mar. 2005.
[8] L. Rau, S. Rangarajan, W. Wang, and D. Blumenthal, “All-optical add–drop of an OTDM channel using an ultra-fast fiber based wavelength converter,” in Proc. Opt. Fiber Commun., 2002, vol. 1, pp. 259–261.
[9] A. Buxens, H. Poulsen, A. Clausen, and P. Jeppesen, “All-optical OTDM-to-WDM signal-format translation and OTDM add–drop functionality using bidirectional four wave mixing in semiconductor optical amplifier,”
Electron. Lett., vol. 36, no. 2, pp. 156–158, Jan. 2000.
[10] S. Fischer, M. Dulk, E. Gamper, W. Vogt, W. Hunziker, E. Gini, H. Melchior, A. Buxens, H. Poulsen, and A. Clausen, “All-optical re-generative OTDM add–drop multiplexing at 40 Gb/s using monolithic InP Mach–Zehnder interferometer,”IEEE Photon. Technol. Lett., vol. 12, no. 3, pp. 335–337, Mar. 2000.
[12] K. Jepsen, H. Poulsen, A. Clausen, A. Buxens, and K. Stubkjaer, “Inves-tigation of cascadability of add–drop multiplexers in OTDM systems,” in
Proc. Eur. Conf. Opt. Commun., 1998, vol. 1, pp. 619–620.
[13] P. Almeida, P. Petropoulos, B. Thomsen, M. Ibsen, and D. Richardson, “All-optical packet compression based on time to wavelength conversion,”
IEEE Photon. Technol. Lett., vol. 16, no. 7, pp. 1688–1690, Jul. 2004. [14] P. Almeida, J. Lee, M. Ibsen, P. Petropoulos, B. Thomsen, P. Teh,
F. Parmigiani, and D. Richardson, “All-optical TDM data demultiplexing based on a highly nonlinear fiber Kerr gate using a linearly chirped rec-tangular control,” inProc. Conf. Laser Electro-Optics/Quantum Electron. Laser Sci., 2003, pp. 1741–1742, Paper CThQ6.
[15] K. R. Tamura, H. Kubota, and M. Nakazawa, “Fundamental of stable con-tinuum generation at high repetition rates,”IEEE J. Quantum Electron., vol. 36, no. 7, pp. 773–779, Jul. 2000.
[16] M. Nakazawa, K. R. Tamura, H. Kubota, and E. Yoshida, “Coherence degradation in the process of supercontinuum generation in an optical fiber,”Opt. Fiber Technol., vol. 4, no. 2, pp. 215–223, Apr. 1998. [17] K. R. Tamura and M. Nakazawa, “54-fs, 10-GHz soliton generation from a
polarization-maintaining dispersion-flattened dispersion-decreasing fiber pulse compressor,”Opt. Lett., vol. 26, no. 11, pp. 762–764, Jun. 2001. [18] Y. Takushima, F. Futami, and K. Kikuchi, “Generation of over
140-nm-wide super-continuum from a normal dispersion fiber by using a mode-locked semiconductor laser source,”IEEE Photon. Technol. Lett., vol. 10, no. 11, pp. 1560–1562, Nov. 1998.
[19] J. Azaña, “Time-to-frequency conversion using a single time lens,”Opt. Commun., vol. 217, no. 1–6, pp. 205–209, Mar. 2003.
[20] Y. Ozeki, K. Taira, K. Aiso, Y. Takushima, and K. Kikuchi, “Highly flat super-continuum generation from 2 ps pulses using 1 km-long erbium-doped fibre amplifier,”Electron. Lett., vol. 38, no. 25, pp. 1642–1643, Dec. 2002.
[21] P. J. Almeida, P. Petropoulos, M. Ibsen, and D. J. Richardson, “Generation of ultra-flat SPM-broadened spectra in a highly nonlinear fiber using pulse pre-shaping in a fiber Bragg grating,” inProc. Opt. Fiber Commun., 2005, vol. 1, pp. 259–261.
[22] M. Sugiyama, M. Do, F. Futami, S. Watanabe, and H. Onaka, “A low drive voltage phase and intensity integrated modulator for optical frequency comb generation and short pulse generation,” inProc. Eur. Conf. Opt. Commun., 2004, vol. 2, pp. 198–199.
[23] R. Cubeddu, R. Polloni, C. A. Sacchi, and O. Svelto, “Self-phase modulation and “rocking” of molecules in trapped filaments of light with picosecond pulses,” Phys. Rev. A, Gen. Phys., vol. 2, no. 5, pp.1955–1963, Nov. 1970.
[24] G. P. Agrawal, Nonlinear Fiber Optics. San Diego, CA: Academic, 2001.
[25] A. V. Oppenheim and R. W. Schafer, “Homomorphic analysis of speech,”
IEEE Trans. Audio Electroacoust., vol. AU-16, no. 2, pp. 221–226, Jun. 1968.
[26] K. Uchiyama and T. Morioka, “All-optical time-division demultiplexing experiment with simultaneous output of all constituent channels from 100 Gb/s OTDM signal,”Electron. Lett., vol. 37, no. 10, pp. 642–643, May 2001.
[27] I. Riant, “Fiber Bragg gratings for optical telecommunications,”Comptes Rendus Physique, vol. 4, no. 1, pp. 41–49, Jan. 2003.
[28] R. Feced, M. Durkin, M. Ibsen, and M. Zervas, “An efficient inverse scattering algorithm for the design of nonuniform fiber Bragg gratings,”
IEEE J. Quantum Electron., vol. 35, no. 8, pp. 1105–1111, Aug. 1999. [29] M. Mokhtar, C. Goh, S. Butler, S. Set, K. Kikuchi, D. Richardson, and
M. Ibsen, “Fibre Bragg gratings compression-tuned over 110 nm,” Elec-tron. Lett., vol. 39, no. 6, pp. 509–511, Mar. 2003.
[30] F. W. J. Olver,Asymptotics and Special Functions. London, U.K.: Aca-demic, 1974.
Paulo J. Almeidawas born in Porto, Portugal. He received the B.Sc. degree in physics and applied mathematics from the University of Porto in 1997 and the M.Sc. degree in electrical and computer engineering from the Technical University of Lisbon, Lisbon, Portugal, in 2000. He is currently work-ing toward the Ph.D. degree in optoelectronics at the Optoelectronics Research Centre, University of Southampton, Southampton, U.K.
From 2000 to 2002, he was with the Instituto de Telecomunicações, Aveiro, Portugal, where he worked on modeling high-speed optical communication systems. His current research interests are optical signal processing for high-speed optical time-division multiplexing/wavelength-time-division multiplexing networks.
Periklis Petropoulos, photograph and biography not available at the time of publication.
Francesca Parmigianiwas born in Milan, Italy. She received the M.Sc. degree in electronic engineering from the Politecnico di Milano, Milan, in 2002. She is currently working toward the Ph.D. degree in optical communication systems at the Optoelec-tronics Research Centre, University of Southampton, Southampton, U.K.
Her previous research interest is superluminal light propagation effect in fiber Bragg gratings. Her current research interests include optical sampling technique, pulse shaping, and nonlinear processing to perform all-optical regeneration.
Ms. Parmigiani is a member of the Optical Society of America.
Morten Ibsen, photograph and biography not available at the time of publication.