Neonatal Mortality in Developing Countries: What can we learn from DHS data?
72
0
0
Full text
(2) Neonatal Mortality in Developing Countries: What can we learn from DHS data?. Sarah Hall. Division of Social Statistics School of Social Sciences University of Southampton. January 2005. Abstract This study explores the potential contribution of DHS data in improving knowledge of trends in neonatal mortality in developing countries. It outlines the causes and possible consequences of sampling and non-sampling error in survey data of this nature, before using DHS and World Fertility Survey estimates to describe apparent trends in neonatal mortality over the last few decades. It also examines the association between neonatal mortality and per capita gross domestic product (GDP) at national level. The study draws out how both patterns of progress and relationship with GDP differ markedly in the neonatal period than in post-neonatal infancy and early childhood.. The discussion. summarises the potential limitations in using DHS estimates for NMR, as well as outlining potential factors underlying the relatively poor progress being made in reducing neonatal deaths..
(3) 1.0 Introduction. While the last few decades have seen a significant decrease in child mortality within developing countries, the decline in neonatal mortality (NMR)1 has been less marked. Previous analysis has demonstrated that in many countries neonatal mortality has fallen more slowly than post-neonatal infant mortality (PMR)2 or early childhood mortality (ECM). Although this general pattern is relatively well documented (e.g. Hill and Pande 1997, p.7), further cross-national analysis is needed in order to develop a clearer picture of how mortality rates and progress vary both between countries and regions, and over time. Previous studies tend to have drawn on data from a relatively small number of countries, or have taken a regional perspective3. In addition, there is little understanding of how recent trends in neonatal mortality have changed in the light of stagnation and reversal of gains in child health, particularly in Sub-Saharan Africa. The degree to which variation between countries in NMR can be attributed to differences in socio-economic factors is also unknown: for instance while it is well documented that national levels of child mortality are strongly correlated to Gross Domestic Product per capita income (e.g. Pritchett and Summers, 1996, p, 844) there has been no previous study to establish whether this relationship is the same in the neonatal period.. The proliferation of. Demographic and Household Surveys (DHS) throughout the 1990s, as well as the availability of earlier comparable surveys offers opportunities to carry out cross national. 1. The neonatal mortality rate (NMR) is the number of deaths occurring in live-born infants before the 28th day of life per 1000 live births. The terms “neonate” and “newborn” are often used interchangeably. 2 Post neonatal mortality rate (PNMR) is the number of deaths of children between 28 days and one year per thousand live births. DHS calculates this by subtracting NMR from the Infant mortality rate. Infant mortality rate (IMR) is the number of deaths in children before the age of one year per thousand live births. Early Childhood mortality rate (ECMR) is the number of deaths in children over 12 months of age but less than five years of age per 1000 children reaching 12 months. 3. Since work on this paper began Hill and Choi (2004) have produced an excellent unpublished paper which touches on some of these issues. Much of the paper is focused on providing in-depth analysis on the quality of data for early and late neonatal deaths and focuses on non-sampling error and in particular the issue of age heaping. This paper draws heavily on this analysis where relevant, but also looks at a broader range of both sampling and non-sampling issues. The Hill and Choi paper provides trend data for a total of 32 countries, but differs from this paper in that it does not discuss in depth by country / region or compare progress in NMR with PNMR or ECMR. It also does not divide progress into medium and short term (though, unlike this paper, it does analyse early and late neonatal mortality separately).. .. 2.
(4) analysis of trends on a larger number of countries in neonatal health to address these issues.. Section two of this paper will initially outline why a specific focus on neonatal mortality is needed by reviewing existing literature on the global scale of the problem, the specific causes of death and existing evidence for poor progress in this age group. Section three then presents work on measurement issues. As DHS surveys are prone to a number of sampling and non-sampling errors careful consideration needs to be given to potential data limitations when interpreting results. This study presents analysis on the quality and reliability of DHS NMR estimates through both collating work by other authors and introduces results from a number of internal consistency checks. Section four examines trends and patterns demonstrated by DHS neonatal mortality estimates in developing countries. It documents the proportion of child deaths occurring in the neonatal period for each country before focusing on answering three questions: •. Based on available DHS data, what progress do countries appear to be making in reducing their neonatal mortality rates, and how does this vary both between countries and regions?. •. How do estimated rates of progress in reducing neonatal mortality differ from those in the post-neonatal and early childhood periods?. •. To what extent do DHS estimates indicate that the poor progress in reducing child mortality experienced in many countries within recent years (particularly within Sub-Saharan Africa) has also affected neonatal mortality?. Section five examines the association between NMR and per capita Gross Domestic Product (GDP) and analyzes how this relationship differs from PNMR and ECMR. While a comprehensive analysis of the relationship between socio-economic variables known to affect child mortality and national NMR cannot be accomplished within the remit of this. .. 3.
(5) paper4, this initial analysis makes an important contribution to the literature as no previous work has examined this, and it will hopefully indicate areas where further research would be useful.. The paper finishes by discussing the reliability and value of DHS estimates, and how they may be improved. It will also discuss the observed patterns of progress and suggest possible causes for the differential rates of change between regions and age groups, as well as the policy implications that arise from this.. 2.0 Why focus on Neonatal mortality?. 2.1 The scale of the problem Each year there are nearly five million neonatal deaths, 98% of which occur in developing countries (Hyder et al. 2003, p.894). Neonatal deaths now contribute to about 40% of all mortality in children under the age of five globally, and as much as two thirds of infant mortality (Save the Children 2001, p.6, Hyder et. al. 2003, p.894). While rates are highest in Sub-Saharan Africa, the absolute burden of mortality is greatest in Asia, where 60% of neonatal deaths occur globally (Darmstadt et. al. 2003, p.224). India alone experiences 1.2 million deaths in this age group each year (nearly a quarter of all neonatal deaths, Hyder et. al 2003, p.898), and a further 500,000 occur in China (Save the Children 2001, table 1). An estimated 800.000 newborns die annually in Sub-Saharan Africa, with probably the greatest absolute burden of mortality focused in Nigeria, Ethiopia, Mozambique, the Sudan and Tanzania (Hyder et. al 2003, p.898). There is growing understanding within the international community that increased efforts are needed to reduce neonatal mortality if further progress is to made in reducing child mortality. In most countries the Millennium Development Goal to reduce child mortality by three-quarters by 2015 will not be achieved unless significant progress is made in reducing deaths within the first month of life.. 4. It is fully recognised that GDP per capita does not indicate the full range of socio-economic variables that impact on child mortality. However, as an indicator it is likely to have strong associations with other variables such as education and public sector spending.. .. 4.
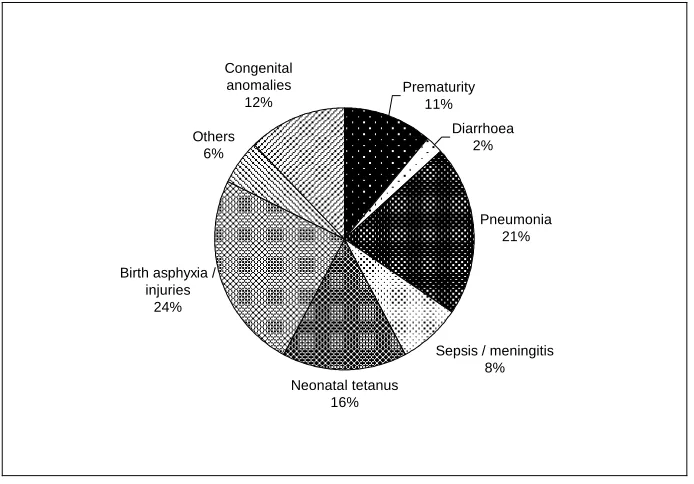
(6) While the burden of mortality from neonatal deaths is very striking, this is in many ways only part of the problem as the conditions that contribute to mortality also cause severe and lifelong disability. For example, it is estimated that over one million children who survive birth asphyxia each year develop problems such as cerebral palsy, learning difficulties and other disabilities (JHPIEGO, undated). Low birth weight and pre-term infants are more vulnerable to illness in later childhood (e.g. Verhoeff et.al. 2004), and often experience impaired cognitive development affecting their long term opportunities and life-chances (Grantham MacGregor and Lira 1998). There is also growing evidence that poor foetal growth during pregnancy has an impact on the development of chronic disease such as diabetes, high blood pressure and cardiovascular disease (Godfrey and Barker 2000). As these are essentially diseases which affect older people, they are becoming increasing concern as developing and transition nations face the challenge of growing ageing populations.. 2.2 Causes and response. The main causes of death in the neonatal period differ markedly from those in post-natal infancy and childhood. In developing countries the majority of deaths in these older age groups are as a result of infectious diseases such as acute respiratory infections, diarrhoea, measles and malaria. These conditions can normally be prevented or treated through a number of cost-effective interventions delivered through the primary health care system. However estimates for the causes of neonatal mortality5 suggest that these diseases are responsible for a much smaller share of mortality (with acute respiratory infections and pneumonia as a possible exception, see Fig. 1). Deaths from diarrheoa are much less common than for children under five generally, and measles and malaria are extremely rare within this age group. The interventions designed to prevent and treat these conditions will therefore have little impact on deaths within the first month of life.. 5. Data are scarce on the cause on neonatal deaths due to the fact that most occur within the home without contact with health services. Estimates are often based on verbal autopsy, which is a method of ascertaining cause of death based on a standardised interview with next of kin or other care-givers.. .. 5.
(7) The main causes of neonatal mortality are intrinsically linked to the health of the mother and the care she receives during pregnancy and delivery, and therefore the key mechanism for delivering effective interventions is through maternal health services. In total, it has been estimated that nearly three-quarters of all neonatal deaths could be prevented if women were adequately nourished and received appropriate care during pregnancy, delivery and the post-natal period (Tinker 1997, p. 15). About a quarter of all neonatal deaths are caused by asphyxia and birth injuries which normally result from poorly managed labour and lack of access to emergency obstetric services.. Many. neonatal infections such as tetanus and congenital syphilis can be prevented by care during pregnancy and delivery. Low birth weight (below 2.5 kg), which is strongly associated with maternal health and wellbeing is a significant contributing factor in many neonatal deaths (e.g. UN ACC Sub-Committee on Nutrition 2000, p.6).. Maternal. nutrition is another important factor in improving newborn survival: inadequate calorie intake results in poorer pregnancy outcomes, and supplementation to the mother with a number of micronutrients to the mother (e.g. iron, iodine, and possibly Vitamin A) has been associated with increased neonatal survival (e.g. Caulfield 1999).. In addition to the provision and utlilisation of preventive and curative health services, child mortality is influenced by a number of indirect or underlying socioeconomic factors. An association between GDP per capita and child mortality at national level is clearly established (e.g. Pritchett and Summers 1996, p. 841), as well as between with income-related variables at the household level (e.g. father’s occupation, Hobcraft et. al 1984, p.220). The importance of maternal education as a determinant of child survival is also well documented (e.g. ibid. p.197). While data are currently fairly limited, several studies indicate that mother’s education, as well as several other household level socioeconomic variables (e.g. place of urban / rural residence, father’s occupation) have a greater effect on early childhood mortality than during post-neonatal infancy or the neonatal period (e.g. Kost and Amin 1992, Bicego and Ahmad 1996, p.50, Mahy 2003, p. 27-28).. No national comparative studies have been carried out which examine the. relationship between different age groups and GDP per capita, but some evidence on the differential impact of class and income can be drawn from the historical data. Table 1. .. 6.
(8) shows NMR and IMR data gathered in 1911 and 1932 in England and Wales.. It. demonstrates that while a class gradient did exist in neonatal mortality, it was considerably less steep than for infant mortality, suggesting much of the variation occurs in the post-neonatal period.. This paper has already outlined the integral link between maternal health and neonatal survival, but child health is also affected by a broader range of bio-demographic factors. These factors also appear to be age dependent, but conversely the impact seems to be greatest in the neonatal period. Mother’s age and birth order both appear to have a greater influence in the first month of life (Bicego and Ahmad, 1996 p.49, Mahy 2003, p. 12-13)6. Unequivocal evidence exists on the association between shorter birth intervals (less than two years) and increased child mortality, and the effect of this also appears to be strongest in the neonatal period (e.g. Mahy 2003, p.15). However, the relationship between fertility rate and mortality is somewhat difficult to interpret. While it could be hypothesized that reduced fertility would lower neonatal mortality rates, this does not appear to be the case in practice. Andhra Pradesh can be used as an example, whereby the total fertility rate has declined significantly since the mid 1980s along with IMR, but neonatal mortality has remained almost stagnant (James 2000, p.7). There are two probable causes for this lack of association: firstly, in many countries increased use of contraception has resulted in reducing the number of overall births, rather than increasing birth intervals or increasing the age of mothers’ first pregnancy. Both of the latter factors are thought to have much greater impacts on neonatal survival than late birth order (ibid, p6). Secondly, reducing the overall number of births will increase the proportion of first births, thus replacing one risk factor with another (ibid p.7).. 2.3 Lack of progress in reducing neonatal mortality. Hill and Pande (1997) carried out a study of 12 developing countries in Sub-Saharan Africa, Asia, North Africa and Latin America using World Fertility Survey (WFS) and 6. A “U” or “J” shaped relationship exists between birth order and neonatal mortality, with lower chances of survival at both extremes (James et. al., 2000, p.9). First births carry an average 33% excess risk of death in the neonatal period, but no excess risk in the post-neonatal period (Bicego and Ahmad, 1996, p.49).. .. 7.
(9) DHS data from the mid 1970s to early 1990s. They found that the neonatal mortality rate fell at a slower rate than IMR or under five mortality rate (U5MR), resulting in the proportion of deaths occurring in the neonatal period being inversely proportional to the infant and under five mortality rate (ibid., p 7). These findings have been confirmed by a number of other studies (e.g. Curtis 1995, p.43, Black et. al. 2003) and also mirrors the pattern demonstrated historically in many developed countries. In the US, for instance, the proportion of infant deaths occurring in the neonatal period increased as mortality rates fell between 1915 and 1970 (Hill and Pande, 1997). Studies from developed countries suggest that this trend continues until the IMR is around 20, when NMR is about three quarters of IMR. This pattern has resulted in marked differences in the proportion of child deaths occurring in the neonatal period between countries and regions in the developed and developing world. In Western Europe, neonatal mortality rates are very low (usually around 3-5 deaths per thousand live births, Save the Children 2001, Table 1), but contribute to around three quarters of all deaths in children under five years. In contrast, many countries in Sub-Saharan Africa with extremely high under five mortality rates have estimated neonatal rates of over 40 deaths per thousand live births (e.g. Mozambique, Chad, Malawi, Save the Children 2001, Table 1) but they may make up less than one quarter of all child deaths.. Study of historical data also suggests that neonatal mortality in many developed countries did not begin to fall substantially until some years after a decline in post-neonatal and childhood mortality had been achieved. When decline did occur, it was initially in the late rather than early neonatal period.7. For instance in Sweden, Austria, Hungary, and. Belgium, a marked reduction in post-neonatal mortality could be detected from the beginning of the 20th century (Masuy-Stroobant 1997 pp 14-17). However, neonatal deaths in all four countries did not begin to decline significantly until around 1925. Early neonatal deaths did not decline until even later: around the time of the second world war in Sweden, Austria and Belgium and the mid 1970s in Hungary (ibid). In the UK infant and child mortality was also declining steadily from the turn of the century. A slow and not particularly consistent decline in late neonatal deaths can be detected from around the 7. .. The early neonatal period is from birth until 6 days. The late neonatal period is from 7-27 days.. 8.
(10) time of the First World War but progress was limited, particularly when compared with post-neonatal mortality (see Fig.2). Average % annual rate of decline for overall NMR was around 1.3% in from 1911-1920, 1.2% from 1921-1930 and fell still further to around 0.6% in the 1930s8. Progress did not accelerate until the 1940s (when early neonatal mortality also began to reduce), when the average % rate of decline rose to about 3.6% per annum (Macfarlane 2000, dataset 2.3.1).. 3.0 The measurement of neonatal mortality in developing countries. The accurate measurement of neonatal mortality in developing countries presents a number of challenges, and limited data has probably contributed to the lack of focus given to this area in the past (Lawn et. al. 2001, p. 1.10) . In most developing countries vital registration is incomplete or non-existent, and since many neonatal deaths occur within the home without any contact with medical services they are not recorded by health information systems.. Even where institutional delivery is common, varying. policies for classification of neonatal deaths and stillbirths can result in measurement discrepancies (Aleshina and Redmond 2003, pp.7-9). There is also some evidence that within certain health systems there are incentives for staff to misreport neonatal deaths as stillbirths in order to avoid audit or improve hospital ratings when neonatal deaths rates are used as an indicator of quality (ibid. 2003, p.13).. The only feasible method of collecting reliable national-level direct estimates on neonatal death rates in many developing countries is through large surveys such as the DHS. These are nationally representative surveys with sample sizes of about 5,000 households providing data on a wide range of indicators in the areas of population, health, and nutrition. Full birth histories are collected from women aged between 15-49 years in sampled households, and data are comparable both over time and between countries. The women are asked a series of questions about each birth they have experienced, including. 8. The exception to this poor progress in the 1930s was among illegitimate births, where NMR fell precipitously from about 58 to 41 per 1000 live births between 1932 and 1938 (Winter 1979, p. 444).. .. 9.
(11) month and year of the infant’s birth, and, if no longer living, age at death (in days if under a month old).. As registration data is not available for most countries, the empirical analysis in this paper uses data from DHS and World Fertility studies. All DHS data is taken from the online Statcompiler9 facility provided by Macro International.. The estimates used are. based on deaths recorded in the five years preceding the survey date based on maternal recall, but in some cases data from earlier recall periods (5-10 years and 10–15 years) are also used to cross-check apparent trends.. Data from the World Fertility Surveys were. taken from the WFS Comparative Study of Infant and Child Mortality (Rutstein 1983).. A total of 57 countries are included in the study. Of these, 30 are in Sub-Saharan Africa, and the remaining countries are in North Africa and Western Asia (six countries), Central Asia (four countries), South and South East Asia (eight countries) and Latin American and the Caribbean (nine countries). For analysis requiring only one estimate per country, data are taken from the most recent available surveys, which were carried out between 1990 and 2002. Of the group, one country (Gabon) is classified by the World Bank as Upper Middle Income, 17 are classified as Lower Middle income, and the remaining 39 are Low Income countries10.. DHS estimates for rates of neonatal mortality for all. countries range from 14 per 1000 (Colombia) to 68 per 1000 (Cote d’Ivoire). The highest estimated rates are found in Sub-Saharan Africa (mean rate 39.6 per 1000) and lowest in Latin America and the Caribbean (mean rate 21.3 per 1000). Annex 1 contains a table of data showing DHS estimates for NMR, PNMR and ECMR for all countries and regions.. The work on trends uses a smaller sub-sample of 34 countries where more than one survey has been carried out.. For 17 of these countries only recent short term data are. available (defined as data collected from 1988 onwards covering periods of 4-12 years). For 16 countries both recent short and medium term data are also analysed (using estimates from the World Fertility Surveys collected between 1975-82 as the baseline,. 9. http://www.measuredhs.com/statcompiler Based on World Bank Classifications: http://www.worldbank.org/data/countryclass/countryclass.html. 10. .. 10.
(12) and data from DHS III and Plus gathered between 1997-2002 for follow-up and covering periods of 18-24 years). Medium term data only are available for one country (Mauritania). More details will be given on specific methodologies used when describing the results.. While regional averages have been used here it must be recognised that data from DHS surveys cannot be considered representative of a region. DHS surveys are normally only carried out in countries where vital registration and other health service data are incomplete or unreliable, so tend to focus on countries where relatively limited progress has been made in establishing effective health systems. The regional averages are not weighted by population.. 3.1 Non-Sampling Error. 3.11 Omission of deaths Even a relatively large scale survey of this type may experience a number of potential problems that compromise the accuracy of the data collected. Probably the greatest risk from non-sampling errors is omission of child deaths, which is a problem thought to be most prevalent in the neonatal period (Curtis 1995, p. 43). Although mothers are asked to recall all infants born alive who later died,11 neonatal deaths may be misclassified as stillbirths, either in genuine error or because of cultural beliefs and practices. The problem is compounded by very limited DHS data on stillbirths, so it is not possible to jointly review trends in the two rates in order to provide a more comprehensive picture. There is some evidence from earlier WFS data that these omitted deaths are concentrated amongst the most socially and economically disadvantaged (Hobcraft et. al. 1984, p 206), which may result in the introduction of important biases.. 11. The interviewers also use a probe which asks whether the mother had “any baby who cried or showed signs of life but did not survive”, DHS 2003),. .. 11.
(13) While it is difficult to estimate the degree of underreporting, a study in the Indian state of Maharashtra (Bang 2002, p. 4953) found an NMR 20 points higher (51.2 deaths per 1000 as opposed to 32 deaths per 1000) than that recorded in the 1998 Indian National Family and Household Survey for this state (NFHS, a DHS equivalent). However Bang et. al. acknowledge that at least some of this difference may be explained by selection bias in the study population, which contained a much higher proportion of tribal people than the NFHS survey (p.4952). In addition Hill and Choi (2004, p15) suggest that further error could have been introduced by paying informants to report deaths. They also point out that the ratios of neonatal to infant deaths are similar in both the study and NFHS data. While this in no way demonstrates that the NFHS did not underreport neonatal deaths, it does indicate that NMR is not differentially underreported when compared to postneonatal mortality.. 3.12 Sampling Bias Sampling bias will be an issue if certain sectors of the population are underrepresented in the survey.. A potential cause of bias is that DHS methodology uses women of. reproductive age as the basic sampling unit, so children without living mothers are excluded from the survey. Studies in resource-poor countries suggest that death of the mother commonly results in death of the child, and this risk is particularly strong for the newborn. A study of maternal mortality in the Jamalpur district of Bangladesh found that of the 21 babies live-born to women who subsequently died, all were dead by 28 days (Khan et. al. 1986). Another larger study also in Bangladesh (Matlab district) showed less dramatic results, but still found that only 65% of infants born alive to mothers who died survived until one month, compared with 94.4% who survived in the control group of infants with living mothers (Koenig et. al. 1988)12. This may lead to an underreporting of newborn deaths, particularly in countries where maternal mortality is high. A recent study by Artzrouni and Zaba (2003, cited in Mahy (a) 2003, p.5) which examined the bias. 12. The differences in these studies may at least be partly due to variation in overall NMR between the two study areas.. .. 12.
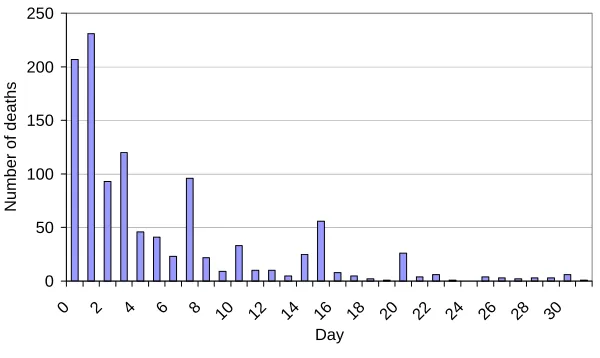
(14) produced by AIDS when using direct estimation techniques for child mortality suggests that while there is likelihood of underreporting, it is only at most of a magnitude of 5-7%. However, further work would be useful to ascertain if there is any specific bias in NMR data caused by maternal death, or whether estimates in countries that have extremely high all-cause maternal mortality may be more severely affected.. 3.13 Data heaping A further potential problem is that of data “heaping,” i.e. the preference for reporting deaths at a particular day, week or month. Hill and Choi (2004, p.5) carried out some analysis to establish the degree to which heaping occurs at seven days, and found that in 40% of the surveys one half or more of all deaths occurring between four and nine days were reported at seven days. This is important as it means that a number of deaths occurring in the early neonatal period will actually be recorded as late neonatal deaths. What is less clear is whether significant heaping at the age of 30 days or one month results in neonatal deaths being misreported as post-neonatal infant deaths. Annex 2 shows a series of bar graphs of neonatal deaths by region distributed by day of death. Heaping on a number of days (particularly day seven) can be clearly seen. There appears to be a very small amount of heaping at 30 days in all regions (and also at 28 and 31 days in some regions) which might lead to slight underestimations of NMR, but for most regions this would be negligible.. Unfortunately it is more difficult to ascertain whether some late neonatal deaths are being misreported at one month of age as after 31 days the age of death is recorded by month only. If large numbers of neonatal deaths were displaced into the one month age group it would be expected that this would affect the pattern of mortality for 1-12 months, but this is difficult to verify.. While a model has been established of expected distribution of. mortality by month (Bourgeois-Pichat 1952, cited in Galley and Woods, 1999 p.35), more recent work has found the pattern to vary considerably between time and place, and there is no single fixed relationship (Galley and Woods 1999, p.57). It is therefore not possible to compare DHS infant mortality data distributed by month of death with a model to ascertain with any certainty whether deaths at one month appear over-. .. 13.
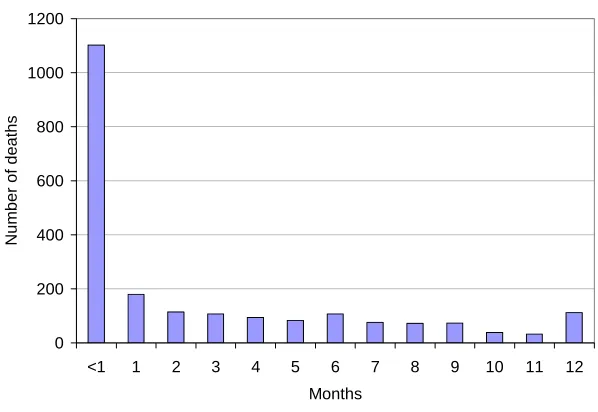
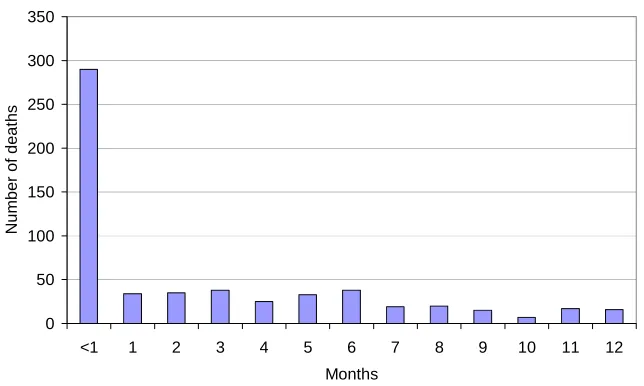
(15) represented. Annex 3 shows infant mortality bar graphs for the five regions by month of death. In all regions the numbers of deaths recorded at one month are only a fraction of those recorded for less than one month: the percentage ranges from 9% in Sub-Saharan Africa to 17% in Latin America and the Caribbean. Even if it were assumed that the number of deaths at one month should be equal to the average number of deaths in months two and three (which may well be an underestimation as infant mortality usually decreases with increasing age) the reassignment of estimated excess deaths would only lead to an increase in deaths before one month of less than 7% for North Africa and Central Asia, Latin America and the Caribbean and South and South East Asia. In SubSaharan Africa and Central Asia the number of deaths recorded at one month is actually lower than the two subsequent months.. However, as risk of child mortality falls with increasing age, it could be assumed that the average daily number of deaths recorded by surveys for infants of one and two months would be less (or at least the same as) the average daily number of deaths in the later part of the neonatal period. Fig. 3 shows the average daily number of deaths for each regions reported from 21-27 days (the last week of the neonatal period), compared with average daily figures for one and two months (calculated on a 30 day month). As can be seen all regions have lower number of daily average deaths recorded in the surveys in the last week of the neonatal period. However, the calculation for average number of deaths for thelast part of the first month is severely affected by the choice of period used, and in particular a number of regions experience heaping at 20 days. The second column shows a daily average calculated from 20-31 days which will include these heaped deaths at 20 days (as well as more modest heaping at 28 and 30 days). Even using this estimate South and South East Asia and the Latin America and the Caribbean still have a higher recorded number of average daily deaths at one month (though this study does not test to see if these differences are statistically significant), suggesting that some deaths that should have been recorded as occurring before one month may have been displaced. It is impossible to draw any firm conclusions from this very cursory analysis, but as the probable actual daily number of deaths recorded that occurred in the later part of the first month of life probably lies somewhere between these two estimates displacement may be. .. 14.
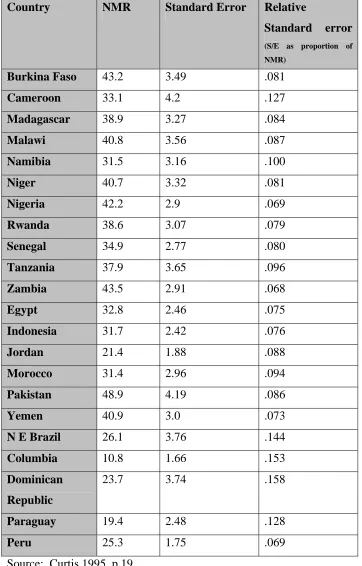
(16) a problem in some surveys, causing NMR to be underreported. Further, more detailed analysis would be worthwhile in order to develop stronger evidence on this issue.. 3.2 Sampling Errors Sampling error is also a problem leading to confidence intervals that are often quite wide. Standard errors are usually relatively higher than those for infant or child mortality (Curtis 1995, p.18), and in surveys with low neonatal mortality rates and relatively small sample sizes the standard errors can be very high.. Table 2 shows the NMR and. estimations of standard error for 17 DHS II Surveys (Curtis 1995 p.19). The relative standard errors are particularly large for some of the countries in Latin America, where NMR and numbers of births recorded by the survey are relatively low. For example, the 95% confidence intervals for Trinidad and Tobago (estimated NMR 22.9 per 1000 live births) range from 14.8–31.1 and for the Dominican Republic (estimated NMR 23.7 per 1000 live births) from 16.3-31.2. In some cases, the relative standard errors for neonatal mortality are more than twice that found for Under 5 mortality rate: For Burkina Faso and Zambia the relative standard errors for under five mortality rates are 0.033 and 0.036, whereas for NMR they are 0.081 and 0.068 respectively (Curtis 1995 pp17-19). This raises real issues about the accuracy of estimating rates of change or comparisons between countries from DHS data, and relatively small observed changes over time could actually be the result of sampling error rather than real progress.. In addition sampling error makes comparisons of NMR. between sub-samples extremely difficult as standard errors will be further increased within the sub-groups and only very large differences will be statistically significant.. 3.3 Internal consistency of DHS data 3.31 Correlation between proportion of child deaths occurring in the neonatal period and overall under five mortality While many of these problems are difficult to detect, one way of evaluating major inaccuracies is to examine whether the data conforms to previously established patterns. As mentioned earlier, it would be expected that a negative correlation would be found between the proportion of child deaths occurring in the neonatal period and the overall. .. 15.
(17) under five mortality rate. OLS regression is carried out to test this. Dummy variables were also added to the OLS regressions to investigate the effect of different regions on proportion of deaths in the neonatal period.. The scattergram in Fig. 4 shows the relationship between the percentage of child deaths occurring within the neonatal period and overall child mortality rates. It broadly concurs with previous well-documented evidence that the proportion of under five mortality caused by neonatal deaths increases as under five mortality decreases (e.g. Hill et. al. 1997). A few countries (e.g. Eritrea) appear to have a lower proportion than may be expected which may indicate underreporting of neonatal deaths. An OLS regression using percentage of under five deaths occurring in the neonatal period and dummy variables for region as the dependent variables and under five mortality rate as the independent variable produces the following results:. (Constant) Under 5 mortality rate North Africa / Western Asia Central Asia Latin America / Caribbean Sub-Saharan Africa. Unstandardized Coefficients. Significance. B 49.8 -0.11 2.08 0.01. Std. Error 2.41 0.019 2.76 2.89. <0.001 <0.001 0.45 0.99. -2.8. 2.61. 0.45. -6.25. 2.43. 0.01. 57 observations. Adjusted r2 = 0.71. Reference category is South and South East Asia.. This implies that Sub-Saharan Africa has a percentage of deaths in the neonatal period approximately six percentage points lower than South and South East Asia (the reference category) when adjusted for under five mortality rate (though the confidence interval is quite wide). This is demonstrated in Fig. 4 through separate regression lines of fitted values for Sub Saharan Africa and other regions. Other regions do not vary significantly from the reference category.. .. 16.
(18) While there is a correlation between the proportion of infant deaths occurring in the neonatal period and overall IMR, the predictive power of the model is much weaker (r2 =.36), and produces the equation:. % infant deaths occurring in neonatal period = 63.4 (constant) - 0.18 (IMR) (SE 2.58, p<.001). (SE=.03, p<.001). The addition of dummy variables for regions does not make a difference in this case. However there is a strong correlation between actual infant and neonatal mortality rates (r =0.89) and this association increases further if the natural log of both IMR and NMR is used (r = 0.92, see Fig. 5).. An OLS regression using log of NMR as the dependent variable and log of IMR and dummy variables for region as the independent variables produce the following results:. (Constant) Log of IMR North Africa / Western Asia Central Asia Latin America / Caribbean Sub-Saharan Africa. Unstandardized Coefficients. Significance. B 0.41 0.75 -0.04 0.09 -0.14 -0.08. 0.1 <.001 0.62 0.2 0.04 0.2. Std. Error 0.24 0.06 0.07 0.07 0.06 0.07. 57 observations. Adjusted r2 = .87. Reference category is South and South East Asia.. This implies that for every 10% decrease in IMR, NMR will on average decrease by about 7.5%. Latin America and the Caribbean differ significantly from the reference category (South and South East Asia). The high r2 suggest that this may be a reasonably accurate yet simple model for estimating neonatal mortality rates where data is not available, though the confidence interval for the constant is quite wide. Further analysis of this could be useful.. .. 17.
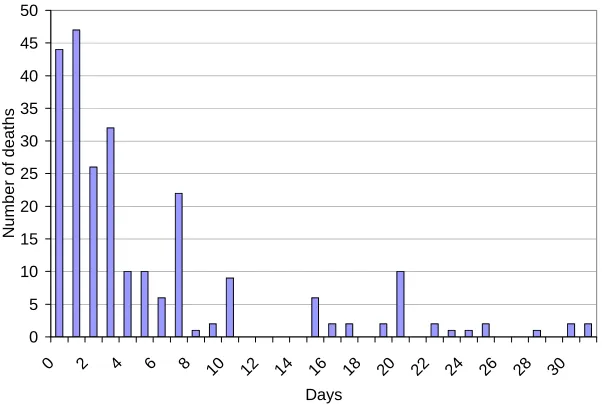
(19) 3.32 Proportion of early to late neonatal deaths Boerma (1988, cited in Curtis 1995, p.49) suggested that at an NMR of 20 per thousand or more, approximately 70% of neonatal deaths occur in the first six days, and an unexpected low proportion of early neonatal deaths could be a result of under-reporting deaths in this age-group.. Fig. 6 is a scattergram of neonatal mortality rate plotted against early neonatal mortality for 46 countries with NMR estimates of 20 or more. The scattergram shows a negative correlation (r =-0.31) between overall neonatal mortality and proportion of deaths occurring in the early neonatal period. This would be expected as deaths in the later neonatal period tend to decline earlier than those in the first week of life (Curtis 1995, p.49). The mean proportion of deaths occurring in the first week in the 46 countries with and NMR of 20 or above was 71.1, which would fit with Boerma’s analysis. However, this masks significant variation between countries, and the range for percentage of neonatal deaths occurring in the early period ranged from 53.3% – 88.2%. Niger, Chad, Zambia and Morocco (NER, TCD, ZMB, MAR) appear to have levels of early neonatal deaths lower than may be expected. However, a closer examination of the mortality data by day of death suggests it is likely to be as a result of age heaping as described by Hill and Choi (2004, p 6). All four countries show marked heaping at day seven, which will result in a higher proportion of deaths recorded in the late neonatal period. This pattern is particularly striking in Zambia, as illustrated in Fig. 7.. A number of other countries such as Gabon, Ghana, Togo, Kazakhstan and Turkey (GAB, GHA, TOG, KAZ, TUR) have higher rates of early neonatal deaths than might be expected. This could be a real reflection of local epidemiological conditions or result from poor differentiation between early and late neonatal deaths. Alternatively it could indicate either a tendency for stillbirths to be reported as neonatal deaths (resulting in an overestimation of neonatal deaths) or late neonatal deaths being misclassified as postneonatal deaths (resulting in an underestimation of neonatal deaths).. However the. percentage in the majority of countries falls between about 60-80%, suggesting there is no evidence of widespread underreporting of early neonatal deaths.. .. 18.
(20) These findings are generally supported by Hill and Choi (2004) who plotted the ratio of early to late NMR in 108 DHS against IMR and compared them with a reference line developed using data from England and Wales 1905 – 199713. They found that data points for Asia, North Africa and Latin America and the Caribbean were broadly scattered around the historic reference line. In Sub-Saharan African countries there was a higher rate of early than late neonatal deaths than within the model, and there was no apparent relationship with IMR changes. Hill and Choi (ibid. p.11) concluded from this that there is no evidence for substantial omission of early neonatal deaths, but the lack of pattern in some parts of Sub-Saharan Africa may be explained by a high degree of random error in the reporting of age of death in days.. 3.33 Comparison of recall data from 5-9 years with 0-4 year recall from earlier surveys in corresponding time period Opportunities for external validation of the DHS data are extremely limited as few other comparable national direct estimates of neonatal mortality exist.. However, as each. survey records data on deaths up to 25 years before the date of the survey divided into five-year time periods, data can be compared from different surveys covering the same time period.. Table 3 shows 5-9 year recall data from the most recent surveys (1990-2002) from 18 countries, along with 0-4 year recall data from preceding surveys undertaken exactly five years previously, and therefore covering a corresponding period. The difference between the two rates is also given.. The relatively large standard errors in NMR make. comparisons somewhat difficult: Based on the standard errors given for DHS surveys in Table 2, % differences between the two groups of figures of up to about 40% could be expected as a result of sampling error for countries outside Latin America and the Caribbean, and up to 60% for Latin American and Caribbean Countries.14 Assuming the. 13. It is worth noting that Hill and Choi smoothed their data to account for the high levels of heaping at seven days before carrying out their analysis. 14 Nearly all countries outside Latin America and the Caribbean (LAC) have relative standard errors between .069 and .10 (although one outlier, Cameroon has a considerably higher relative standard error of .127). Assuming that standard errors for DHS III and DHS plus are similar, this would suggest that CIs for. .. 19.
(21) standard errors are similar for DHS data series across time, sampling error could probably not be ruled out as an explanation of differences in any of the countries. However, particular observed patterns suggest that this is not the full explanation for some of the larger differences. Where % differences are considerable, the rates recorded in the 5-9 year recall period are for most countries higher than those from the 0-4 year period of the earlier study: only one of the eight countries with a % difference in rates over 15% has a larger estimate from 0-4 year than 5-9 year recall data. The opposite may have been expected, as it has been suggested that event omission is more common when the deaths occurred further back in time, which would lead to lower estimates for the 5-9 year recall period (Curtis 1995). A probable explanation for the observed pattern of higher estimates for 5-9 year recall is the phenomenon of displacing births in time in order for interviewers to avoid asking the extensive series of questions required for children born within five years of the survey. Arnold and Blanc (1990, p.10) found strong evidence of this occurrence in Sub-Saharan Africa, which could lead to underestimation of mortality rates. There is an indication that a number of other countries (e.g. Mali, Cameroon, Tanzania, Niger, and Malawi) may also have higher estimates or NMR for 4-9 year recall than for similar periods covered by 0-4 year recall, although estimates cannot be directly compared as the surveys are not exactly five years apart (e.g. Fig. 8 shows the difference in trends based on 0-4, 5-9 and 10-14 year recall data in Mali). This is very concerning as it suggests that rates of neonatal mortality in these countries may be even higher than current estimates. It also raises doubts about the reliability of using recall data from different periods to establish trends when more than one survey is not available.. 4.0 Trends in DHS NMR estimates. most countries would lie between + /- 13.3% and 19.4% of the estimated rate (calculated by multiplying standard errors as percentage of estimate X 1.94). Relative SEs for LAC lie between .069 and .158, producing confidence intervals of +/- 13.3% - 29.8%. However, it should be remembered that when comparing two consecutive estimates you would need to have a difference of 2 X CI to be absolutely certain that a change is not the result of sampling error (i.e. +/- 26.6% - 38.8% for countries outside LAC and 26.6% - 59.6% for countries within LAC). In the absence of more recent data it would appear to be reasonable to assume the relative SEs have not changed greatly between surveys, as while in some countries the NMR rate may have reduced (which may increase the relative SE), most later survey have used larger sample sizes.. .. 20.
(22) 4.1 The contribution of neonatal mortality to overall deaths in children under five years of age. A graph showing mortality rates by region for NMR, PNMR, ECMR, IMR and U5MR can be seen in Fig. 9. To determine the proportion of child deaths occurring in the neonatal period data, NMR as a percentage of U5MR was calculated for 57 countries. The percentages for each country can be found in the table in Annex 1. Sub-Saharan Africa has a far higher rate of child mortality, but the proportion (approximately 27%) occurring in the neonatal period is much less than in other regions. The other regions all have fairly similar proportions of child deaths occurring in the neonatal period (ranging from 40-46%). Sub-Saharan Africa also has the lowest percentage of infant deaths occurring in the neonatal period (46.5%), whereas North Africa and Western Asia and South and South East Asia have the highest percentage (56%).. 4.2 Trends in neonatal mortality over time. In order to examine trends in neonatal mortality, data were analyzed for neonatal, postneonatal and early childhood mortality for 30 countries where more than one survey was available. Medium term data uses World Fertility Surveys collected between 1975 and 82 as the baseline, and data gathered between 1997 and 2002 for follow up. The data covers periods ranging from 18 – 24 years. Short term, recent trend data is taken from DHS surveys from 1988 onwards, and covered periods of 4-12 years. This time period was chosen in order offer some insights into patterns of change since the mid 1980s, when reduction in child mortality began to slow in some countries.. Average annual percentage rates of change were calculated to enable cross national comparison for the trend data using the formula: r1-r2 x 100% r1 x t Where r1 = mortality rate for the year of the survey used as the baseline r2 is the rate in the year of the final survey. .. 21.
(23) t = number of years between the first and second survey. This formula does not allow for compounding. It is a measure of relative change, so therefore countries with already low mortality can exhibit impressive rates of percentage reduction with relatively small absolute reduction in the mortality rate, whereas for countries with high rates of mortality the converse is true: high rates of percentage reduction can only be achieved through significant reductions in overall rate. However, use of percentage changes may obscure patterns in the absolute rate of change, so average rates of absolute change are also given for comparative purposes. Where data were available for years between the baseline and final years, this was not included in the calculation of rate, but this more detailed trend data was used for individual country examples and graphs.. Wide confidence intervals will make any analysis of trend difficult and findings must be interpreted with caution. Any annual rate of change calculated on a difference of more than 40% between the two survey estimates is marked with an asterisk, as this is unlikely to be purely the result of sampling error (though particularly in the Latin America and the Caribbean this possibility cannot be ruled out, and the actual estimate of % change will be subject to potential variation due to sampling error15). An annual change based on a difference of less than 20% between survey estimates has been placed in italics within the tables to indicate that calculated annual rates of change are based on a relatively small overall change (see footnote 14 for more details). As it would be expected that any downward trend would be accompanied by an increase in the proportion of neonatal deaths occurring in the first day (as these deaths are the most difficult to prevent), further analysis was carried out on changes in proportion over time for the short term data as a way of triangulating changes in rate (information is not available on the proportion of deaths occurring in the first day from WFS data, so the exercise could not be carried out for medium term trends).. 15. It is also important to note that no published standard errors exist for NMR estimates from WFS data, which could differ for those calculated for DHS.. .. 22.
(24) Table 4 presents both the estimated annual % rate of change and the annual actual rate of change for these countries over the medium term for the neonatal, post-neonatal and early childhood periods. Table 5 the same information for the short term data.. 4.21 Sub-Saharan Africa Sub-Saharan Africa appears to have been the poorest performing region over the medium term period, both in terms of percentage annual reduction and actual annual reduction. While all countries except Cote D’Ivoire have shown some reduction in neonatal mortality, progress in all age groups has mostly been very limited, and the average annual percentage rate of change based on the available data for countries in this region has been only -0.8% per annum (or an annual change in NMR of -0.3 neonatal deaths per thousand live births each year). The only two countries that appear to have made significant progress in reducing PNMR and ECMR over the medium term (Mauritania and Senegal) have made much less progress in reducing neonatal deaths.. While the recent short term data should be interpreted with particular caution because many of the changes could be the result of sampling error, it suggests an even bleaker picture of stagnation or even reversal of gains in Sub-Saharan Africa. Only one country (Ghana) has shown a marked decrease in NMR. Overall the NMR has actually increased for this region by an average of 1.1% per annum. Two countries in particular (Cote D’Ivoire and Uganda) have demonstrated marked increases in NMR estimates.16. Fig.. 10 shows the trend over estimated NMR for seven countries where several consecutive surveys are available, and a number of these countries appear to be demonstrating marked stagnation and reversal from the early 1990s. Progress within the other age groups is also extremely poor, and marked increases can be noted in ECMR for several countries.. 4.22 Trends in North Africa and Western Asia. 16. This could reflect data anomalies, either resulting from an underestimation of deaths in the earlier survey, or an overestimation in the later survey. An examination of recall data for both countries 5- 10 years before the final survey suggests that underestimation of the rate in the earlier period is not the reason for the apparent increase in deaths in Cote D’Ivoire, but may possibly contribute towards it in Uganda.. .. 23.
(25) Countries within North Africa and Western Asia region by contrast appear to have made sustained progress across all three age groups over the medium term (though progress in Jordan would seem to be poorer than others within the group). Turkey, Egypt and the Yemen all had extremely high levels of neonatal mortality in the mid 1970s (58-63 deaths per 1000 live births), and have significantly reduced their estimated rates to between 24 and 34 deaths per 1000 live births in recent years.. With the possible exception of. Jordan, countries within the North Africa and Western Asia region appear to have continued to make sustained progress across all three age groups in the recent short term (though data needs to be interpreted with caution), and the regional average % rate of progress is similar for the two periods.. 4.23 Trends in countries in Latin America / Caribbean Available medium term data for the two countries within the Latin America / Caribbean region show a very similar pattern to those in North Africa. However, estimates for recent short term progress within South America shows a very mixed picture: The Dominican Republic has produced one of the greatest % rates of change of all countries within this study, whereas Haiti has demonstrated no change. Colombia appears to have experienced a sharp rise in neonatal and under five mortality from 1990 – 2000. However examination of recall data suggests that the 1990 DHS may have produced an underestimation of the death rate which produces a false impression of an increase (although this would still indicate there has been no improvement in neonatal mortality in the last 10 years).. 4.24 South and South East Asia The figures available for countries in South and South East Asia also indicate progress over both the short and medium term in all age groups (with the exception of the Philippines which shows no short term reduction in neonatal or post-neonatal mortality rates).. A number of countries (e.g. Bangladesh, Indonesia and Nepal) suggest that. reduction in NMR is greater over the recent short term than over the medium, and this positive trend is reflected in the regional average (-1.92% average % reduction per annum over the medium term, compared with -2.95% over the recent short term). Though these. .. 24.
(26) data should once again be interpreted with caution, they are supported by patterns observed when examining the 5-9 and 10-14 year recall figures from the most recently available survey.. India shows less short term progress than other countries within the. sub-continent, and this relatively poor progress is supported by available government figures (Natarajan 2003, p. 13). This is particularly concerning because of the large proportion of deaths globally that occur within this country.. 4.25 Trends in Central Asia There is only trend data available for one country in Central Asia: Kazakhstan. The data only covers a period of four years (1995-1999) and shows a huge increase in deaths in all age groups, but greatest in the neonatal period. Such a huge increase may well raise questions about data quality, although examination of recall data would indicate underestimation of baseline NMR is not the cause.. 4.3 Changes in percentage of neonatal deaths occurring on the first day of life. As neonatal deaths in the first day are the most difficult to reduce, reduction in neonatal mortality would normally be accompanied by an increase in the % of neonatal deaths that occur in the first 24 hours of life. Analysis of changes in the % of deaths occurring in the first day (in this study defined as those reported on day 0 or 1) may provide important information to support or raise queries on the accuracy of trends in rate, although these data will also be prone to similar sampling and non-sampling errors as NMR estimates. Table 6 shows the % of neonatal deaths occurring on day one for both the baseline data and the follow-up data for the recent short term. It also provides the difference in these two figures.. For all countries outside Sub-Saharan Africa where a decrease in neonatal mortality is suggested by short term trend data there is also an increase in the % of deaths occurring in the first day as would be expected (though in some instances these are small).. .. 25.
(27) However, Kazakhstan, which shows an apparent sharp increase in neonatal mortality also shows an increase in deaths in the first day of life, which suggest that there may be some data anomalies. A possible reason for this could be changing definitions of neonatal deaths and stillbirths, which may also explain the marked increase noted in NMR between the two surveys (although the fact that other age-groups have also experienced a rise may reflect a real trend of increasing mortality). Countries within Sub-Saharan Africa show a very complex and confused picture: percentages of deaths in the first day of life appears to have remained static for some countries (e.g. Senegal, Uganda, Benin and Niger) which would be consistent with a lack of progress. However, a number of other countries where progress has either been non- existent or reversed have experienced an apparent increase in the proportion of deaths occurring in the first day (e.g. Mali, Tanzania and Rwanda). In particular short term trend data from Rwanda suggests an actual increase in neonatal mortality rate, but over the same period the proportion of deaths within the first day seem to have increased markedly. Data for Zimbabwe and Cote d’Ivoire, which both showed increasing neonatal mortality rates, show respectively a decrease and stagnation in the proportion of deaths in the first day.. 4.4 How does rate of progress for NMR compare with that of PNMR and ECMR?. Over the medium term for all regions, the average % rate of change (and average actual rate of change) is lower for NMR than either PNMR or ECMR (see Table 4). The total average % annual change for all countries where there is medium term DHS data is -1.3% compared to 3% for both PNMR and ECMR. This difference is not unexpected, as there has long been concern that NMR is reducing at a slower rate than other age groups. However, what is quite remarkable is how uniform this pattern is: indeed, outside SubSaharan Africa there are no countries where average annual rate of progress is greater or the same in the neonatal period as in early childhood, and only Indonesia demonstrates a marginally greater rate of progress in neonatal mortality than post-neonatal infancy. The data for recent short term trends is fairly similar. However, in North Africa and Western Asia two countries (Turkey and Jordan) have demonstrated increases in ECMR, which. .. 26.
(28) has led to a regional % average rate of change that is greater in the neonatal period than in early childhood. While short term data within South and South East Asia shows encouraging signs of accelerating progress in NMR, the difference in progress appears to have increased between NMR and ECMR with an average annual rate of change for NMR being -2.95%, and for ECMR -6.52% (compared with -1.92% and -3.24% for medium term data). The regional average for Latin America and the Caribbean also has very marked differences in the recent short term between progress in NMR and ECMR. Most countries outside Sub – Saharan Africa appear to be following a pattern similar to that illustrated by the graph showing trends in Egypt (Fig. 11), whereby neonatal mortality follows the overall sustained downward trend in child mortality, but at a lower rate than that seen in older age groups. Sub-Saharan Africa shows a much more confused picture, and it is difficult to generalize about differential rates of progress between age groups.. 5.0 The relationship between Neonatal mortality and GDP. The scattergram in Fig. 12 shows a curvilinear relationship between NMR and GDP per capita17. However, it is interesting to note the wide variations in NMR for countries with similar levels of GDP, particularly amongst the poorer countries. For instance, Guinea (GIN) and Nicaragua (NIC) have relatively similar levels of GDP per capita but estimates for NMRs are 48.4 and 17.1 per 1000 live births respectively. Even within regions marked differences can be seen between countries with similar GDPs, such as Eritrea and Ethiopia. A series of OLS regressions on the most recent data from 56 countries where GDP per capita income is available using the natural log of GDP per capita for as the independent variable and the natural log of NMR, PNMR, ECMR, IMR and U5MR as dependent variables produces the following results: 17. Estimates for GDP per capita based on World Bank figures (taken from the World Bank Development Indicators CD Rom) for purchasing power parity (PPP) per capita for the mid year of the 5 year period covered by the survey.. .. 27.
(29) Natural log GDP per capita. Nat. log. NMR 5.95 (-0.37) -0.34 (0.05). Dependent variable Nat. log. Nat. log. Nat. log. PNMR IMR ECMR 7.85 7.60 10.84 (0.51) (0.40) (0.88) -0.60 0.46 -1.00 (0.07) (0.05) (0.12). Nat. log. U5MR 9.20 (0.49) -.62 (0.07). r2. 0.47. 0.57. 0.58. 0.56. 0.62. Significance Number of observations. <0.001 56. <0.001 56. <0.001 56. <0.001 56. <0.001 56. Constant. As can be seen, the r2 suggest that the degree of variation which can be attributed to GDP per capita income is slightly greater for PNMR and ECMR than NMR. However, there is a very marked difference in the Beta coefficients. A 10% increase in GDP per capita is associated with a 3.4% decrease in NMR, a 6% decrease in PNMR and a 10% decrease in ECMR. This is illustrated in Fig. 13 by separate regression lines for each age group. Testing shows that the difference between the coefficients of the log of GDP per capita for NMR and PNMR, and PNMR and ECMR are statistically significant at the 5% level. The results also demonstrate how focus on the relationship between GDP and IMR or U5MR mask differences in the component rates.. Generally the r2 for under five. mortality is lower than for other similar analyses (i.e. Filmer and Pritchett, 1997, who found an r2 of .84), and this is probably because the sample in this study does not contain any high income / low mortality countries which would strongly effect the strength of association.. 6.0 Discussion and Policy Implications. 6.1 How reliable are DHS estimates for neonatal mortality?. Accuracy of estimated neonatal mortality rates from the DHS, particularly in the absence of other national level surveys to provide external validation, are difficult to determine. Probably one of the greatest limitations for DHS data is the wide confidence intervals.. .. 28.
(30) This makes it impossible to use DHS data to detect relatively small changes over time, but also makes any estimation of rate of change or comparison between countries difficult to interpret.. As a result DHS data on neonatal mortality are probably most. useful for identifying general trends rather than providing accurate information on specific countries. The only way to reduce this problem would be to massively increase sample size, which is unlikely to be either financially viable or practical. However, it would be useful if Macro International, the organizers of DHS surveys routinely calculated and published confidence intervals for all estimates in order to make people aware of the problem, and assist interpretation. No standard errors for neonatal mortality have been published since the early 1990s and calculation for all estimates would be a very valuable exercise. Analysis of change in the proportion of deaths occurring at one day produced ambiguous results, and proved of little value in triangulating results. This may because the changes in rate were too small to be reflected in corresponding changes in proportion, or reflect data inaccuracies. More analysis should be carried out in this area before it is used as a tool for verifying change.. In general, internal validity checks suggest that data for most countries falls within expected patterns. Probably the two most concerning issues identified are possible backdating of deaths which lead to underestimation of deaths, and age heaping, both at seven days (which is only an issue if disaggregating early and late neonatal deaths) and possibly at one month (though further analysis of this potential problem is required).. Both of. these problems could be at least partially reduced by improved training and supervision of survey staff. In recent years interviewers have been trained to probe for the child’s exact age of death if the death occurs at one year to avoid heaping at this age (Mahy 2003, p.2) with deaths reported at seven days or one month. Any analysis involving the disaggregation of early and late NMR may need to consider first using the smoothing techniques described by Hill and Choi (2004) to avoid the problems of heaping at seven days.. The only certain way of ensuring accurate data is the development of effective and comprehensive vital registration systems, which should be seen as a priority. However,. .. 29.
(31) this is unlikely to be achieved in the near future by many countries, which may need to rely on process indicators for monitoring short-term changes brought about through national programmes. A number of indicators have been identified, including ante-natal attendance, skilled attendance, tetanus toxoid vaccination, post-natal care and breast feeding rates. While all these interventions or packages of intervention have strong evidence of impact on neonatal mortality, further research is needed to quantify the level of potential impact of some of these in practice, and how this will vary in different settings and scenarios.. One major limitation of DHS data is the shortage of information on stillbirths. The classification of whether the event is a neonatal death or stillbirth is based on the skill and perception of those present at the birth, and as previously discussed these events may be misreported in the wrong category for a variety of reasons. Changes in health care practices and policies may lead to misleading apparent trends if the two categories are not viewed together:. for example, changes in resuscitation policy may lead to infants. previously being described as stillbirths being reclassified as neonatal deaths. There are a number of similar underlying causes for early neonatal deaths, stillbirths and late foetal deaths so data on all three would be valuable when evaluating health care services. Stillbirth data has been collected from approximately 20 countries since the early 1990s, but trend data is currently only available for about twelve.. One reason why so little. attention has been paid to collecting data on stillbirths and foetal loss is that it has generally been believed that mothers are unable to provide reliable histories of these events. The quality of DHS stillbirth data seems to support these concerns: Mahy (2003, p. 7) argues that it is likely to be flawed as there is no consistent ratio between stillbirths and early neonatal deaths as would be expected. However, several studies (e.g. Stanton 2002, Fikree 1996) suggest that while recall of early pregnancy loss may be problematic, information on late foetal loss and stillbirths can be reliably obtained. More research is needed into quality of data in this area, and how this information can best be collected.. 6.2 What progress is being made in reducing neonatal mortality?. .. 30.
(32) Across all regions, neonatal mortality is declining at a slower rate than deaths in other age groups. This follows similar patterns to those experienced in developed countries. Central Asia, North Africa and Latin America all have low rates of deaths occurring in the early childhood period, and this is particularly marked in Central Asia. As would be expected, this pattern seems to be more marked in countries that have experienced success in reducing overall child mortality. It is likely that further progress in reducing child mortality will rely on gains in the neonatal and post-neonatal period. Relatively little attention has been paid to how these countries with somewhat more developed health systems can effectively address the needs of the neonate or infant, and this is an important future area of policy development.. In most Sub-Saharan African countries. there is still major scope for reducing the high number of early childhood deaths. However, even within this region up to 42% of all childhood deaths occur in the neonatal period (e.g. Mauritania) suggesting in many countries that action to reduce deaths in the first month of life is vital to ensure rapid and sustained progress in reducing child mortality. The low proportion of NMR in relation to overall child mortality identified in Sub – Saharan Africa is likely to be a result of an unusually high proportion of early childhood mortality in this region: a phenomenon described elsewhere (e.g. Bicego and Ahmad 1996, p.9).. Outside Sub-Saharan Africa, there is little evidence of widescale stagnation in neonatal mortality. However, there appears to be is considerable heterogeneity of progress both within and between regions. While there is a strong correlation between NMR and national per capita GDP, there are examples of good and poor progress among both the wealthier and the poorer countries within the sample group. Of particular interest are the group of countries that have achieved impressively low rates of neonatal mortality despite very limited resources. Vietnam and Nicaragua have GDP per capita incomes of $310 and $410 respectively, and have total per capita health expenditure of only $21 and $5218.. 18. Total health expenditure is the sum of public and private health expenditures as a ratio of total population. It covers the provision of health services (preventive and curative), family planning activities, nutrition activities, and emergency aid designated for health but does not include provision of water and sanitation. Figures are from World Development Indicators, 2000.. .. 31.
(33) This is much lower than many of the other countries in this study, yet they have both reduced their NMR to below 2019.. While obviously much of this success may be. influenced by broader socio-economic issues such as high maternal literacy and levels of female empowerment, these countries establish the possibility of reaching relatively low levels of NMR with limited resources and provide interesting opportunities for health policy case studies.. The reversal of gains in neonatal health in sub-Saharan Africa is both concerning and unusual.. While long term patterns in child mortality have often historically been. adversely affected by reversals within Europe, these have mostly affected older age groups (Reher, Perez-Moreda et al. 1997, p 46-47). Neonatal mortality, while declining more slowly, has been resistant to adverse change, and reversals have been modest. This is possibly because many of the sharp, short term increases in child mortality resulted from epidemics of infectious diseases which have little impact on very young infants. The causes behind the poor progress in reducing both neonatal and later childhood deaths in Sub-Saharan Africa are likely to be many and complex. Economic decline and conflict are likely to have played a significant role, as is the increasing failure of heath systems and reduced access to quality services (Hanmer et. al 1999, Simms et. al. 1998, both cited in Costello and White 2001). The impact of the HIV / AIDS epidemic on post-neonatal mortality is well established, but is less certain for the neonatal period. A systematic review and meta-analysis on the impact of HIV on perinatal outcomes (Brocklehurst and French 1998) found an increased risk of perinatal mortality. However, this seems to be mostly related to stillbirths and the slight increase detected in neonatal deaths was not statistically significant, possibly because of the small number of studies available. Ticconi et. al. (2003) found infants of HIV positive mother were more likely to experience pre-term delivery, low and very low birthweight and low APGAR scores20, all of which are important underlying causes of neonatal mortality. Mahy (2003, p. 31) also suggests that HIV can have indirect adverse impacts on child health though diverting 19. Since this study has been underway the Vietnam DHS 2002 survey has been published, which gives an estimate for NMR of 12.2 per 1000 live births. 20 An APGAR score is a summary measure of the condition of the newborn infant based on heart rate, respiratory effort, muscle tone, reflex irritability, and colour. Each factor is given a score of 0, 1, or 2; the sum of these five values is the Apgar score, ranging from 0 to 10.. .. 32.
(34) scarce resources away from maternal and child health services and further weakening health systems. The impact of HIV on neonatal mortality is one which requires more research both in terms to which it increases mortality, and also the degree to which high prevalence of HIV may bring about changes in established patterns (i.e. effect the ratio of early to late neonatal deaths, or the ratio of stillbirths to early neonatal deaths).. 6.3. Why is progress poorer in the neonatal period?. The most commonly suggested reason for poor progress in the neonatal period is that health services have failed to meet the need of the newborn. Bhutta (2000, p. 809) argues that in South Asia most of the progress in reducing child mortality has been the result of global initiatives and vertical programmes, which fail to meet the needs of infants in the first month of life. Even child health strategies aimed at conditions that also affect the neonatal period may be limited in their impact because the method of delivery is inappropriate. One leading cause of death common in both neonatal and post neonatal age-groups is pneumonia and respiratory tract infections, but traditional facility-based services may be inaccessible to the newborn as many cultures confine mother and baby to the home for 40 days after delivery. Health staff also often lack confidence or have been inadequately trained to treat very young babies.. As previously mentioned, the key channel for improving neonatal mortality is maternal health services, but the development of effective care in many parts of the world has to date often been hampered by limited resources, lack of political will, and, until recent years, poorly defined strategies (Inter-Agency Group on Safe Motherhood, 1997). Coverage for basic obstetric services remains a problem: in developing countries only 68% of women received any antenatal care21 (WHO / UNICEF 2004, p.5), and only 53% have their babies delivered by a skilled attendant (UNICEF 2001). Even when services do exist quality is often poor, or social and financial barriers prevent women from making use of them (Adamu and Salihu 2000). AbouZahr and Wardlow (2001, p564-8) found that while some countries had made significant progress in increasing the level of 21. .. Defined as a least one visit with a skilled provider.. 33.
Figure


+7


Related documents
The present comprehensive meta- analysis pooled a total of nine independent cohorts with 1320 cancer patients, and the results indicated that high HOXA11-AS expression was
Torres, Generalized weighted Ostrowski and Ostrowski–Gr¨ uss type inequalities on time scale via a parameter function, J.. Ngˆ o, A generalization of Ostrowski inequality on time
The condensation process of water vapor in wet natural gas within the Laval nozzle is simulated numerically, the two-fluid mathematical model of condensation flow is
For flooding, contention factors depend on number of neighbors as in static case and all traffic types have equal contention factors. However, transit factors vary for dif-
We showed how determinantal point processes can be applied to subset selection tasks like extractive sum- marization, where negative interactions are key and traditional models
In this study, the relationship between ground-glass opacity (GGO) visibility and physical detectability index in low-dose computed tomography (LDCT) for lung cancer screening
At an ethephon concentration solution of 2.5% (v/v), preservation time from 60 to 72 hours, Latundan bananas ripened equally, low weight loss, high reducing glucose
Chris OLDENHOF, Member of the Boards of APIC (Active Pharmaceutical Ingredients Committee) and EFCG (European Fine Chemicals Group), within the CEFIC (European Chemical
