doi:10.1093/imamat/hxm005
Advance Access publication on March 22, 2007
Mathematical modelling of the catalyst layer of a polymer
electrolyte fuel cell
A. A. SHAH†
Department of Mathematics, Simon Fraser University, 8888 University Drive, Burnaby, British Columbia, Canada V5A 1S6
GWANG-SOOKIM
Ballard Power Systems, 4343 North Fraser Way, Burnaby, British Columbia, Canada V5J 5J9 AND
K. PROMISLOW
Department of Mathematics, Michigan State University, East Lansing MI 48824, USA [Received on 5 December 2005; accepted on 19 November 2006]
In this paper, we derive a mathematical model for the cathode catalyst layer of a polymer electrolyte fuel cell. The model explicitly incorporates the restriction placed on oxygen in reaching the reaction sites, capturing the experimentally observed fall in the current density to a limiting value at low cell voltages.
Temperature variations and interfacial transfer of O2between the dissolved and gas phases are also
in-cluded. Bounds on the solutions are derived from which we provide a rigourous proof that the model admits a solution. Of particular interest are the maximum and minimum attainable values. We perform an asymptotic analysis in several limits inherent in the problem by identifying important groupings of pa-rameters. This analysis reveals a number of key relationships between the solutions, including the current density, and the composition of the layer. A comparison of numerically computed solutions and asymp-totic solutions shows very good agreement. Implications of the results are discussed and future work is outlined.
Keywords: fuel cell; catalyst layer; oxygen diffusion; temperature variations; bounds; asymptotic analysis.
1. Introduction
The polymer electrolyte (or proton exchange membrane) fuel cell (PEMFC) is a promising energy source, particularly for application in the automotive industry. Its high power density and low operating temperature make it an attractive, environmentally friendly alternative to methods based on hydrocarbon fuels. Before the benefits of this technology can be realized, several important practical issues need to be resolved with the overarching aims of reducing the manufacturing cost and optimizing the performance and durability. The heart of a single PEMFC (see Fig. 1) is composed of a proton conducting membrane (typically Nafion) sandwiched between an anode and a cathode. The latter are formed from sheets of carbon paper and are commonly referred to as gas diffusion layers (GDL). Catalyst layers, composed roughly of carbon-supported platinum (Pt) particles and an electrolyte (sometimes called ionomer), are
†Present address: School of Engineering, University of Southampton, SO17 1BJ Southampton, UK. Email: ashah@pims.
math.ca, [email protected]
c
The Author 2007. Published by Oxford University Press on behalf of the Institute of Mathematics and its Applications. All rights reserved.
at University of Southampton on May 26, 2010
http://imamat.oxfordjournals.org
FIG. 1. A schematic of a single polymer electrolyte fuel cell. Not shown are the gas channels through which the reactants are fed. They feature in the model through the boundary conditions prescribed at the interfaces between the CCL/membrane and CCL/GDL.
pressed between the electrodes and the membrane. The basic principle of the PEMFC is to convert chemical energy into electrical energy. At the anode, hydrogen (H2) is fed to multiple gas channels and delivered to the anode catalyst layer through the GDL. Electro-oxidation of the H2adsorbed on the Pt surfaces forms protons (p+) and electrons (e−); e−migrate through an external circuit and p+through the membrane. Oxygen (O2) is similarly fed at the cathode and combines with p+and e−in the cathode catalyst layer (CCL) to form water. The Pt (or Pt alloy) catalyst is necessary; without it, the reactions are too weak to support a meaningful current. The cost of Pt immediately presents the challenge of optimizing its use. The required amount of Pt has seen a 10-fold reduction in the last few years, but the percentage that is ‘utilized’ is still very low (approximately 20%).
The catalyst layers are arguably the most complex components of the fuel cell. The gaseous species and liquid water flow through the pores formed between the solid components (carbon, Pt and elec-trolyte). The reactants and water also exist as species dissolved in the electrolyte. e−migrate through the matrix of carbon grains and p+through tortuous pathways provided by the electrolyte. Of the two catalyst layers, the CCL receives most attention, primarily because of the relatively slow rate of O2-reduction reaction (ORR) and because the management of water (produced in the CCL) is an issue of great practical importance; although liquid water can hamper the transport of gaseous O2, the conduc-tivity of the membrane (and electrolyte) increases with increased water content.
An effective tool for measuring the performance of a PEMFC is the polarization curve, a plot of cell voltage (measuring the potential drop from the anode to the cathode) against current density. A typical such curve is sketched in Fig. 2, from which we can identify three primary sources of voltage loss:
• The activation losses relate to the sluggish nature of the reactions at the electrodes, particularly of the adsorption step of the ORR at the cathode.
• The ohmic losses result mainly from ionic and electronic resistances, but contain a contribution from the limitation placed on the O2in reaching the Pt surfaces in the CCL.
at University of Southampton on May 26, 2010
http://imamat.oxfordjournals.org
FIG. 2. The typical profile of a polarization curve exhibiting all three forms of voltage loss.
• The mass-transport losses arise almost entirely from the O2-transport limitation just described. Their effect on performance is a sharp reduction in the current density to a limiting value at low cell voltage.
Improved performance (increased total power and higher current) translates effectively to an increased limiting current density and a reduction in the magnitude of the slope. The profile in Fig. 2 is determined largely by the CCL design and performance, as the list above suggests. The pores of the CCL are (on ‘average’) much smaller than those of the GDL and the hydrophilic regions in the CCL cause water retention. Moreover, reaction is limited by the availability of catalyst, and can only occur at points of contact between the Pt and the electrolyte. The importance of the CCL explains the growing emphasis placed on its behaviour and design. Laboratory investigation of PEMFC is generally costly and difficult; for many problems of interest, mathematical (and computational) modelling has been a cost-effective aid (see Weber & Newman, 2004, for a review).
Experimental studies have suggested that, during the preparation process, the carbon grains form clumps (called agglomerates) that are coated by the electrolyte (Weber & Newman, 2004; Uchida et al., 1995, 1998; Siegel et al., 2003; Liu et al., 2003; Lister & McLean, 2004; Mizuhata et al., 2004). It is also evident that this catalyst layer structure can be far from uniform. The theoretical problem is further compounded by a lack of certainty in the aspects of the physical behaviour, such as water formation, phase change, p+migration and the electrochemical kinetics. It is therefore inevitable that simplifica-tions be made. Two of the earliest models can be found in Giner & Hunter (1969) and Cutlip (1975), in which the CCL is assumed to be composed of single ‘pores’ that span the thickness of the layer. While such models lead to analytical solutions, largely through oversimplification of the equations, they neglect many of the important physical phenomena.
Models that employ the agglomerate description are found in, e.g. Siegel et al. (2003, 2004), Lin et al. (2004), Guo & White (2004), Yin (2005) and Mazumder & Cole (2004), in which the agglomerate-level activity is incorporated into a homogeneous model by assuming that a film of electrolyte and/or liquid water surrounds each (spherical) agglomerate particle—motivated by the well-established theory of porous catalysts (see Chapter 3 of Aris, 1975). The three main variants are as follows:
at University of Southampton on May 26, 2010
http://imamat.oxfordjournals.org
• Include external resistance to the O2 movement arising from the film(s); this yields an expression for the limiting current density as a function of the agglomerate characteristics (Siegel et al., 2003, 2004; Lin et al., 2004; Mazumder & Cole, 2004).
• Include internal resistance to the O2movement due to flooding of the agglomerates with electrolyte or liquid water (Guo & White, 2004; Jaouen et al., 2002).
• Include both internal and external resistances, as described above (Yin, 2005; Sun et al., 2005).
Incorporation of mass-transport limitations a priori distinguishes these models from those of Song et al. (2004), Eikerling & Kornyshev (1998), Eikerling & Kornyshev (1999), Wang et al. (2004), Um et al. (2000), Genevey (2004) and Hsuen (2003), which treat the CCL as a homogeneous porous medium, i.e. each phase exists in each reference control volume and is specified solely by a volume fraction. Such models are not able to capture a limiting current density at all.
In the vast majority of cases, the main tool for theoretical investigation is numerical simulation, often multidimensional (Siegel et al., 2003, 2004; Sun et al., 2005; Mazumder & Cole, 2004; Um et al., 2000) with the CCL model embedded in a much larger code. The influence of the CCL can be difficult to divorce from the influences of the other components represented in the model. The numerical methodology also requires that virtually all the parameter values are assumed fixed, with often order-of-magnitude discrepancies in the values assumed. Investigation across (the extremely high dimensional) parameter space is necessarily a lengthy numerical undertaking. Such investigations are clearly more suited to approximate and asymptotic analysis.
Mathematical treatments, using analytical methods, are found in Giner & Hunter (1969), Cutlip (1975), Eikerling & Kornyshev (1998, 1999) and Hsuen (2003). Eikerling & Kornyshev (1998, 1999), employ an isothermal homogeneous model, with a pseudo Maxwell–Stefan law for the O2 flux and Ohm’s law for p+ migration. They seek exact or implicit solutions in selected limits, which are justi-fied through semi-heuristic arguments. Hsuen’s (2003) approach is also homogeneous and isothermal, but includes an equation for the electrical potential and incorporates the GDL. However, his analysis rests on the (unjustified) assumption that either the O2concentration or the electrolyte potential can be approximated by piecewise polynomial functions. There are significant gaps in this type of analysis, mainly in relation to liquid water movement (by capillary action), the multiphase nature of the struc-ture, temperature variations and mass transfer between phases. In this paper, we tackle the last three in this list, focussing on relating the composition and microscopic details of the CCL structure to the profiles of O2concentration, overpotential and temperature and ultimately to the performance measured through the current density. We pay particular attention to the transport of O2, as both a gaseous and dissolved species (in liquid water and electrolyte). It has a major impact on the performance of the cell at both low and high levels of humidity. Heat transport is of vital importance to the management of water and longevity of the cell. Even minor temperature increases (of a few degrees Celsius) can result in severe dehydration of the electrolyte, which makes it necessary to obtain a measure of control over its maximum value. Through the saturation pressure, temperature variations also drive deviations from equilibrium between the vapour and the liquid (unit relative humidity), and therefore drive condensa-tion/evaporation.
In the Section 2, we present the model and the underlying assumptions. In Section 3, we derive a priori bounds and prove the existence of at least one solution. In Sections 4 and 5, important dimen-sionless parameters are identified, asymptotic solutions are constructed and numerical comparisons are provided. A summary follows in Section 6 where we also discuss the implications of the results and outline future work.
at University of Southampton on May 26, 2010
http://imamat.oxfordjournals.org
2. Mathematical model
The model we derive is 1D in the ‘through-plane’ direction, i.e in a direction perpendicular to the yz plane in Fig. 1. This is a justified assumption when the geometric area of the CCL is small and the flow rate (of delivery of O2) is high, as are usually the case for test cells. We also assume steady-state conditions, which are valid for the many so-called ‘stationary applications’ of PEMFC. Other important assumptions and details are now listed:
Physical characterization of the CCL: The CCL structure that we assume is motivated by the large body of experimental results described in Section 1 (Weber & Newman, 2004; Uchida et al., 1995, 1998; Siegel et al., 2003; Liu et al., 2003; Lister & McLean, 2004—we refer in particular to the elec-tron microscopy images in Figs 4–6 of Middelman (2002)). Three distinct length scales can be iden-tified: (a) the length of the catalyst layer, from the membrane interface to the GDL (10–100µm); (b) the large-scale primary pores separating the agglomerates (50–1000 nm) and (c) the separation between the individual carbon grains or secondary pores (1–50 nm). We treat the CCL as a porous medium with a solid phase made up of Pt-supporting carbon particles and electrolyte. As in, e.g. Siegel et al. (2004), Guo & White (2004), Yin (2005) and Sun et al. (2005), the carbon grains are assumed to form spherical clusters, which we call agglomerates (see Fig. 3), and between the agglomerates are the primary gas pores (constituting phase 1). The quantity of electrolyte inside the agglomerates depends on the preparation process and the precise volume is difficult to ascer-tain (Uchida et al., 1995; Lister & McLean, 2004; Mizuhata et al., 2004). To take account of the
FIG. 3. The spherical agglomerate structure assumed. Oxygen diffuses through the phase 2 layer and reaction occurs at the surfaces
of the agglomerates.
at University of Southampton on May 26, 2010
http://imamat.oxfordjournals.org
electrolyte and liquid water that exists within the agglomerates, we assume that they are surrounded by homogeneously mixed regions of electrolyte, water and secondary gas pores (constituting phase 2); since the electrolyte is hydrophillic, it is reasonable to assume that any liquid water will coat its surface. Reaction is assumed to occur only on the inner surface of phase 2. To ensure the free move-ment of e−and p+across the CCL, we assume a continuous matrix of carbon grains and sufficient contact between the carbon agglomerates. These connecting paths are assumed not to contribute to the reaction rate.
Oxygen transport: Diffusion in phase 1 is assumed to be continuum. The O2concentration is as-sumed to be exchanged from phase 1 to phase 2 by dissolution to water or electrolyte, with equi-librium described by Henry’s law. The O2in phase 2 then diffuses to the inner surface (see Fig. 3) where it reacts.
Electro-neutrality: We assume electro-neutrality (the number of negative charges equals the number of positive charges) and a homogeneous distribution of charged sites in the electrolyte.
Liquid water content: We assume equilibrium between liquid water and vapour with a constant vol-ume of liquid water. These assumptions are perfectly justified at low values of relative humidity (the trend for PEMFC design), but at high levels will generally break down. Note also that the protonic conductivity is a function of water content; at a fixed electrolyte water content, it is approximately constant. These assumptions are further discussed in Section 6.
Other assumptions are that (a) there is a negligible ohmic potential drop in the electronically conducting carbon phase, justified by its high conductivity and (b) convective flow is negligible in the gas phase (see Mathias et al., 2003).
Let the concentrations of O2in phases 1 and 2 be C1and C2, respectively, i.e. mol/(m3of phase 1 or 2). A mass balance in each phase yields
1D1 d2C1
dx2 = h12(H C1−C2) interfacial mass transfer
, (2.1)
2D2 d2C2
dx2 = 1
4R(ηc,T,C s
2)
reactant consumption
−h12(H C1−C2), (2.2)
where x is the space variable (see Fig. 1), 1 (2) is the volume fraction of phase 1 (phase 2), D1 (D2) is the effective molecular diffusion coefficient for O2through phase 1 (phase 2),R(ηc,T,C2s)is the (O2reduction) reaction rate, h12 is the interfacial mass-transfer coefficient from phase 1 to 2 and H is Henry’s constant. The bulk diffusive flux of O2in phase 1 is balanced by the amount adsorbed into phase 2. The effective diffusion coefficient for O2in phase 2, D2, is an unknown function of the coefficients in the constitutive components. The implications of this are quite important; the coefficient for the pores differs by several orders of magnitude from the other two. D2 will generally depend on the geometry and composition of phase 2, the size of the secondary pores and the diffusivities in the gas and solid phases (respectively, the upper and lower bounds in Table 1). Though D2is likely to fall somewhere between these values, we will later exploit them in an asymptotic analysis as the limits of weak and strong diffusion limitation.
at University of Southampton on May 26, 2010
http://imamat.oxfordjournals.org
TABLE1 A list of parameters and their values, where available. Values are taken from Siegel et al.(2003), Um et al.(2000), Mazumder & Cole (2004), Lin et al. (2004), Song et al. (2004), Yin (2005), Sun et al. (2005), Huang & White (2000), Middelman (2002), Berg et al. (2004) and Ziegler et al. (2004)
Symbol Quantity Size
L Catalyst layer width 10−5to 10−4m
D1 Effective diffusion coefficient of phase 1 10×10−4to 10−5m2s−1 D2 Effective diffusion coefficient of O2in phase 2 10−6to 10−10m2s−1
†σ
e Effective protonic conductivity 1–10 S m−1
cw Free water concentration of phase 2 1-40 mol m−3
1 Volume fraction of phase 1 0.3−0.6
2 Volume fraction of phase 2 0.1−0.5
w Volume fraction of water in phase 2 0.1−0.4
−δS Entropy associated with ORR 236 J mol−1K−1
cO
2,ref Reference O2concentration 0.6–41 mol m
−3
iO2,c Reference cathode exchange current density 10
2to 10−4A m−2
αc Cathodic transfer coefficient 0.5–2
Rag Agglomerate radius 0.5–3µm
δ Electrolyte film thickness m
N Number of agglomerates per unit volume 1018to 1015m−3
T GDL temperature 370–390 K
E0 Open circuit potential 1 V
Uc Carbon phase potential 0–1 V
β Platinum surface per volume 106to 107m−1
C O2concentration at GDL interface mol m−3
φ Membrane potential at membrane interface V
h12 O2mass transfer rate 102to 104s−1
H Dimensionless Henry’s law constant 0.032–2
λ Effective thermal conductivity of CCL 0.2–2 W m−1K−1
†Based on a membrane water content of below seven and operating temperatures in the range 303–363 K.
With the assumption of electro-neutrality, Ohm’s law yields the following equation for the potential in phase 2,φ:
d dx
wσe
F dφ dx
p+migration
=R (ηc,T,C2s)
p+consumption
, (2.3)
wherewis the combined volume fraction of water and electrolyte in phase 2,σeis the effective protonic conductivity of phase 2 and F is Faraday’s constant (9.643×10⁴A s mol−1).
An equation for the temperature, T , is derived from an energy balance
λd2T dx2 = −
(−δs)T
ne + Fηc
R(ηc,T,Cs2)
heat generation
. (2.4)
at University of Southampton on May 26, 2010
http://imamat.oxfordjournals.org
The right-hand side is a combination of the heat of electrochemical reaction (first term), with en-tropy −(δs), and heat arising from activation losses. ne = 4 is the number of e− transferred in the reaction andλis an effective thermal conductivity. We have neglected ohmic heating which is much weaker than heating from reaction and activation losses.
The ORR rate, in mol/(m3of bulk·s), is given by the Tafel law, which assumes first-order kinetics in O2concentration and that the ‘backward’ reaction is negligible:
R(ηc,T,C2s)= βiO2,c F cO2,ref
2C2sexp
αcFηc RT
, (2.5)
where iO2,c is the exchange current density, cO2,ref is a reference O2 concentration, αc is a transfer coefficient, β is the surface area of Pt per unit volume of bulk, ηc is the overpotential and R is the universal gas constant (8.314 J mol−1K−1).βis a function of the Pt loading (Pt surface area per unit mass of Pt) and the CCL thickness. The overpotential,ηc, is defined through the relationship
ηc=E0−Uc−φ, (2.6)
where Ucis the potential of the carbon matrix, assumed constant, and E0is the reference open-circuit potential of the cathode.
2.1 Expression for C2sand the limiting current density
The O2 concentration in (2.5), C2s, is the value at the surfaces of the carbon agglomerates, i.e. at the reaction location. The value of C2s can be related to the bulk concentration in phase 2, C2, by balancing the rate of reaction with the diffusion of O2to the surfaces of the agglomerates (at steady state). This mass balance can be approximately expressed as follows:
γ(C2−C2s)= 1
4R(ηc,T,C s
2), (2.7)
whereγis a measure of the rate of O2diffusion through phase 2 to the surface of the agglomerates (in s−1). Using the definition ofR(ηc,T,C2s)and solving the resulting equation for C2sthen yields
C2s =γC2
γ+ 2βiO2,c 4F cO2,ref
eαcFηc/RT
−1
, (2.8)
so that the final form of the reaction rate is
R(ηc,T,C2s)≡R(ηc,T,C2)=
2βiO2,c
F cO2,refγ C
2eαcFηc/RT
γ+ 2βiO2,c 4F cO2,ref
eαcFηc/RT
−1
. (2.9)
In order to relateγ to the microscopic properties of the CCL, we define a phase 2 thickness, δ, an agglomerate radius, Rag, and the number of agglomerates per unit volume, N , to obtain
γ(C2−C2s)≈4πRag N2 × D2
δ (C2−C2s), (2.10)
where the first term on the right-hand side is the specific surface area of the agglomerates and the second term is the molar flux of O2to the agglomerate surfaces. We therefore have the approximate expression
γ=4πR 2 ag N D2
δ . (2.11)
at University of Southampton on May 26, 2010
http://imamat.oxfordjournals.org
Note that the quantity N is a function of not just the agglomerate radius but also the distribution (the more densely packed the agglomerates, the larger N ). The phase 2 thickness, δ, can approach zero independently of2by increasing N according to2 = 4πN((Rag+δ)3−R3ag)/3. As2 → 0, the reaction rate approaches zero, i.e. reaction can only occur in the presence of p+.
The current flow is the reverse of the p+flow; the current density, IA m−2, is therefore
I=4Frγ L
0
C2eαcFηc/RT
γ+r eαcFηc/RTdx, where r =
2βiO2,c 4F cO2,ref
. (2.12)
Asηc→ ∞, the cell voltage approaches−∞. In this limit, at fixed values of the other parameters, we find that
I→ Ilim ≡4Fγ L
0
C2dx4FγC L, (2.13)
where Ilim is the limiting value of the current density (the mass-transport limit in Fig. 2). So we see immediately that the current density is limited by the concentration of O2entering the system, the width of the CCL and the size ofγ. The latter, defined in (2.11), is proportional to the specific surface area of the agglomerates, as is the quantityβ, and the specific surface area of Pt. So, both Iand Ilim increase with increasingβ, as one would expect.
2.2 Boundary conditions
At the membrane/CCL interface, placed at x =L (see Fig. 1), we prescribe the overpotential,ηc, with the assumption that the membrane/electrolyte potential is zero at that point. Typically, the latter is close to zero, and since our focus is on the CCL, there is no loss of generality in assuming that it is identically zero (this is common approximation). The ‘cell voltage’ can then be approximated by the carbon-phase potential, Uc, which is given by Uc = E0−ηc. Since O2 cannot penetrate the membrane in the gas phase, the O2concentrations satisfy a zero-flux (Neumann) condition. For simplicity, we make the same assumption for phase 2; in reality the flux is small. The heat flux across the boundary is also assumed to be zero:
ηc=ηc, dC2
dx = dC1
dx =0, dT
dx =0. (2.14)
At the GDL/CCL interface, placed at x =0, the O2in phase 1 enters the CCL at a known concentration, C, which can be approximated from the value at the channel in a straightforward manner. It is therefore a function of the GDL properties (in addition to the channel value). Also at x =0, we assume that the O2in the electrolyte and water is in equilibrium with that in phase 2 (Henry’s law). p+cannot penetrate the GDL and are therefore subject to a zero-flux condition at x = 0. As with the O2concentration in phase 1, the temperature at x =0 is approximated from the value in the channel:
C2=H C1=C, dφ
dx =0, T(0)=T. (2.15)
A list of parameters and their values can be found in Table 1. We further refer to the comments made at the beginning of Section 4.
at University of Southampton on May 26, 2010
http://imamat.oxfordjournals.org
2.3 Nondimensionalization
It is convenient for the analysis that follows to nondimensionalize the boundary-value problem (BVP), according to
x=xcz, ηc=φcψ, T =Tτ, C2=C X2, C1=C X1, I=II, l=L/xc,
xc2= 2D2
γ , γ =
4γF cO2,ref 2βiO2,c
, κ=4F2D2C wσeφc
, h = x 2
ch12
2D2
, η=2D2 1D1 ,
s= −(δS)T 4Fφc
, I = xcC2βiO2,c
cO2,ref
, ∆= 42D2C R λαc
, ψ = ηc φc
, φc= RT αcF
,
(2.16)
to yield
X2= γX2e
ψ/τ
γ+eψ/τ −h(H X1−X2), (2.17a)
X1= h
η(H X1−X2), (2.17b)
ψ= −κγX2eψ/τ
γ+eψ/τ , (2.17c)
τ= −(sτ +ψ)∆γX2e
ψ/τ
γ+eψ/τ , (2.17d)
I =γ l
0
X2eψ/τ
γ+eψ/τdz with Ilim≡γ l
0
X2dz, (2.17e)
ψ(l)=ψ, τ(0)=1, X2(l)=X1(l)=0, X2(0)=H X1(0)=1, ψ(0)=τ(l)=0,
(2.17f)
where primes denote differentiation w.r.t. z. Note that the dimensionless potentialψ is actually a di-mensionless overpotential. The reference length scale, xc, is a function of the ratio of bulk molecular diffusion of O2through phase 2 and the diffusion rate to the surfaces of the agglomerates. The latter quantity, γ, appears to be inversely proportional to the Pt surface area per unit volume, β. However, sinceβis proportional to the specific surface area of the agglomerates, there is in effect no dependence onβ. The current density, including the limiting value, does, however, depend onβ through the refer-ence valueI. We can further infer that the reaction rate, and therefore the solution, is heavily dependent on the size ofγ. Asγ → ∞, the classical Tafel reaction rate is recovered. On the other hand, forγ →0, the reaction depends entirely on the O2concentration.
3. A priori bounds and existence
For the isothermal equivalent to (2.17), a priori bounds are straightforward to derive from maximum principles, e.g.
0X2H, ψ ψψ−
Hκγ 2 (z
2−l2),
at University of Southampton on May 26, 2010
http://imamat.oxfordjournals.org
in the limit h → ∞. Note that there is no restriction on the width of the catalyst layer, l (in fact these bounds are uniformly continuous in l). For the nonisothermal model (2.17), we shall discover that analysis of the temperature problem places a restriction on l (in deriving a maximum principle). Furthermore, we are able to derive bounds on the solution, particularly the maximum values that can be assumed at the endpoints z=0 and z=L. Using the Leray–Schauder fixed-point theorem, we can then demonstrate that (2.17) admits a solution.
LEMMA3.1 (A priori bounds) Assume that the condition l2<2/(H s∆γ )holds. Then, classical solu-tions to (2.17) satisfy the following estimates:
0X11,
H
cosh(l√γ+h) X2H, H X1X2, 1τ τmax≡1+
H∆γl2(s+ψ) 2−l2s H∆γ , ψψψ− Hκγ
2 (z
2−l2)ψ+ Hκγl2
2 ≡ψmax.
(3.1)
Proof. We first demonstrate that X2and X1are nonnegative. Note that the function eψ/τ/(γ +eψ/τ)is bounded above by unity, for all values ofψandτ inR. Let us assume that X2=0 at an interior point, z = z∗, X1and X2 are positive in [0,z∗)and X2(z∗) < 0. From (2.17a) and (2.17b), we find that in [0,z∗),
(H X1−X2)− h
η(H+η)(H X1−X2)= −γ X2eψ/τ
γ+eψ/τ <0, (3.2)
so that H X1−X2cannot assume a nonpositive interior minimum. Now, since(H X1−X2)(0)=0 and (H X1−X2)(z∗) >0, H X1−X2 0 in [0,z∗]. By continuity, there exists a regionΩ1 ⊂[z∗,l] in which X10 and X20 and therefore
X2−
γeψ/τ γ+eψ/τ +h
X2= −h H X10, X1− h H
η X1= − h
ηX20, x∈Ω1. (3.3) Suppose that X1 is monotonically increasing in [0,z∗]. From (3.3), X2 cannot attain a nonpositive interior minimum and X1cannot attain an interior nonnegative maximum inΩ1. Therefore,Ω1=[z∗,l] and X20 inΩ1. Integrating this inequality overΩ1, we find that X2(z∗) >0, which is a contradiction. Thus, X1is monotonically nonincreasing in [0,z∗]. If H X1−X2remains positive, from (2.17a), we find that X2cannot attain a nonpositive minimum in the region [z∗,l]. Integrating X2 0 over [z∗,l] once again leads to a contradiction. There must therefore exist a point z∗at which H X1−X2 = 0, with H X1−X2 0 in [0,z∗] and, by continuity, H X1−X2 0 for some regionΩ2 ⊂ [z∗,l]. If H X1−X2remains nonpositive inΩ2, X10 in the latter region. Integrating this expression overΩ2 yields X1(z∗) >0, a contradiction. Therefore, there must exist a point z∗∗∈Ω2at which H X1−X2=0 and(H X1−X2)>0. In the regionΩ2=[z∗,z∗],
X2− γe
ψ/τ
γ+eψ/τX20, X
1 0, (3.4)
so X2cannot attain a nonnegative maximum and X1cannot attain a minimum in the interior of [z∗,z∗]. Both X1 and X2 are therefore negative in the latter region and in order that(H X1−X2)(z∗) = 0,
at University of Southampton on May 26, 2010
http://imamat.oxfordjournals.org
X2must attain a negative maximum in [z∗,z∗]. By continuity, there is a regionΩ3⊂[z∗∗,l] in which H X1−X20 with both X1and X2negative. In this region, X1 0 and X2 0, so that X1cannot attain a maximum and X2a minimum, and(H X1−X2)(z)−(H X1−X2)(z∗) > 0,∀z ∈ Ω3. This demands thatΩ3 = [z∗∗,l]. From (3.2), we now obtain(H X1−X2) 0, x ∈ Ω3, suggesting that (H X1−X2)(z∗∗) <0, which is a contradiction. Therefore, X2is positive in [0,l].
Let us now assume that X2 is zero at an interior point z∗, with X1 0 and X2 > 0 in [0,z∗]. Examining the equations, there are two possibilities (i) H X1−X2 < 0 in [0,z∗] and (ii) H X1−X2 has a positive maximum in [0,z∗]. Let us assume case (i) holds. In the region [0,z∗], X1<0, X2>0 and(H X1−X2)<0, so that there is no minimum in X1, maximum in X2or minimum in H X1−X2 in(0,z∗). Both X1and X2must therefore decrease monotonically in the latter region. If X2 remains positive, η(H X1−X2)−h(H +η)(H X1−X2) < 0 in [0,l], so that H X1−X2cannot attain a nonpositive minimum, and is therefore negative in [0,l]. Integrating the resulting identity, (H X1− X2) < 0, over [0,l] yields(H X1−X2)(0) > 0, which is a contradiction. Therefore, there exists a point, z1, at which X2 =0, but this cannot happen unless X1< 0 at some point z∗ <z1. In [z∗,z1], X2increases and X1 decreases monotonically. By continuity, there is a regionΩ1 ⊂ [z1,l] in which H X1−X2is negative. IfΩ1 = [z1,l], X1 0 in [0,l], which leads to a contradiction, X1(0) > 0. This implies the existence of a point z∗∗ at which H X1−X2 =0 and a regionΩ2 ⊂[z∗∗,l] in which H X1−X2 0 and X2<0. Arguing as above, we find that necessarilyΩ2=[z∗∗,l]. Integrating the inequality(H X1−X2)>0 over [z∗∗,l], we find that(H X1−X2)(z∗∗) <0, a contradiction. A similar line of reasoning rules out possibility (ii). This proves that X1and X2are nonnegative.
From (2.17a) and (2.17b), and the nonnegativity of X2, we now obtain
η(H X1−X2)−h(H+η)(H X1−X2)0, x ∈[0,l], (3.5) so that H X1−X2cannot attain a nonpositive minimum. Suppose that H X1−X2=0 at some z∗∈(0,l). Since it cannot attain a negative minimum, H X1−X2 0 in [z∗,l]. But then integrating(H X1− X2) < 0 over [z∗,l] yields(H X1−X2)(z∗) >0, a contradiction. Therefore, X2 H X1, so that X1 0, whereupon X1 1 from Hopf’s lemma, and therefore X2 H . Since X2 0 and X1 0, the inequality X2−(γ +h)X20 holds. Therefore, the solution to the problem
X2−(γ +h)X2=0, X2(0)−H =X2(l)=0 (3.6) is a lower solution to (2.17a), (2.17f), i.e. X2X2. This yields
X2H
cosh((z−l)√γ+h)
cosh(l√γ+h) , (3.7)
which completes the proof of the first part of (3.1).
We move now to overpotential and temperature. Using the upper and lower bounds for X2in (2.17a), we are led toψψand
ψ−κγH, (3.8)
which leads to
ψψψ+ Hκγ 2 (l
2−z2). (3.9)
To boundτ from above, we first note that the classical generalized maximum principles do not apply because of the positivity of the term multiplyingτ on the right-hand side of (2.17d). To overcome this
at University of Southampton on May 26, 2010
http://imamat.oxfordjournals.org
difficulty, we will need the functionw(z) >0, constrained to satisfy
w+∆γs Hw <0, z∈(0,l). (3.10) A suitable function isw(z)=1−kz2, where k > ∆γs H/2, and we must assume that
l< √1 k <
2
∆γs H. (3.11)
Next, from the positivity ofτ,
τ= −(sτ+ψ)∆γX2eψ/τ
γ+eψ/τ >−(sτ +ψmax)H∆γ, z∈(0,l), (3.12) whereψmaxis defined in (3.1). We can demonstrate that functions satisfying
τ2= −(sτ2+ψmax)H∆γ, z∈(0,l), τ2(0)=1, τ2(l)=0 (3.13) are upper solutions to (2.17d), i.e. they satisfyτ2 τ in [0,l]. Furthermore, we can demonstrate that functions satisfying
τm −(sτm+ψmax)H∆γ, z∈(0,l), τ2(0)1, τ2(l)0 (3.14) are upper solutions to the problem inτ2, and therefore upper solutions toτ. The proof of these assertions requires the existence of the functionw(x)and hence the constraint on the size of the domain (the size of l). Essentially, it can be shown thatτ/w,τ2/wandτm/wyield to a maximum principle. A suitable τmis found in the form
τm=1+az(2l−z), where a H∆γ (s+ψmax)
2−l2s H∆γ , (3.15)
and additionally, we require that l2<2/(∆γs H), which is the same as Condition (3.11). Alternatively, we can solve Problem (3.13) directly to obtain a sharper bound, but since it is much more difficult to interpret, given the upper bound on l, we will use (3.15) in the sequel. Finally, from the positivity
ofτ,τ<0 so thatτ 1 in [0,l].
REMARK3.1 (On the proof of Lemma 3.1) A restriction of the type (3.11) on the size of l, as a function of the other parameters, is necessary in order to establish a maximum principle. It may be possible to increase the size of l through a different choice of the functionw(z). It is not possible, however, to split the domain and employ separatewfunctions in each subdomain, as in the initial-value problem—see the examples in Chapter 1 of Protter & Weinberger (1984); τ is a priori unknown at all points z ∈ (0,l), making separate upper and lower solutions, in each subdomain of [0,l], impossible to construct. Restriction (3.11) is of the form l2<2/(k D2γC), for some constant k, suggesting that it is more severe for increasing D2,γand C.
REMARK 3.2 Violation of Condition (3.11) does not imply that solutions fail to exist, only that (we conjecture) uniqueness may not be assured. This is a possible physical interpretation of the result.
Equations (2.17) constitute a semi-linear elliptic system. Each of the source terms is Lipschitz in its arguments and therefore H¨older continuous with any exponentα∈ (0,1). We can prove the existence of at least one solution using the Leray–Schauder fixed-point theorem. We use the variant found in Ladyzhenskaja & Ural’cera (1968).
at University of Southampton on May 26, 2010
http://imamat.oxfordjournals.org
THEOREM3.1 (Leray–Schauder) LetMbe a Banach space, t ∈[0,1] a real parameter,B=[0,1]×M the corresponding space of ordered pairs and u a real vector. Suppose thatH(u,t):B→Mis a compact operator continuous in v∈Mand uniformly continuous in t. Suppose further that there exists a constant M such that every possible solution ofH(u,t) =0 with u ∈ Mand t ∈ [0,1] satisfiesuB < M. If there exists a unique solution of the equationH(u,0)=0 inM, then there exists a solution of the equationH(u,1)=0 inM.
In order to apply the theorem above, we require that solutions of (2.17) can be contained in a ball in the Banach spaceC[0,l]≡C[0,l]4. Lemma 3.1 provides these bounds.
COROLLARY3.1 (To Lemma 3.1) Classical solutions to (2.17) satisfy the following a priori bound:
|u|C[0,l]≡ |X2|∞+ |X1|∞+ |τ|∞+ |ψ|∞<M ≡1+H+ψmax+τmax. (3.16) For t ∈[0,1], we now define
B=[0,1]×M, whereM≡ {u∈C[0,l]:|u|C[0,1]M+}.
Here, the bound M is defined as in (3.16) andis an arbitrary positive vector. That the bound M holds for all t ∈[0,1] is seen by examining (3.1) and the proof of Lemma 3.1. Next, we consider the following family of linear systems:
X2= γX2e
ψ/τ
γ+eψ/τt−h(HX1−X2)t, X
1=
h
η(HX1−X2)t, (3.17a)
ψ= −κγX2eψ/τ γ+eψ/τ t, τ
= −(sτ +ψ)∆γX2eψ/τ
γ+eψ/τ t, (3.17b)
ψ(l)=ψt, τ(0)=1, X2(l)=X1(l)=0,
X2(0)=H X1(0)=t, ψ(0)=τ(l)=0, (3.18) where for each t ∈ [0,1], the system is uniformly elliptic. Problem (3.17) can be written more com-pactly as
u(x;t)=ft(v), (3.19)
where u is a vector defined as in the previous theorem and f is defined by the right-hand side of (3.17). For each v=(X1,X2,ψ, τ)∈M, these problems define the transformations u(x;t)=Ttv, t ∈[0,1]; i.e. to each(t,v)∈ B, (3.17) assigns a unique solution u(x;t) ∈ C2+α[0,l], for anyα ∈ (0,1). The unique solvability of the linear problem (3.17) in the classC2[0,l] is assured by the classical results for uniformly elliptic linear BVP, using, e.g. Schauder’s theorem. In fact, writing Ftv(x)as the operator associated with ft(v), we can obtain the following bound:
|u(x;t)|C2+α[0,l]C|Ftv(x)|Cα[0,l], (3.20) for some positive constant C—see the Schauder estimates in Gilbarg & Trudinger (2001). Thus, from the Lipschitz property of ft, u(x;t) ∈ C2+α[0,l] for v ∈ Cα[0,l]. Note that the dependence of the
at University of Southampton on May 26, 2010
http://imamat.oxfordjournals.org
boundary conditions forτ on the parameter t is selected so thatτ(x;t) >0 for all t , ensuring a unique solution u(x;0) = (0,0,0,1). To make precise the correspondence between Problem (2.17) and the transformationTt, note that the solutions (in the spaceC2+α[0,l]) to
u(x;t)=f(u(x;t),t), (3.21a)
ψ(l;t)=ψt, τ(0;t)=1, X2(l;t)=X1(l;t)=0, X2(0;t)=H X1(0;t)=t, ψ(0;t)=τ(l;t)=0
(3.21b)
are fixed points of the transformationTt. The converse is also true (from u(x;t)=Ttu(x;t)∈C2[0,l] and bootstrapping). Therefore, (3.21) is equivalent to the family of fixed points of the transformationTt, and for t=1, System (3.21), and thereforeT1u(x;1)=u(x;1), reduces to (2.17).
In order to demonstrate thatTt is completely continuous, we first note thatTt can be extended to
St:C[0,l]→W2p[0,l], as in Gilbarg & Trudinger (2001) or Ladyzhenskaja & Ural’cera (1968). Now, let u1 and u2 be two solutions of (3.21) corresponding to(t,v1)and(t,v2)∈ B, respectively. Then, u1−u2satisfies
(S1u1−S1u2)W2
p[0,l]|f(u1,t)−f(u2,t)|C[0,l] (3.22)
from the Lipschitz property of f and its uniform continuity in t ∈[0,1]. We therefore have continuity ofSin v ∈C[0,1]. From the compactness of the identityI:W2p[0,l] →C[0,l], for sufficiently large p, we can now extendTtto an operatorTt∗=St◦Ithat maps an arbitrary bounded set in [0,1]×C[0,l] into a compact set in C[0,l] and is continuous in v. Uniform continuity of Tt in t follows from the definition ofTt.
THEOREM3.2 (Existence) Let the assumptions of Lemma 3.1 apply. Then there exists a solution u∈
C2+α[0,l] to BVP (2.17).
Proof. Consider the homotopy Ht ≡ I−Tt∗, where I is the identity map onC[0,l]. This operator inherits the compactness and continuity properties ofTt∗. It is obvious thatHt =0 for any u∈ ∂M. Furthermore, for t =0, the unique solution of (3.21) is u=(0,0,0,1). Therefore, a fixed point exists for t = 1; or what is the same, the Leray–Schauder degree of the transformation is well-defined and deg(H1,M,0)=deg(H0,M,0)= −1, and thus existence is proved inC2+α[0,l]. 4. Asymptotic structure of the solutions
Equations (2.17) are amenable to an asymptotic analysis in appropriate limits. To expose these limits, we estimate the values of the dimensionless quantities in (2.17). These are shown in Table 2. There is a significant degree of uncertainty in a number of influential parameters. Some of the values reported for the quantities appearing in Table 1 differ by several orders of magnitude. iO2,c, e.g. is taken as 4.26×10²A m−2in Berg et al. (2004) but assumes the value 3.85×10⁻⁴A m−2in Sun et al. (2005). The main reasons for these discrepancies are
• the difficulties associated with experimental measurement,
• the values are often evaluated by fitting numerical results to experimental data, • differences in composition and preparation and
• differences in operating conditions.
at University of Southampton on May 26, 2010
http://imamat.oxfordjournals.org
TABLE2 Estimates for the dimensionless parameters in (2.17).κ,∆ and ηdepend on D2, so their values can vary by several orders of magnitude
Quantity Approximate size
φc 0.03–0.12
κ/C 10−6to 10−2
h 1 to 10−4
η 0.1 to 10−6
s 20–40
∆/C 10−8to 10−2
This underlines the benefit of an asymptotic analysis; that ranges of parameter space can be explored relatively easily. Moreover, the asymptotic solutions will explicitly demonstrate the dependence of O2 concentration, overpotential and temperature on the dimensionless quantities (2.16), indicating how to gain a measure of control over their values. We split the analysis into three parts, according to the strength of the reaction on the concentration of O2. Sinceγ can be small or large independently of D2 (see (2.11)), we can exploit the limit in∆andκcorresponding to the upper bound of D2in Table 1 (see (2.16)). In this limit, corresponding to weak diffusion limitation (through phase 2),∆γ max{g, ψ}and κγ can be O(1)leading to O(1)variations in temperature and/or overpotential though we point out that the variations will typically be smaller. Nevertheless, this type of approach to clearly identify trends is commonplace in asymptotic analysis and is known to yield qualitatively accurate information (e.g. the ‘high activation energy’ limit in combustion theory).
The numerical solutions presented below were generated with the MATLAB BVP solver bvp4c.
4.1 Strongly O2-dependent reaction:γ eψ/τ
We assume firstly that lnγ ψ/τ (eψ/τ is large in comparison withγ). This could happen, e.g. if (i)γ 1 andψ >0 or (ii) if eψ γ and variations inψandτ are asymptotically small (from the valuesψand 1, respectively), both of which are possible. Thus,γneed not necessarily be small. In fact, sinceψc 1 for typical values ofφ, eψ/τ is generally large, particularly if variations inψfromψare small. We further employ the limitsη → 0,∆ → 0 andκ → 0, all of which are physically realistic. The analysis proceeds in two parts, depending on the size of h.
(1) h>O(η)(fast exchange):
In this limit, the exchange of O2from phase 1 to phase 2 occurs instantaneously at leading order. With other limits as above, we expand as follows:
X2∼X2,0, X1∼X1,0, ψ∼ψ0, τ ∼τ0, (4.1) yielding
X2,0=γX2,0, H X1,0=X2,0, (4.2) which has a solution, subject to the boundary conditions (2.17f), given by
X2∼X2,0=H
cosh(√γ (z−l))
cosh(√γl) , X1∼X1,0=H
−1X
2,0. (4.3)
at University of Southampton on May 26, 2010
http://imamat.oxfordjournals.org
FIG. 4. Comparison of leading-order asymptotic and numerical solutions: plots of X2,0, as given by (4.3), against the numerically
computed solution of the full system (2.17). In all calculations,ψ=3,∆=κ=1/50 and h=125η=1.7×10⁻³.
The concentration in the electrolyte reaches a minimum of H/cosh(√γl)at z = l, and ap-proaches the solution X2,0≡H asγ →0. Figure 4 demonstrates that the asymptotic solutions compare very well with the numerical solutions of the full system (2.17). From (2.17e), we find that the current density satisfies
I ∼I0≡γ l
0
X2,0dx=H√γtanh(√γl), Ilim∼I (4.4) and has the asymptotic behaviour I ∼γHl asγ →0.
In what follows, we shall assume that ηis small enough that H X1 = X2 to first order in all small parameters. An alternative limit is examined later. The leading-order overpotential and temperature problems are then given by
ψ∼ −κγX
2,0, τ∼ −(sτ+ψ)∆γX2,0. (4.5) This immediately yields the overpotential profile
ψ−ψ∼ψ0−ψ=ψ1≡κH√γtanh(√γl)(l−z)−κH
cosh(√γ (z−l))−1
cosh(√γl) , (4.6) whereψ−ψ O(1). Figure 5 demonstrates that there is excellent agreement between this solution and the numerically computed solution of (2.17). Note further thatψis monotonically decreasing in z, as can be seen by integrating the first of (4.5), and has a maximum value
ψ0(0)=ψ+κHl√γtanh(√γl)−κH
cosh(√γl)−1
cosh(√γl) . (4.7)
At this point in the analysis, two distinguished limits exist, based on the size of∆γ max{s,ψ}¯ . ∆γ is likely to be small, but we permit∆γmax{s,ψ}¯ andκγ to be O(1)as D2approaches its upper bound in Table 1. This corresponds to weak diffusion limitation.
at University of Southampton on May 26, 2010
http://imamat.oxfordjournals.org
FIG. 5. (Left) A comparison of the numerically computed profiles ofψ(solid lines), according to (2.17) and (2.17f), and the
first-order asymptotic solutionψ+ψ1given by (4.6) (dashed lines). In these calculations, h=125η=1.7×10⁻³,κ=3,γ=2
and∆=1/40. (Right) A comparison of the numerically computed profiles ofτ(solid lines), according to (2.17) and (2.17f), and
the first-order asymptotic solution given by (4.8) (dashed lines). In these calculations,κ=1/40,γ =1, h=1.7×10−3=125η,
ψ=3 and∆is varied.
Strong diffusion limitation:
If∆γmax{s,ψ} ¯ 1, the rate of O2diffusion to the reaction sites is slow and variations in temperature from unity are weak, i.e.τ0=1.
Assuming that overpotential variations are small,κγ 1, by substituting (4.6) into (4.5), we obtain
τ ∼1+∆(s+ψ)(H−X2,0). (4.8)
Figure 5 compares (4.8) to the numerically computed solution of (2.17).
Limit of weak diffusion limitation:
Again assuming thatκγ 1, if∆γmax{s, ψ} 1, we recover the solutions (4.6). If both κγ =O(1)and∆γs =O(1), variations inψ andτ (fromψand unity) are appreciable at leading order. Suppose this to be the case, and for generality, s/ψ=O(1), then we have the following linear problem forτ0:
τ0+∆γ (sτ0+ψ0)X2,0=0, τ0(0)−1=τ0(l)=0, (4.9) whereψ0 is given by (4.6). An explicit solution is not possible to find but we can derive useful upper and lower bounds. Using the functionw(z)defined in (3.10), the corresponding restriction (3.11) on the size of l and the definition of X2,0, it is a relatively simple matter to demonstrate that solutions are bounded below by unity and monotonically increasing in z. We can again employ the functionwto find sharper upper and lower solutions to (4.9), τ andτ, respectively (lower solutions are defined by reversed inequalities in (3.13), withτ replaced byτ0):
τ(z)=1+G(1+ψ0(0)/s)
2−Gl2 z(2l−z), τ(z)=1+
G(1+ψ/s)
2 cosh(√γl)z(2l−z), (4.10)
at University of Southampton on May 26, 2010
http://imamat.oxfordjournals.org
FIG. 6. A comparison of the numerically computed profiles ofτ(solid lines), according to (2.17), and the upper solutions
(dashed-dotted lines) and lower solutions (dashed lines) given by (4.10). In these calculations, h=125η=1.7×10⁻³,κ=1/20,γ=1
and∆=1/10.
where G =∆γH s. Note thatτ is the same asτmdefined in (3.15) andτ is an improvement on the previously computedτ =1. Importantly, this gives the following range of values that τ can assume at z=l:
τmin
0 ≡1+
Gl2 2 cosh(√γl)
1+ψ
s
τ0(l)τ0max≡1+ Gl2 2−Gl2
1+ψ0(0) s
. (4.11)
Figure 6 demonstrates that (4.10) are indeed upper and lower bounds to the solution of the temperature problem in (2.17). The lower bound actually approximates the solution with good accuracy.
(2) h=O(η)(slow exchange):
In the preceding analysis, we assumed that hη, yielding solutions of the form (4.2). We now examine the behaviour of the system under the alternative assumption that h=O(η),η→0, in which case the convective exchange of O2between the two phases is relatively slow. Considering expansions again of the form (4.1), we obtain, at leading order in the other parameters,
X2,0=γX2,0, X1,0=h(H X1,0−X2,0), (4.12) whereh=h/η=O(1). These equations are subject to the boundary conditions (2.17f) and the solution is
X1,0=
1 H +Γ
X−ΓX2,0, X2,0=H
cosh(√γ (z−l))
cosh(√γl) , (4.13) whereΓ andX are defined as
Γ = h
γ−hH and X =H
cosh(√hH(l−z))
cosh(√hHl) . (4.14)
at University of Southampton on May 26, 2010
http://imamat.oxfordjournals.org
[image:19.536.163.362.64.233.2]The current density is still given at leading order by (4.4). Examining solution (4.13) and (4.14), we see that ash → ∞, H X1,0 ∼ X2,0−γX2,0/(hH), which recovers the solution (4.3). In the alternative limit h → 0, the solution (4.13) and (4.14) satisfies X1,0 = 1+O(h), so the agreement with the exact solution should again be good.
If∆γmax{s, ψ} =O(1), the bounds (4.10) and (4.11) continue to hold. The mass-exchange term on the right-hand side of (2.17a) will introduce a term of order h 1. A simple computation then reveals that corrections to the reaction rate, γX2eψ/τ/(γ +eψ/τ), are of the order of the maximum ofγh,γ2e−ψ0/τ0,γ (ψ−ψ
0)2andγ (τ−τ0)2. Given our assumptions onγ, the most likely candidate for corrections isγh. We therefore expand as follows:
X2∼X2,0+h X2,1, X1∼X1,0+h X1,1, (4.15) retaining terms of the orderγh for generality. This yields the following first-order problem:
X2,1−γX2,1= γ
hΓ (X2,0−X), X1,1=h(H X1,1−X2,1),
(4.16)
subject to the homogeneous form of (2.17f). While these equations have exact solutions, we can gain the information we need simply from maximum principles. The right-hand side of the first equation is positive (negative) if X < X2,0(X > X2,0), which is ensured if X(l) < X2,0(l) (X(l) > X2,0(l)), i.e.hH > γ (hH < γ). From the generalized maximum principle and Hopf’s lemma, X2,1is then negative (positive). GivenhH andγ, we can go further. Suppose that X < X2,0and max(X2,0−X)=M (min(X2,0−X)=0), then X2,1is bounded below by solutions to
X2,1−γX2,1= γ
hΓM, X2,1(0)=X
2,1(l)=0.
Though we can find an explicit solution, a bound of the form az(2l −z)is easier to interpret. Thus, we obtain the following:
− γ Γ /h
2+γl2M z(2l−z)X2,10 (hH > γ). (4.17) On the other hand, if max(X2,0−X)=0 and min(X2,0−X)= −m<0, then X2,1is bounded as follows:
0X2,1 γ Γ
2hmz(2l−z) (hH < γ). (4.18) Expanding in the form I ∼I0+I1, where I0is given by (4.4), the correction satisfies
0I1 5 12γ Γml
3η (hH < γ), −5γ Γ /6 2+γl2Ml
3ηI
10 (hH> γ). (4.19) Thus, if the rate of O2 transfer from the phase 2 bulk to the agglomerate surfaces, expressed throughγ, is small in relation to the rate of mass transfer to phase 2 from phase 1, expressed throughhH , the current density is decreased at first order. The converse is also true.
at University of Southampton on May 26, 2010
http://imamat.oxfordjournals.org
4.2 Moderate dependence on O2concentration:γ =O(eψ)
We move now to the regime in whichγis comparable with eψ, which is certainly the case ifγ =O(eψ). As with the limit of Section 4.1, we delineate between relatively large and relatively small values of h, beginning with instantaneous mass exchange.
(1) h>O(η)(fast exchange):
Strong diffusion limitation:
Considering expansions of the form (4.1), for weak temperature and overpotential variations, the solution for O2concentration at leading order is
X2,0=H X1,0=H
cosh(√γ (z−l))
cosh(√γl) , γ ≡γe
ψ/(γ +eψ), (4.20)
which are the same as the solutions (4.3) of Section 4.1 withγreplaced byγ(as before, we shall assume thatηis small enough that H X1 = X2to first order in all small parameters). The current density is given at leading order by
I ∼I0=Hγtanh(γl), Ilim∼I. (4.21)
Limit of weak diffusion limitation:
We now assume that only variations in overpotential are small, i.e.κ 1, and therefore ψ∼ψ. Solutions are then given by the problem
X2,0=γ e
ψ/τ
γ+eψ/τX2,0, X1,0=X2,0 (4.22) to be solved subject to the boundary conditions (2.17f). X2,0cannot attain a nonnegative maximum and a nonpositive minimum in(0,l), by application of the generalized maximum principle. We can use this fact to determine that 0 X2,0 H . For strong temperature variations, withψ∼ψ, the solution satisfies
τ0−G(τ+ψ/s), τ0(0)−1=τ0(l)=0, (4.23) having used the upper bound on X2,0 and the lower bound of unity forτ0 (the function eψ/τ/(γ +eψ/τ)is a decreasing function of τ). Here, G = ∆γH s, in analogy with the previously defined G. Employing the techniques described previously, we can derive the following upper bound:
τ0τ(z)=1+Az(2l−z)τ ≡1+Al2, A≡
1+ψ/s
2−Gl2G. (4.24) We now use this bound to derive sharper estimates for X2,0andτ. Firstly, from (4.22), the monotone decreasing property of eψ/τ/(γ+eψ/τ)inτ and the definition (4.24) ofτ, we can show that X2,0is bounded above and below by solutions to the equations
X2,0=γX2,0, X2,0=γX2,0, (4.25)
at University of Southampton on May 26, 2010
http://imamat.oxfordjournals.org
respectively, which have solutions, subject to (2.17f),
X2,0=H
cosh(√γ (z−l))
cosh(√γl) , X2,0=H
cosh(√γ (z−l))
cosh(√γl) , (4.26) whereγ = γeψ/τ/(γ +eψ/τ)and the lower bound corresponds to the solution (4.20). Thus, for weak overpotential variations, increasing temperature variations leads to increasing values of X2. A lower bound forτ is found similarly:
τ0τ(z)=1+ 1 2
1+ψ
s
Gz(2l−z), (4.27)
where G =∆γH s/cosh(√γl). We use this to bound the current density. Firstly, using the properties of the reaction rate and the lower bound for X2,0, we obtain a lower bound
Hγtanh(γl)/γ I0Hγtanh(
γl)/γ , yielding I0Hγtanh(γl)/γ , (4.28)
by the definition ofγ andγ.
In a similar fashion, if we assume thatτ ∼1 andκ =O(1), then at leading order, −ψ
0 =κX2,0=
κγeψ0
γ+eψ0X2,0 with 1−
ψ0(l) ψ =1−
X2,0(0)
H =ψ
0(0)=X2,0(l)=0
(4.29) and X1,0=X2,0. An analysis similar to that above yields
Hcosh(
√γm(z−l))
cosh(√γml) X2,0H
cosh(√γ (z−l))
cosh(√γl) , ψ ψ0ψ+ 1
2Hκγ (l2−z2)
cosh(√γl) , ψmax≡ψ+
1 2
Hκγl2
cosh(√γl), γm =
γeψmax
γ+eψmax, (4.30)
yielding the following estimates for the current density:
Hγtanh(√γml)/√γm I0Hγmtanh(γl)/γ . (4.31) (2) h=O(η)(slow exchange):
Strong diffusion limitation:
For h =O(η),η→ 0 and weak overpotential variations, the leading-order problem for O2 concentration is
X2,0=γ e
ψ/τ
γ+eψ/τX2,0, X
1,0=h(H X1,0−X2,0), (4.32) subject to the boundary conditions (2.17f), and whereh=h/η=O(1), as before. For weak temperature variations, the solution is given by
X2,0=H
cosh(√γ (z−l))
cosh(√γl) , X1,0=
1 H +Γ
∗X−Γ∗X
2,0, (4.33)
at University of Southampton on May 26, 2010
http://imamat.oxfordjournals.org
where
Γ∗= h
γ−hH and X=H
cosh(√hH(l−z))
cosh(√hHl) , (4.34)
which is the same as (4.13) and (4.14) withγ replaced byγ. Furthermore, the current density is still given by (4.21). Letting
ψ∼ψ+ψ1, τ ∼1+τ1, the first-order problem for temperature is
τ1= −(s+ψ)∆γX2,0, τ1(0)=τ(l)=0; (4.35) the solution to which is
τ1=(s+ψ)∆(H−X2,0). (4.36)
By analogy with (4.6), the overpotential correction is given by
ψ1=κHγtanh(γl)(l−z)−κH
cosh(√γ (z−l))−1
cosh(√γl) , (4.37) which has a maximum value
ψ1(0)=κHlγtanh(γl)−κH
cosh(√γl)−1
cosh(√γl) . (4.38)
4.3 Tafel limit:γ eψ
Ifγ eψ, the reaction rate approaches the Tafel law, introducing extreme sensitivity to changes in overpotential and temperature. This is the form used in the homogeneous models discussed in Section 1.
1) h>O(η)(fast exchange):
Strong diffusion limitation:
With expansions in the form (4.1), the leading-order problem is defined by the following:
X2,0=X2,0exp(ψ0/τ0), H X1,0=X2,0, (4.39) subject to the boundary conditions (2.17f). With weak overpotential and temperature varia-tions,κ1 and∆max{s, ψ} 1, the solution is
X2,0=H
cosh((z−l)eψ/2)
cosh(l eψ/2) . (4.40)
The current density at leading order is given by
I ∼I0≡H eψ/2tanh(l eψ/2). (4.41)
at University of Southampton on May 26, 2010
http://imamat.oxfordjournals.org
Definingψ∼ψ+ψ1andτ ∼1+τ1,variations in overpotential and temperature now satisfy ψ1= −κeψX2,0, τ1= −(s+ψ)∆eψX2,0, ψ1(l)=ψ1(0)=τ1(0)=τ1(l)=0,
(4.42)
with the solution
ψ1=κH eψ/2tanh(l eψ/2)(l−z)−κ
X2,0− H cosh(l eψ/2)
,
τ1=∆(s+ψ)(H−X2,0).
(4.43)
Note that these solutions are the same as (4.6) and (4.8) ifγis replaced with eψ.
Limit of weak diffusion limitation:
For only weak temperature variations, the leading-order problem becomes
X2,0=X2,0eψ0, ψ0= −κX2,0eψ0, H X1,0=X2,0, τ0=1, (4.44) subject to (2.17f). From the generalized maximum principle, we obtain the bounds 0 X2,0
H ,ψ0ψandψ0 (if solutions exist). The following problem defines an upper bound for the problem inψ0:
ψu= −κH eψu, ψu(l)−ψ=0, ψu(0)=0. (4.45) The theory of monotone iteration guarantees that a solution to the problem inψ0exists if ψucan be constructed. The proof yields both a bound and an existence (see Theorem 2.3.1 in Sattinger, 1973). Problem (4.45) has no solution forκH eψ > λ1and has two solutions for κH eψ < λ1 (one solution forκH eψ = λ1), where λ1 is the first eigenvalue of the problemψ+λψ =0, ψ(0)=0, ψ(l)=0. Let us look for an upper solution in the form ψu=ψ+c(l2−z2)/2. A sufficient condition on c is
c ecl2/2κH eψ, (4.46)
yielding the upper bound
ψ0ψ+cl2. (4.47)
2) h=O(η)(slow exchange):
With h=O(η),η→0, the leading-order problem for the O2concentrations is X2,0=eψ0/τX
2,0, X1,0=h(H X1,0−X2,0), (4.48) subject to the boundary conditions (2.17f), and whereh =h/η =O(1). For weak temperature and overpotential variations, the solution is given by (4.40) and
X1,0=
1 H +Γ∗
X−Γ∗X2,0, Γ∗= h
eψ−hH and X =H
cosh(√hH(l−z))
cosh(√hHl) , (4.49) which is the same as (4.33) and (4.34) with eψ in the place ofγ. Therefore, the current density is still given at leading order by (4.41).
at University of Southampton on May 26, 2010
http://imamat.oxfordjournals.org
FIG. 7. Typical profiles of X1, X2,τandψ, according to (2.17). Profiles correspond to increasingψin the range 0ψ 4 in
increments of 1. For these calculations, h=125η=1.7×10⁻³,γ =2.5,∆=1/30 andκ=1/2.
5. Numerical results
In Fig. 7, we show typical profiles of O2concentration, overpotential and temperature asψis increased. Here, the variations in overpotential and temperature though not O(1)are relatively large and are typical of what is seen in laboratory experiments. Figure 8 shows the polarization curves for increasing values of γ. The limiting current density is reached asψ → ∞; a consequence of the diffusion limitation on O2, which is modelled through the reaction rate in (2.17). Figure 8 also shows a comparison of the numerically computed dimensionless current density with the composite of the theoretical results (4.4) and (4.21), with eψ = 3.32 and γ O(eψ). For small temperature and overpotential variations, the agreement is excellent, and even for relatively large variations, the errors were found to be small. In the limit ofγ → ∞, although not demonstrated in this figure, the agreement was exact.
6. Discussion and summary
Modelling of the CCL is far from an easy task, particularly given the difficulty in representing the structure and, moreover, incomplete understanding of some of the physical phenomena. A number of
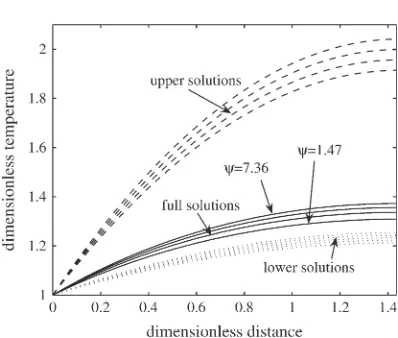
at University of Southampton on May 26, 2010
http://imamat.oxfordjournals.org