University of Southern Queensland
Faculty of Health, Engineering and Sciences
Evaluation of the performance of web-based GNSS post-processing
systems
A dissertation submitted by
Mr Benjamin L. Cleaver
In fulfilment of the requirements of
Course ENG4111 and ENG4112- Research Project
Towards the degree of
Bachelor of Spatial Science (Surveying)
0050086950-Benjamin Cleaver – Project Dissertation – University of Southern Queensland 2013 2
Abstract
The use of existing survey control infrastructure is paramount to the work carried out by surveyors when undertaking many projects. Due to the limited availability of existing survey control
infrastructure throughout regional Australia; surveyors require a means to obtain coordinates in the relevant national datum. The method routinely used by surveyors in Australia involves
recording GNSS observations and submitting these observations to a free online service GNSS post-processing service run by Geoscience Australia- AUSPOS.
The accuracy of AUSPOS has been investigated through a limited number of research papers. This project investigates the performance of AUSPOS and other on-line GNSS post-processing services that are available internationally: CSRS-PPP, SCOUT, AUTO GIPSY and OPUS. The performance of the services is investigated in two different respects. Firstly a comparison of the on-line post-processing services by analysis of the results obtained from each service from identical input data. Secondly, the post processing services are also evaluated in terms of the positional accuracy expected when using any of the on-line GPS services, in relation to existing survey control infrastructure.
It was found that the differences between the services AUSPOS, SCOUT and CSRS-PPP are negligible when compared to the residual difference to a known survey control mark. Trends in the
consistency of the processed coordinates showed that baseline processing services were marginally more accurate than the PPP processing services, although the inconsistent results of GIPSY may have contributed to this trend. It was found that the accuracy of the processed solutions of each of the services did not significantly improve with observations longer than 4 hours. The accuracy of coordinates in relation to existing control marks is found to be in the order of 2-3cm in the horizontal component and 100-150mm in the vertical component.
0050086950-Benjamin Cleaver – Project Dissertation – University of Southern Queensland 2013 3
Faculty of Health, Engineering and Sciences
ENG4111/ENG4112 Research Project
Limitations of Use
The Council of the University of Southern Queensland, its Faculty of Health, Engineering & Sciences, and the staff of the University of Southern Queensland, do not accept any responsibility for the truth, accuracy or completeness of material contained within or associated with this dissertation.
Persons using all or any part of this material do so at their own risk, and not at the risk of the Council of the University of Southern Queensland, its Faculty of Health, Engineering & Sciences or the staff of the University of Southern Queensland.
This dissertation reports an educational exercise and has no purpose or validity beyond this exercise. The sole purpose of the course pair entitled “Research Project” is to contribute to the overall education within the student’s chosen degree program. This document, the associated hardware, software, drawings, and other material set out in the associated appendices should not be used for any other purpose: if they are so used, it is entirely at the risk of the user.
0050086950-Benjamin Cleaver – Project Dissertation – University of Southern Queensland 2013 4
Certification of Dissertation
I certify that the ideas, designs and experimental work, results, analyses and conclusions set out in this dissertation are entirely my own effort, except where otherwise indicated and acknowledged.
I further certify that the work is original and has not been previously submitted for assessment in any other course or institution, except where specifically stated.
Benjamin L. Cleaver 0050086950
________________________________ Signature
0050086950-Benjamin Cleaver – Project Dissertation – University of Southern Queensland 2013 5
Acknowledgements
The author wishes to thank and acknowledge the following people for their time and assistance to make this project possible:
- Dr Zhenyu Zhang (project supervisor), Faculty of Health Engineering and Sciences, USQ; - Landmark Surveys, specifically Philip Allpress;
0050086950-Benjamin Cleaver – Project Dissertation – University of Southern Queensland 2013 6
List of Figures
Figure 2.1 A Traditional Trig Station
Figure 2.2 A differential GPS baseline
Figure 3.1 Map of survey control marks
Figure 3.2 Trimble R7 Receiver and Zephyr Geodetic Antennae
Figure 3.3 GNSS observations at PM117355
Figure 3.4 RINEX conversion software
Figure 4.1 Horizontal residual difference of AUSPOS over time
Figure 4.2 Vertical residual difference of AUSPOS over time
Figure 4.3 Horizontal residual difference of SCOUT over time
Figure 4.4 Vertical residual difference of SCOUT over time
Figure 4.5 Horizontal residual difference of GIPSY over time
Figure 4.6 Vertical residual difference of GIPSY over time
Figure 4.7 Horizontal residual difference of CSRS-PPP over time
Figure 4.8 Vertical residual difference of CSRS-PPP over time
Figure 4.9 Mean easting difference of all services over time
Figure 4.10 Mean northing difference of all services over time
Figure 4.11 Mean height difference of all services over time
Figure 5.1 Standard deviation comparison
Figure 5.2 Easting and northing mean residual comparison
0050086950-Benjamin Cleaver – Project Dissertation – University of Southern Queensland 2013 7
List of Tables
Table 2.1 Comparison of the options available for the current free on-line post processing system
Table 3.1 Survey control mark details
Table 3.2 Published coordinates vs converted coordinates
Table 4.1 BL234 and LN9 processed coordinates
Table 4.2 PR90 and PM117355 processed coordinates
Table 4.3 BL234 Residuals
Table 4.4 LN9 Residuals
Table 4.5 PR90 Residuals
Table 4.6 PR90 Residuals
Table 5.1 One hour statistics-All services
Table 5.2 Two hour statistics-All services
Table 5.3 Four hour statistics-All services
Table 5.4 Six hour statistics-All services
Table 5.5 Eight hour statistics-All services
Table 5.6 Twelve hour statistics-All services
Table 5.7 Twenty-Four hour statistics-All services
0050086950-Benjamin Cleaver – Project Dissertation – University of Southern Queensland 2013 8
Glossary
ACTPLA- ACT Planning and Land Authority
ASCII- American Standard Code for Information Interchange
AUSPOS- Online GNSS post-processing service run by Geoscience Australia
CSRS-PPP- Online GNSS post-processing service run by the Natural Resources Canada
DGPS- Differential GPS
FTP- File Transfer Protocol
GDA94- Geocentric Datum of Australia 1994
GIPSY- Online GNSS post-processing service run by the Near Earth Tracking Applications and Systems groups
GNSS- Global Navigation Satellite System
GPS- Global Position System serviced by the US government
ICSM- Intergovernmental committee on Surveying and Mapping
IGS- International GNSS Service
ITRF- International Terrestrial Reference Frame
LPI- Land and Property Information (NSW)
MGA94- Map Grid of Australia 1994
OPUS- Online GNSS post-processing service run by the National Oceanic and Atmospheric Administration (USA)
PPP- Precise Point Positioning
SCIMS- Survey Control Information Management System (NSW)
SCOUT- Online GNSS post-processing service run by the Scripps Orbit and Permanent Array Centre
RESIDUAL- The numerical difference between a known value and another value
0050086950-Benjamin Cleaver – Project Dissertation – University of Southern Queensland 2013 9
Contents
Abstract ... 2
Limitations of Use ... 3
Certification of Dissertation ... 4
Acknowledgements ... 5
List of Figures ... 6
List of Tables ... 7
Glossary... 8
Chapter 1. Introduction ... 12
1.1 Project Aim ... 12
1.2 Project objectives ... 13
1.3 Justification ... 14
Chapter 2. Literature Review ... 15
2.1 Introduction ... 15
2.2 Geodetic Surveying ... 15
2.3 History of Geodetic Surveying ... 15
2.4 GNSS (Global Navigation Satellite System) ... 16
2.5 International Terrestrial Reference Frame (ITRF) ... 17
2.6 Related Governing Bodies... 18
2.6.1 Intergovernmental Committee on Surveying and Mapping ... 18
2.6.2 Geoscience Australia ... 18
2.6.3 International GNSS Service (IGS) ... 18
2.7 Free Online Post-Processing Systems ... 19
2.7.1 Overview ... 19
2.7.2 AUSPOS ... 19
2.7.3 CSRS-PPP ... 19
2.7.4 SCOUT ... 20
2.7.5 GIPSY ... 20
2.7.6 OPUS ... 20
2.7.7 SERVICE COMPARISON ... 21
2.8 Permanent Survey Marks ... 22
2.9 Previous investigations ... 22
0050086950-Benjamin Cleaver – Project Dissertation – University of Southern Queensland 2013 10
Chapter 3. Methodology ... 24
3.1 Introduction ... 24
3.2 Scope of work ... 24
3.3 Risk Assessment ... 25
3.4 Ethical responsibility ... 25
3.5 Selection of Appropriate Control Marks ... 25
3.6 Equipment ... 27
3.7 GNSS Observations ... 27
3.8 Reduction of Observations ... 29
3.8.1 RINEX conversion ... 29
3.8.2 RINEX modification ... 29
3.8.3 Submission to Processing Services... 30
3.8.4 Collection of Processing Results ... 31
3.9 Conversion of coordinates ... 32
3.10 Conclusion ... 33
Chapter 4. Results ... 34
4.1 Introduction ... 34
4.2 Residual ... 34
4.2.1 Processed coordinates ... 35
4.2.2 BL234 ... 37
4.2.3 LN9 ... 38
4.2.4 PR90 ... 39
4.2.5 PM117355 ... 40
4.2.6 Residual Summary ... 41
4.3 Individual service results... 41
4.3.1 AUSPOS ... 42
4.3.2 SCOUT ... 43
4.3.3 GIPSY ... 44
4.3.4 CSRS-PPP ... 45
4.4 Service comparison ... 46
4.5 Observation length ... 47
Chapter 5. Analysis and Discussion ... 48
5.1 Introduction ... 48
0050086950-Benjamin Cleaver – Project Dissertation – University of Southern Queensland 2013 11
5.2.1 One hour observation length ... 49
5.2.2 Two hour observation length ... 50
5.2.3 Four hour observation length ... 51
5.2.4 Six hour observation length ... 51
5.2.5 Eight hour observation length ... 52
5.2.5 Twelve hour observation length ... 52
5.2.6 Twenty-Four hour observation length ... 53
5.2.7 Service Comparisons ... 53
5.3 Discussion ... 56
Chapter 6. Conclusion ... 57
6.1 Reccomendations ... 57
6.2 Conclusion ... 57
Chapter 7. References ... 58
Appendices ... 60
Appendix A Project specification ... 60
Appendix B Survey control mark details ... 61
Appendix C Trimble R7 receiver details ... 64
Appendix D Trimble Zephyr Geodetic details ... 66
Appendix E RINEX example ... 67
0050086950-Benjamin Cleaver – Project Dissertation – University of Southern Queensland 2013 12
Chapter 1.
Introduction
1.1
Project Aim
The aim of this project is to evaluate the performance of on-line GPS post processing services AUSPOS, CSRS-PPP, SCOUT, AUTO GIPSY and OPUS. The performance of the services will be tested in two different respects. The on-line services will be tested and compared to each other by analysis of the results obtained from each service from identical input data. The post processing services will also be evaluated in terms of the positional accuracy expected when using any of the on-line GPS services.
Research will be conducted into the traditional methods of geodetic surveying, the GPS satellite system, coordinate reference frames, existing survey control marks, the governing bodies related to geodetic infrastructure and the existing free on-line GPS post processing systems.
This report is not designed to improve the methods of GNSS observations. The aim of the report is to evaluate statistically the results that can be obtained using prescribed observation techniques available to the ordinary surveyor.
0050086950-Benjamin Cleaver – Project Dissertation – University of Southern Queensland 2013 13
1.2
Project objectives
The objectives of this project are:
1. Research geodetic surveying principles and GNSS (Global Navigation Satellite Systems).
This will provide the background for the need for geodetic surveying and justify the provision and use of free on line post processing systems for a surveying practice.
2. Research the background information relating to on-line GPS post processing for AUSPOS, CSRS-PPP, SCOUT, AUTO GIPSY and OPUS.
The five current on line GPS post processing services will be researched to justify the comparability of the results obtained from them throughout the project.
3. Research field procedures, equipment and specification, models and software used to post process GNSS data.
Field procedures and equipment must be of a standard that is available to the practicing surveyor to allow this report to contribute a robust outcome.
4. Research survey control specifications, specifically class and order.
In order to compare the results obtained from the various on-line post processing systems measurements must be made against the most accurate available marks.
5. Design a field measurement programme to collect appropriate GNSS data.
A field measurement programme must be designed to suit the timeframe available, and to provide sufficient data for analysis.
6. Analyse post processed data statistically
This is the main focus of the paper, and will allow conclusions to be drawn from the results.
7. Critically evaluate the performance of the on-line GPS post processing services including any recommendations for field procedures or limits on use.
0050086950-Benjamin Cleaver – Project Dissertation – University of Southern Queensland 2013 14
1.3
Justification
Surveyors rely on coordinated survey control marks for the majority of work undertaken. In urban areas there is an abundance of survey control of varying order and class to suit the needs of a survey. It is apparent that when working on regional projects there may only be a limited number of survey control marks in the vicinity, or even none at all. It is evident that this occurs in remote areas where there is yet to be development and the lack of a need to carry out a geodetic survey to install survey control marks.
Traditionally surveyors would have an arduous task of completing a geodetic survey using a theodolite, differential levelling and substantial calculations. With the evolution of GNSS it has become possible to use GNSS static observation techniques to coordinate survey control marks. GNSS static observations must be post-processed to provide accurate coordinates. AUSPOS is a free online service facilitated by Geoscience Australia (formerly AUSLIG-Australian Surveying and Land Information Group) that will process the data for the user and provide a report detailing the coordinates and other relevant information. There are currently 4 other free on-line services around the world that are accessible: CSRS-PPP, SCOUT, AUTO GIPSY and OPUS.
The free on-line post-processing services are efficient and economical for the user. The concern for the user is the reliability of the results. The reliability has had limited testing by Koschel in 2009, where he states that further areas of research are ‘…longer observation periods, different IGS reference stations and also different GPS receivers to obtain GPS data.’
0050086950-Benjamin Cleaver – Project Dissertation – University of Southern Queensland 2013 15
Chapter 2.
Literature Review
2.1
Introduction
To establish an understanding of what this dissertation will achieve, a review of the information of the different components of the research must be undertaken. The following research is the grounding for the methodology and analysis of the on-line GNSS post processing systems.
2.2
Geodetic Surveying
Geodesy is defined by Featherstone (2011) ‘as the theory and measurement of the size, shape and gravity field of the Earth’. Geodesy is also concerned with the variations over time of these physical attributes of the earth. Accurate measurement of the earth is important as it describes features of the earth relative to one another. The role of the surveyor is to ‘provide a framework for the control of National Surveys’ (SVY3107). The control points are described by lengths and azimuths between them, and also in terms of co-ordinates. The control points are used for topographic, engineering, cadastral and other surveys (Koschel 2009) Local terrestrial measurements can be considered in a local reference coordinate system; however the size and nature of the earth must be studied to describe the relationship between local coordinate systems and geodetic reference systems (SVY3107). This dissertation deals with the accuracy with which a point can be determined in relation to a geodetic and local coordinate reference frame using static GNSS surveying techniques.
2.3
History of Geodetic Surveying
The early methods of coordinating precise horizontal control was by constructing a network of geodetic survey marks located on inter-visible hills with measurements of the distances and angles between the marks observed (Steed et al 2005). The precise coordinates of these marks were determined using triangulation and trigonometric calculations.
Figure 2.1. A Traditional Trig Station
0050086950-Benjamin Cleaver – Project Dissertation – University of Southern Queensland 2013 16
2.4
GNSS (Global Navigation Satellite System)
In the 1970’s the United States Department of Defence developed a global navigation system called the Global Positioning System (GPS). The GPS system provides a three dimensional position to a user with the appropriate equipment via a constellation of satellites. The constellation of satellites consist of 24 satellites that orbit the earth is such a way that there are 4 satellites above the horizon at any point in time anywhere on the earth. GPS can be used in all weather and can be accessed worldwide. Other GNSS systems are becoming available worldwide such as the Russian GLONASS and China’s Compass however these systems are not currently available in the on-line post processing solutions; and as such are not regarded in this report.
GNSS positioning is achieved by measuring the range or distance from four or more satellites. A unique position can be computed by a GNSS receiver by receiving specially coded signals that are emitted from the GNSS satellites. The coded signals are radio waves; the amount of time the radio wave takes to reach the GNSS receiver is determined and in turn the distance is calculated. Once the distance has been determined the receiver can combine the results from measurements to four or more satellites to calculate a unique position. This process is the basis of GNSS positioning for limited accuracy.
There are two different methods for post processing: differential GNSS and Precise Point Positioning (PPP). Differential GNSS requires a GNSS receiver that is known as a base station set up over a known location. The base station receives satellite information and compares the known location to the location calculated from the satellite observation. The corrections can be applied to another receiver receiving the same satellites in real time, or can be done by post processing the data.
Figure 2.2. A differential GPS baseline
0050086950-Benjamin Cleaver – Project Dissertation – University of Southern Queensland 2013 17
The traditional technique of geodetic surveying using GNSS involves installing a GNSS receiver on a mark of known coordinates and a baseline is formed by setting up a second receiver on an unknown mark. (Tsakiri 2008) Observations are taken simultaneously at each site. The accuracy of a geodetic control can be increased by connecting to numerous known marks and creating a geodetic network that includes a large number of baselines. In this situation the user designs the network and is also responsible for the processing of the GPS data.
This approach has its limitations for the average surveyor. Firstly the task of installing precise control in remote areas is costly in terms of equipment, time and personnel (Featherstone 2008) Also to consider is the cost of the software packages that are required for the post processing of observations. The development of Continually Operating Reference Stations (CORS) has allowed access to raw GNSS data that is available for free. This allowed the user to make observations with a single GNSS receiver and process the data using data from the CORS. This still required the user to have access a scientific GNSS processing software package.
2.5
International Terrestrial Reference Frame (ITRF)
The ITRF is described by Natural Resources Canada 2004 as ‘The models that define the geocentric reference system along with the station coordinates and velocities used to realise the ITRF
currently give the best representation of the solid Earth and it’s time variations on a global scale’. The ITRF is produced by the International Earth Rotation Service (IERS). The IERS receive
0050086950-Benjamin Cleaver – Project Dissertation – University of Southern Queensland 2013 18
2.6
Related Governing Bodies
2.6.1 Intergovernmental Committee on Surveying and Mapping
The Intergovernmental Committee on Surveying and Mapping (ICSM) is made up of representatives from all the Australian States, Territories, the Commonwealth and New Zealand. The representatives are responsible for surveying and mapping. Importantly the ICSM provide leadership in surveying and mapping through, supporting the development and implementation of national and international standards for surveying, mapping and charting (ICSM 2013). According to ICSM its core function is to coordinate and promote the development and maintenance of key national spatial data. (ICSM 2013)
The ICSM provide a publication outlining the standards, specifications and practices for control surveys. Standards and Practices for Control Surveys (SP1) version 1.7 was released in Sept 2007. The document is subdivided into two main sections, the first being the standards of accuracy which define the quality control standards; and the second being the recommended survey and reduction practices. This document will be used for the purpose of this dissertation as a manual for reference with respect to control mark accuracy and best practice.
2.6.2 Geoscience Australia
Geoscience Australia (GA) is run by the Australian Government. GA monitors the horizontal and vertical motion of the Australian landmass and contributes data to the global scientific effort to monitor the Earth's changing shape and motion. This data provides a uniform, accurate basis for all spatial data in Australia and its offshore territories. (Geoscience Australia 2013). AUSPOS is run by Geoscience Australia
2.6.3 International GNSS Service (IGS)
0050086950-Benjamin Cleaver – Project Dissertation – University of Southern Queensland 2013 19
2.7
Free Online Post-Processing Systems
2.7.1 Overview
Post processing of GNSS observations is provided by some organisations around the world using an internet platform free of charge. Each of these organisations offer a service that allows the user to submit Receiver Independent Exchange Format (RINEX) files and subsequently receive a report detailing the position of the receiver that was used to record the observations. Each of the services that are offered differs, and is perused in the following sections.
2.7.2 AUSPOS
AUSPOS is a free online GPS data processing service that is provided by Geoscience Australia (formerly AUSLIG). AUSPOS was launched in November 2000 to meet the needs of various stakeholders that were increasingly requiring a post processing service 24 hours a day 7 days a week. AUSPOS was designed as an easy to use web page interface with the capability of processing dual frequency geodetic GPS data (Dawson et al 2001). Intended applications of AUSPOS include:
- DGPS reference station positioning - Remote GNSS station positioning - Ultra-long baseline positioning - GNSS connections to IGS stations - High accuracy positioning
- GNSS network quality control
AUSPOS provides coordinates in two coordinate systems The Geocentric Datum of Australia 1994 (GDA94), and the International Terrestrial Reference Frame (ITRF). The software used in the computation of the coordinates is the MicroCosm software.
2.7.3 CSRS-PPP
0050086950-Benjamin Cleaver – Project Dissertation – University of Southern Queensland 2013 20
2.7.4 SCOUT
SCOUT or the Scripps Coordinate Update Tool has been developed and is run by the Scripps Orbit and Permanent Array Centre (SOPAC). SOPAC is a part of the University of California’s (USA) Institute of Geophysics and Planetary Physics of which their main role ‘… is to support high precision geodetic and geophysical measurements using the Global Positioning System’
(SOPAC 2013). SCOUT is available via the SOPAC website http://sopac.ucsd.edu.
2.7.5 GIPSY
The GNSS Inferred Positioning System (GIPSY) has been developed by the Jet Propulsion Laboratory USA and is maintained by the Near Earth Tracking Applications and Systems groups. APPS GIPSY has replaced AUTO GIPSY. GIPSY is a single high-level user interface that supports the majority of precise positioning applications. APPS uses JPL's GIPSY-OASIS software (Zumberge et al 1997), Version 5. It is a PPP based system which processes GPS phase and pseudo range measurement in RINEX format. APPS also includes GLONASS satellites in the solution as well as GPS satellites. APPS can be accessed via the JPL website http://apps.gdgps.net/apps_file_upload.php.
2.7.6 OPUS
0050086950-Benjamin Cleaver – Project Dissertation – University of Southern Queensland 2013
21
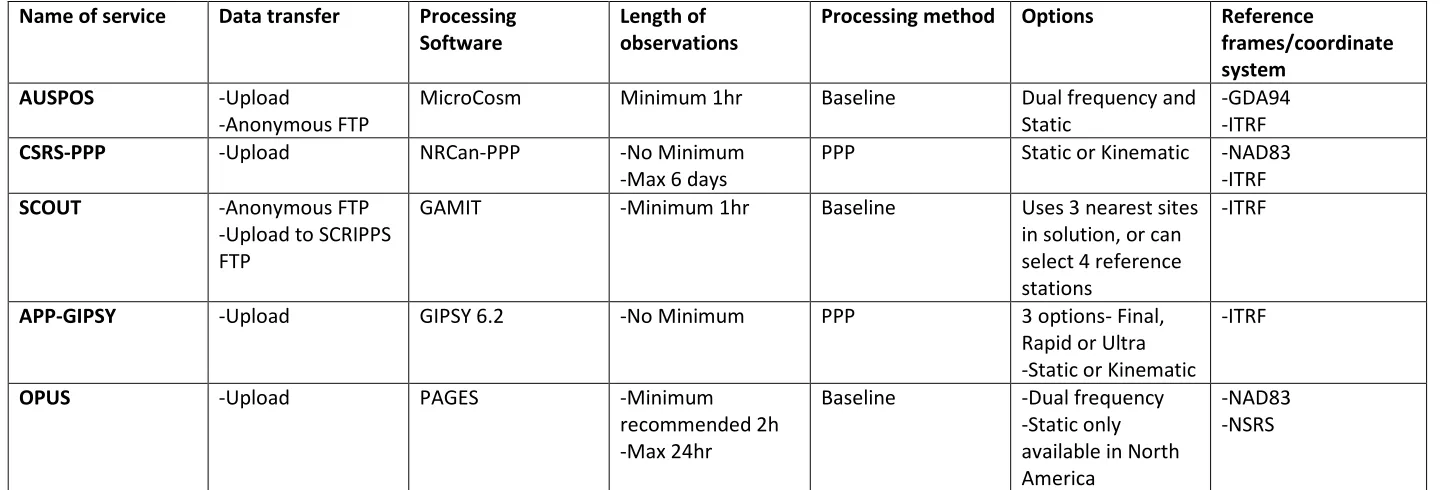
2.7.7 SERVICE COMPARISON
Name of service Data transfer Processing Software
Length of observations
Processing method Options Reference
frames/coordinate system
AUSPOS -Upload
-Anonymous FTP
MicroCosm Minimum 1hr Baseline Dual frequency and
Static
-GDA94 -ITRF
CSRS-PPP -Upload NRCan-PPP -No Minimum -Max 6 days
PPP Static or Kinematic -NAD83 -ITRF
SCOUT -Anonymous FTP -Upload to SCRIPPS FTP
GAMIT -Minimum 1hr Baseline Uses 3 nearest sites
in solution, or can select 4 reference stations
-ITRF
APP-GIPSY -Upload GIPSY 6.2 -No Minimum PPP 3 options- Final, Rapid or Ultra -Static or Kinematic
-ITRF
OPUS -Upload PAGES -Minimum
recommended 2h -Max 24hr
Baseline -Dual frequency -Static only available in North America
[image:21.842.63.783.99.344.2]-NAD83 -NSRS
0050086950-Benjamin Cleaver – Project Dissertation – University of Southern Queensland 2013 22
2.8
Permanent Survey Marks
The Land and Property Information (LPI) are responsible for the maintenance of the NSW survey network of control stations. The LPI state that a reliable and accurate spatial referencing system underpins surveying, land information and mapping systems in NSW. The role of the LPI is to manage the Survey Control Information Management System (SCIMS). Both public and private sector surveyors contribute to the system by placing and recording new permanent survey marks. ACTPLA are responsible for the maintenance of ACT survey control station. Both the ACT and NSW survey control infrastructure will be utilised in this project. In both the ACT and NSW permanent survey marks must meet the Surveyor General’s Direction Number 12. This survey direction specifies the marking, positioning technologies, survey practice, observation processing, least squares adjustment and reporting of new marks (LPI 2012)
2.9
Previous investigations
There have been various previous investigations into different aspects of on-line post-processing systems. Below is an outline of the previous investigations and the conclusions that have been drawn from them.
In 2009 Koschel investigated the reliability of AUSPOS, specifically the height component. The investigation was undertaken in the Toowoomba region and measured ten different existing survey control marks for a period of 12 hours each. The report analysed the differences of the processed coordinates of AUSPOS from the known coordinates of each of the marks at different observation lengths up to 12 hours. It was found that ‘longer observation periods delivered greater consistency of horizontal processed coordinate values.’ (Koschel 2009) It was found in this investigation that the height difference trended 250mm higher than the AHD value at each of the control marks.
A study by Ghouddousi-Fard and Dare in 2005 titled ‘Online GPS processing services: an initial study’ compared five on-line GPS post-processing services: AUSPOS, SCOUT, PPP, OPUS and Auto-GIPSY. This paper found that the results for the processing of the coordinates converged at 10 hours and did not differ between 10 and 24 hours. The paper states that ‘users can expect reliable results from on-line services’.
0050086950-Benjamin Cleaver – Project Dissertation – University of Southern Queensland 2013 23
Tsakiri in 2008 compared AUSPOS, CSRS-PPP, SCOUT and Auto-Gipsy. The points used in the comparison were eight international GNSS service stations. Only one of these points were located in Australia, and this point was located in Darwin. It was found that solutions of observations that are 24 hours in length ‘…are generally repeatable at the 1-2cm level and accurate at the 3-4cm level’ It is noted that it was also found that as the observation length decreases the quality of the solution also decreases.
2.10 Review of Expected Accuracy and comparison
0050086950-Benjamin Cleaver – Project Dissertation – University of Southern Queensland 2013 24
Chapter 3.
Methodology
3.1
Introduction
Throughout this chapter, details of the field and office procedures undertaken to complete the project will be outlined. For completion of the project a number of repeated tests were completed. The tests involved the use of a GNSS receiver located over a known survey control mark to continuously record data. This recorded data is then submitted to the various on-line post processing services and the results from each of these services analysed.
The project methodology will give the reader an understanding of the testing undertaken and additionally provide insight into the typical procedure for the use of online post-processing systems and the relevance to real world scenarios.
3.2
Scope of work
A set of criteria was determined to allow a field measurement programme to be designed. The set of criteria was governed by the following factors:
- Time
- Equipment availability - Survey control accessibility
- Required amount of data for analysis
Due to the constraints outlined above a suitable sample size of five survey control stations was determined appropriate for the testing. The testing was to be carried out in the Australian Capital Territory (ACT) and surrounding region. The ACT survey control marks are maintained by the ACT Planning and Land Authority (ACTPLA). Due to the nature of the ACT the majority of survey control marks are described in the AGC coordinate system. This coordinate system encompasses the ACT; however is not directly relevant to the results that are obtained from the various post processing systems being used in the project. According to ACTPLA, GDA94 coordinates can be established by several methods of conversion, giving a varying range of accuracy. This range of accuracy can be up to 0.1m. To avoid the possible discrepancies in conversion to the correct coordinate system, it was decided to use only survey control marks with published MGA94 or GDA94 coordinates throughout this project.
Selection of appropriate control marks for comparison utilises the ICSM’s SP1. Using this document the following criteria for control marks were met:
- It is preferable to have Class A or above for horizontal coordinates, therefore the coordinates must be first order or above
- It is preferable have Class LA or above for vertical level, therefore must be an order of L1 or above.
0050086950-Benjamin Cleaver – Project Dissertation – University of Southern Queensland 2013 25
- The location of the marks must be easily accessible and secure for a 24 hour period, or have the ability to be monitored for the duration of the observations.
- The marks must be in good condition.
3.3
Risk Assessment
The project was undertaken in 3 main sections, the first section being research, the second being collection of data in the field and the third being analysis of the data. The first and third sections of the project are low risk activities and occur in an office environment with no obvious hazards present. The second stage of the project involves field measurements which contains some hazards. There are minimal hazards when undertaking the activities required of this report. These hazards were identified and controls designed to minimise the risk when undertaking the project.
3.4 Ethical responsibility
The processes of this dissertation are completed with reference to the Engineers Australia Code of Ethics as well as the Spatial Science Institute and the Board of Surveyors Code of Ethics. The ethics of the project topic take into consideration each of the services that provide the free service. As this dissertation simply advises as to the use of certain systems it is unlikely that any ethical issues will arise from the undertaking of this dissertation.
3.5
Selection of Appropriate Control Marks
Using the criteria outlined in the scope it was possible to search for appropriate survey control marks. ACTPLA offer an on-line service for the search of all available survey control marks in the territory (ACTMAPi). It is not possible to search the data base with constraints such as class and order or by a certain coordinate system. It was discovered that the various types of construction of marks generally indicated the class and order of the control mark. A complete search of the database of the appropriate marks yielded hundreds of results. These were culled manually to reveal approximately 25 appropriate marks in the ACT. These 25 marks were scrutinised using aerial photography from Google earth and ACTMAPi. A short list of 18 marks was selected for a field inspection.
0050086950-Benjamin Cleaver – Project Dissertation – University of Southern Queensland 2013 26
Figure 3.1 Map of survey control marks
Name Location Type H Class H Order V Class V Order
BL234 Dunlop Steel Rod A 1 LA L1
LN9 Tharwa Steel Rod 2A 0 LA L1
PR90 Tidbinbilla Steel Rod 2A 0 LA L1
PM113755 Royalla GIP B 2 C 3
PM109888 Royalla GIP A 1 B 2
Table3.1 Survey control mark details
0050086950-Benjamin Cleaver – Project Dissertation – University of Southern Queensland 2013 27
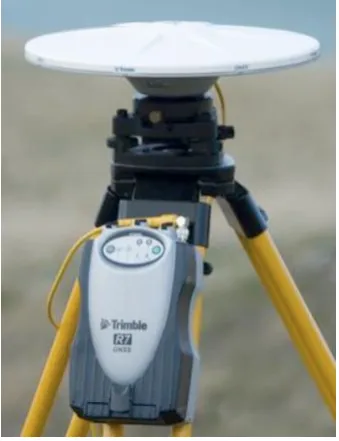
3.6 Equipment
The resource requirements for the project are outlined below. The equipment used was made available by Landmark Surveys for the project and is also described below.
- 1 x GNSS receiver – Trimble Zephyr Geodetic antennae (TRM4129.0)
- 1 x data collector – Trimble R7 Receiver - 1 x tripod
- 1 x tribrach
- Sufficient batteries to last 24 hours including charger
- 1 x measuring tape - 1 x motor vehicle
- Software for conversion to RINEX file
- Computer with access for the internet for upload of file to various on-line processing systems.
The GNSS system used for the testing consisted of a Trimble Zephyr Geodetic antennae (TRM4129.0) and Trimble R7 Receiver.
3.7 GNSS Observations
Upon selection of the appropriate control marks, field measurements must be taken at the selected sites. Field measurements are taken with a Trimble Zephyr Geodetic antenna (shown to the right) in conjunction with a Trimble R7 receiver system. The Trimble R7 receiver system will also be the data recorder that will record the observations. See appendix C for specifications of the R7 receiver.
Field measurements are taken at each of the five pre-determined survey control marks for a duration of 24 hours. This allows appropriate analysis of the results for durations of less than 24 hours up to a full day, to provide an insight into the optimal length of time to record observations.
[image:27.595.357.527.83.304.2]GNSS observations are then taken. Only one GPS receiver was available for the observations therefore a data acquisition plan was designed to collect the data in an appropriate time period. Each of the observations is independent of one another. A risk assessment is completed and consulted throughout the testing period. Particular attention is paid to ensuring the equipment is secure for the duration of the testing and included selecting observation periods that would allow frequent checking of the equipment and low civilian traffic.
0050086950-Benjamin Cleaver – Project Dissertation – University of Southern Queensland 2013 28
The procedure for the observation of the data is outlined below:
1. Ensure all equipment is available, in working order and batteries are fully charged 2. Travel to chosen site and locate survey control mark
3. Level tribrach precisely over control mark, ensuring the tripod is stable and secured using sand bags due to wind.
4. Install GNSS antennae and connect to battery and R7 receiver
5. Measure the height of the antennae from the control mark. (The height is measured to the Antennae Reference Point ARP as seen in Appendix D)
6. Height is recorded in field notes by surveyor
7. Logging is begun and the time and details noted in field notes by surveyor 8. After 24 hours return to site
9. End the survey, ensure tribrach is still level and confirm the height of the antennae before the equipment is packed up
10. Logging data is retrieved from the flash card and backed up 11. Process is repeated at each survey control mark.
[image:28.595.77.291.365.485.2]Particular attention must be paid to ensuring the tribrach is calibrated before any observations are taken.
0050086950-Benjamin Cleaver – Project Dissertation – University of Southern Queensland 2013 29
3.8 Reduction of Observations
3.8.1 RINEX conversion
[image:29.595.79.289.273.427.2]Trimble receivers record observed GNSS data in a Trimble format ‘.T01’. This format is not recognised by any of the on-line post processing services and must be converted to the Receiver Independent Exchange Format (RINEX). Trimble offer free software for the conversion of ‘.T01’ files to RINEX format (ConvertToRINEX v2.17.0). The software can be downloaded from http://ww2.trimble.com/trimblerinex_ts.asp and converts files into RINEX 2.10. The conversion software reads the .T01 file and validates the information. The observations can then be converted to RINEX format.
Figure 3.4 RINEX conversion software
3.8.2 RINEX modification
0050086950-Benjamin Cleaver – Project Dissertation – University of Southern Queensland 2013 30
3.8.3 Submission to Processing Services
Each processing service differs in the submission of RINEX files. As was discovered through the literature review AUSPOS, GIPSY and PPP allowed upload of the file directly to the server, whereas SCOUT relied on upload to an FTP server. Throughout the submission process there are a number of options available that may affect the results of the observations. The options available in the upload are detailed outlined below.
AUSPOS
- File can be submitted via upload or anonymous ftp
- Required input: file, antennae height, antennae type, email address. - Optional input: multiple files
SCOUT
- File is submitted via ftp
- Required input: email address, antennae type, receiver type, antennae height - Optional input: choose up to 4 specific CORS for baseline processing
CSRS-PPP
- File is submitted via upload - Required input: email address
- Optional input: static or kinematic, epoch of resulting coordinates
GIPSY
- File is submitted via upload - Required input: file
0050086950-Benjamin Cleaver – Project Dissertation – University of Southern Queensland 2013 31
3.8.4 Collection of Processing Results
Each processing service differs in the content, format and delivery method of the processing results. Each of the processing reports can be viewed in the appendices.
AUSPOS- Report is received via email containing GDA94 Cartesian and geodetic coordinates, MGA94 coordinates and ITRF Cartesian and geodetic coordinates at the mean epoch of the site observation. The processing report includes a one sigma coordinate precision and the ambiguity resolution per baseline, including each baseline length. The solution is calculated with up to 15 separate baselines.
SCOUT- The scout report is received for SCRIPPS via email. The report contains WGS84 geodetic coordinates and ITRF coordinates for the epoch of the observations. A standard deviation is provided for each of the coordinates. The three nearest stations are used in the solution and an average baseline length is quoted. The report also states if the solution is computed using the ultra-rapid, rapid or final IGS data (all observations for this report utilise the final IGS data).
CSRS-PPP- This service provides a PPP solution and includes geodetic ITRF coordinates. The report provides a standard deviation at 95% and includes additional information such as the cut off elevation and any epochs that were rejected. The report details estimated parameters and other observation statistics. The report contains 12 plots that detail carrier phase residuals, ambiguities and other plots for the information of the user.
0050086950-Benjamin Cleaver – Project Dissertation – University of Southern Queensland 2013 32
3.9 Conversion of coordinates
0050086950-Benjamin Cleaver – Project Dissertation – University of Southern Queensland 2013 33
Where;
MGA94 ITRF (Epoch at date of obs)
Mark No. Easting Northing RL (AHD71) X Y Z
[image:33.595.77.531.64.554.2]BL234 683827.775 6104467.593 564.062 683828.184 6104468.661 583.439 LN9 688154.296 6066454.516 596.124 688154.702 6066455.584 615.260 PR90 677014.309 6079134.27 658.003 677014.716 6079135.340 677.079 PM117355 696267.765 6067729.958 896.69 696268.171 6067731.027 915.998
Table 3.2 Published coordinates vs converted coordinates
3.10 Conclusion
0050086950-Benjamin Cleaver – Project Dissertation – University of Southern Queensland 2013 34
Chapter 4.
Results
4.1 Introduction
The following section is an outline of the results for each of the on-line post-processing systems completed for this project. The procedures outlined in the methodology have been performed to produce the following results. Firstly the results are presented to show that the coordinates that have been obtained are valid, secondly each service is presented to allow analysis of the accuracy of each service, thirdly each of the services will be compared to one another; finally the length of observation and how this affects the solution will be shown.
4.2 Residual
0050086950-Benjamin Cleaver – Project Dissertation – University of Southern Queensland 2013
35
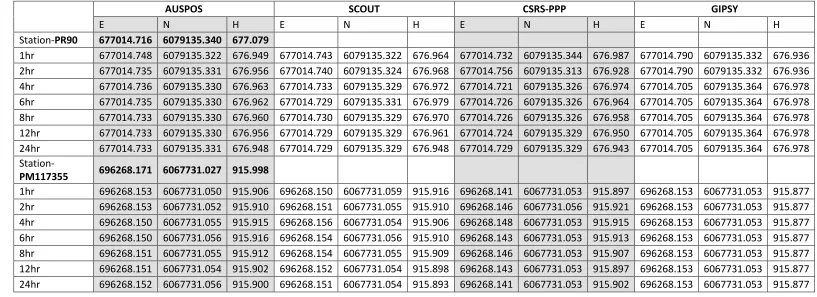
4.2.1 Processed coordinates
[image:35.842.22.823.202.484.2]The processed coordinates are shown in the following table; they have been derived from the processing reports shown in the appendices. The coordinates are expressed in terms of an easting, northing and ellipsoidal height. Due to each of the processing services providing ITRF coordinates in either ECEF or geodetic form, the coordinates have been transformed to an easting and northing using the Redfearn transformation program available on the ICSM website.
Table 4.1 BL234 and LN9 processed coordinates
AUSPOS SCOUT CSRS-PPP GIPSY
E N H E N H E N H E N H
Station-BL234 683828.184 6104468.661 583.439
1hr 683828.186 6104468.647 583.267 683828.183 6104468.650 583.267 683828.194 6104468.638 583.242 683828.165 6104468.666 583.295 2hr 683828.184 6104468.650 583.266 683828.182 6104468.650 583.266 683828.202 6104468.638 583.230 683828.255 6104468.634 583.253 4hr 683828.182 6104468.651 583.267 683828.183 6104468.649 583.269 683828.179 6104468.648 583.250 683828.255 6104468.634 583.253 6hr 683828.183 6104468.651 583.267 683828.183 6104468.650 583.271 683828.182 6104468.648 583.253 683828.255 6104468.634 583.253 8hr 683828.183 6104468.650 583.265 683828.184 6104468.647 583.261 683828.182 6104468.651 583.251 683828.165 6104468.666 583.295 12hr 683828.184 6104468.650 583.265 683828.183 6104468.647 583.271 683828.182 6104468.648 583.256 683828.165 6104468.666 583.295 24hr 683828.184 6104468.650 583.269 683828.183 6104468.647 583.269 683828.182 6104468.648 583.264 683828.165 6104468.666 583.295
Station-LN9 688154.702 6066455.584 615.260
0050086950-Benjamin Cleaver – Project Dissertation – University of Southern Queensland 2013
36
AUSPOS SCOUT CSRS-PPP GIPSY
E N H E N H E N H E N H
Station-PR90 677014.716 6079135.340 677.079
1hr 677014.748 6079135.322 676.949 677014.743 6079135.322 676.964 677014.732 6079135.344 676.987 677014.790 6079135.332 676.936 2hr 677014.735 6079135.331 676.956 677014.740 6079135.324 676.968 677014.756 6079135.313 676.928 677014.790 6079135.332 676.936 4hr 677014.736 6079135.330 676.963 677014.733 6079135.329 676.972 677014.721 6079135.326 676.974 677014.705 6079135.364 676.978 6hr 677014.735 6079135.330 676.962 677014.729 6079135.331 676.979 677014.726 6079135.326 676.964 677014.705 6079135.364 676.978 8hr 677014.733 6079135.330 676.960 677014.730 6079135.329 676.970 677014.726 6079135.326 676.958 677014.705 6079135.364 676.978 12hr 677014.733 6079135.330 676.956 677014.729 6079135.329 676.961 677014.724 6079135.329 676.950 677014.705 6079135.364 676.978 24hr 677014.733 6079135.331 676.948 677014.729 6079135.329 676.948 677014.729 6079135.329 676.943 677014.705 6079135.364 676.978
Station-PM117355 696268.171 6067731.027 915.998
[image:36.842.9.826.84.381.2]1hr 696268.153 6067731.050 915.906 696268.150 6067731.059 915.916 696268.141 6067731.053 915.897 696268.153 6067731.053 915.877 2hr 696268.153 6067731.052 915.910 696268.151 6067731.055 915.910 696268.146 6067731.056 915.921 696268.153 6067731.053 915.877 4hr 696268.150 6067731.055 915.915 696268.156 6067731.054 915.906 696268.148 6067731.053 915.915 696268.153 6067731.053 915.877 6hr 696268.150 6067731.056 915.916 696268.154 6067731.056 915.910 696268.143 6067731.053 915.913 696268.153 6067731.053 915.877 8hr 696268.151 6067731.055 915.912 696268.154 6067731.055 915.909 696268.146 6067731.053 915.907 696268.153 6067731.053 915.877 12hr 696268.151 6067731.054 915.902 696268.152 6067731.054 915.898 696268.143 6067731.053 915.897 696268.153 6067731.053 915.877 24hr 696268.152 6067731.056 915.900 696268.151 6067731.054 915.893 696268.141 6067731.053 915.902 696268.153 6067731.053 915.877
0050086950-Benjamin Cleaver – Project Dissertation – University of Southern Queensland 2013
37
4.2.2 BL234
The below table indicates the residual difference between the converted coordinate of BL234 from GDA94 to ITRF2008 epoch 2013.5630; and the processed coordinates of each service at the observation lengths indicated. The processed coordinates can be found in the appendices and the converted control coordinates to ITRF can be found in 3.2.
Station-BL234
AUSPOS SCOUT CSRS-PPP GIPSY
∆E ∆N ∆H ∆E ∆N ∆H ∆E ∆N ∆H ∆E ∆N ∆H
[image:37.842.64.613.180.323.2]1hr 0.002 -0.014 -0.172 -0.001 -0.011 -0.172 0.01 -0.023 -0.197 -0.019 0.005 -0.144 2hr 0.000 -0.011 -0.173 -0.002 -0.011 -0.173 0.018 -0.023 -0.209 0.071 -0.027 -0.186 4hr -0.002 -0.010 -0.172 -0.001 -0.012 -0.170 -0.005 -0.013 -0.189 0.071 -0.027 -0.186 6hr -0.001 -0.010 -0.172 -0.001 -0.011 -0.168 -0.002 -0.013 -0.186 0.071 -0.027 -0.186 8hr -0.001 -0.011 -0.174 0.000 -0.014 -0.178 -0.002 -0.01 -0.188 -0.019 0.005 -0.144 12hr 0.000 -0.011 -0.174 -0.001 -0.014 -0.168 -0.002 -0.013 -0.183 -0.019 0.005 -0.144 24hr 0.000 -0.011 -0.170 -0.001 -0.014 -0.170 -0.002 -0.013 -0.175 -0.019 0.005 -0.144
Table 4.3 BL234 Residuals
0050086950-Benjamin Cleaver – Project Dissertation – University of Southern Queensland 2013
38
4.2.3 LN9
The below table indicates the residual difference between the converted coordinate of LN9 from GDA94 to ITRF2008 epoch 2013.5822; and the processed coordinates of each service at the observation lengths indicated. The processed coordinates can be found in the appendices and the converted control coordinates to ITRF can be found in 3.2.
Station-LN9
AUSPOS SCOUT CSRS-PPP GIPSY
∆E ∆N ∆H ∆E ∆N ∆H ∆E ∆N ∆H ∆E ∆N ∆H
1hr 0.030 0.003 -0.107 0.007 0.014 -0.183 0.026 0.013 -0.193 -0.027 -0.013 -0.179 2hr 0.007 0.011 -0.162 0.013 0.014 -0.170 0.011 0.013 -0.171 -0.029 -0.013 -0.121 4hr 0.006 0.012 -0.164 0.013 0.011 -0.172 0.006 0.010 -0.166 -0.029 -0.013 -0.121 6hr 0.005 0.012 -0.159 0.012 0.011 -0.174 0.003 0.013 -0.158 -0.029 -0.013 -0.121 8hr 0.003 0.012 -0.158 0.010 0.012 -0.171 0.003 0.013 -0.157 -0.029 -0.013 -0.121 12hr 0.004 0.012 -0.157 0.010 0.012 -0.168 0.006 0.013 -0.160 -0.029 -0.013 -0.121 24hr 0.005 0.013 -0.143 0.007 0.012 -0.160 0.003 0.010 -0.151 -0.029 -0.013 -0.121
Table 4.4 LN9 Residuals
0050086950-Benjamin Cleaver – Project Dissertation – University of Southern Queensland 2013
39
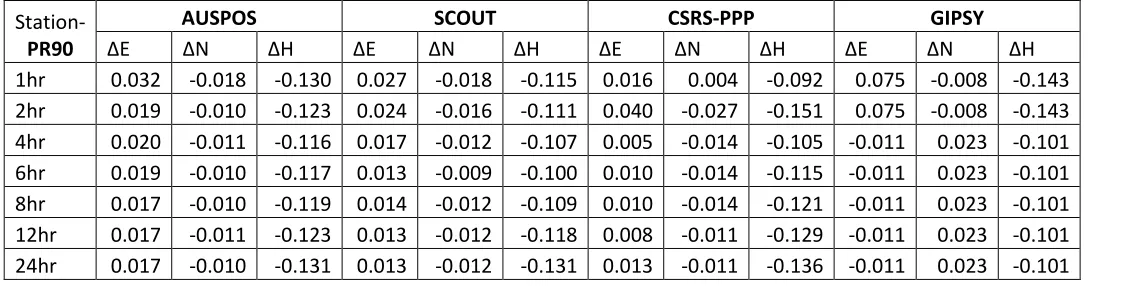
4.2.4 PR90
The below table indicates the residual difference between the converted coordinate of PR90 from GDA94 to ITRF2008 epoch 2013.5986; and the processed coordinates of each service at the observation lengths indicated. The processed coordinates can be found in the appendices and the converted control coordinates to ITRF can be found in 3.2.
Station-PR90
AUSPOS SCOUT CSRS-PPP GIPSY
∆E ∆N ∆H ∆E ∆N ∆H ∆E ∆N ∆H ∆E ∆N ∆H
[image:39.842.65.628.156.299.2]1hr 0.032 -0.018 -0.130 0.027 -0.018 -0.115 0.016 0.004 -0.092 0.075 -0.008 -0.143 2hr 0.019 -0.010 -0.123 0.024 -0.016 -0.111 0.040 -0.027 -0.151 0.075 -0.008 -0.143 4hr 0.020 -0.011 -0.116 0.017 -0.012 -0.107 0.005 -0.014 -0.105 -0.011 0.023 -0.101 6hr 0.019 -0.010 -0.117 0.013 -0.009 -0.100 0.010 -0.014 -0.115 -0.011 0.023 -0.101 8hr 0.017 -0.010 -0.119 0.014 -0.012 -0.109 0.010 -0.014 -0.121 -0.011 0.023 -0.101 12hr 0.017 -0.011 -0.123 0.013 -0.012 -0.118 0.008 -0.011 -0.129 -0.011 0.023 -0.101 24hr 0.017 -0.010 -0.131 0.013 -0.012 -0.131 0.013 -0.011 -0.136 -0.011 0.023 -0.101
Table 4.5 PR90 Residuals
0050086950-Benjamin Cleaver – Project Dissertation – University of Southern Queensland 2013
40
4.2.5 PM117355
[image:40.842.65.633.159.300.2]The below table indicates the residual difference between the converted coordinate of PM117355 from GDA94 to ITRF2008 epoch 2013.6205; and the processed coordinates of each service at the observation lengths indicated. The processed coordinates can be found in the appendices and the converted control coordinates to ITRF can be found in 3.2.
Table 4.6 PR90 Residuals
It can be seen that the range of values for the easting and northing residuals sits between 0.015m and 0.038m. The residuals for the height range between 0.082m and 0.121m. The residuals of all of the services do not need to be investigated further for anomalies as the residuals sit within the expected outcome.
Station-PM117355
AUSPOS SCOUT CSRS-PPP GIPSY
∆E ∆N ∆H ∆E ∆N ∆H ∆E ∆N ∆H ∆E ∆N ∆H
0050086950-Benjamin Cleaver – Project Dissertation – University of Southern Queensland 2013 41
4.2.6 Residual Summary
It can be seen that no anomalies in the data for each of the observation sites can be reasonably detected. All of the resulting coordinates from the services will be used in the comparisons. Anomalies may still exist in the data; however these cannot be discovered due to the limited amount of data that has been collected for this project. Sound practises in the selection of the sites for observations and the observation technique for this project have ensured that external factors such as multipath will have a negligible impact on the results.
4.3
Individual service results
0050086950-Benjamin Cleaver – Project Dissertation – University of Southern Queensland 2013 42
[image:42.595.113.492.110.344.2]4.3.1 AUSPOS
Figure 4.1 Horizontal residual differences of AUSPOS over time
Figure 4.2 Vertical residual differences of AUSPOS over time
The mean residuals for AUSPOS were as expected. The processing reports for each of the one hour observations flagged that the data could have errors due to the short observation length and quality of the solution.
0.000 0.005 0.010 0.015 0.020 0.025
1 2 4 6 8 12 24
AUSPOS
Easting difference Northing difference 0.118 0.120 0.122 0.124 0.126 0.128 0.130 0.132 0.134 0.136 0.138 0.1401 2 4 6 8 12 24
[image:42.595.117.498.398.634.2]0050086950-Benjamin Cleaver – Project Dissertation – University of Southern Queensland 2013 43
[image:43.595.90.472.120.351.2]4.3.2 SCOUT
Figure 4.3 Horizontal residual difference of SCOUT over time
Figure 4.4 Vertical residual difference of SCOUT over time 0.000 0.002 0.004 0.006 0.008 0.010 0.012 0.014 0.016 0.018 0.020
1 2 4 6 8 12 24
SCOUT
Easting difference Northing difference 0.000 0.020 0.040 0.060 0.080 0.100 0.120 0.140 0.1601 2 4 6 8 12 24
[image:43.595.90.474.378.625.2]0050086950-Benjamin Cleaver – Project Dissertation – University of Southern Queensland 2013 44
[image:44.595.102.484.122.352.2]4.3.3 GIPSY
Figure 4.5 Horizontal residual difference of GIPSY over time
Figure 4.6 Vertical residual difference of GIPSY over time 0.000 0.010 0.020 0.030 0.040 0.050 0.060
1 2 4 6 8 12 24
GIPSY
Easting difference Northing difference 0.000 0.020 0.040 0.060 0.080 0.100 0.120 0.140 0.1601 2 4 6 8 12 24
[image:44.595.104.484.406.642.2]0050086950-Benjamin Cleaver – Project Dissertation – University of Southern Queensland 2013 45
[image:45.595.104.485.123.356.2]4.3.4 CSRS-PPP
Figure 4.7 Horizontal residual difference of CSRS-PPP over time
Figure 4.8 Vertical residual difference of CSRS-PPP over time 0.000 0.005 0.010 0.015 0.020 0.025
1 2 4 6 8 12 24
CSRS-PPP
Easting difference Northing difference 0.125 0.130 0.135 0.140 0.145 0.150 0.1551 2 4 6 8 12 24
[image:45.595.102.486.427.661.2]0050086950-Benjamin Cleaver – Project Dissertation – University of Southern Queensland 2013 46
4.4
Service comparison
[image:46.595.94.467.120.369.2]MEAN EASTING RESIDUAL
Figure 4.9 Mean easting difference of all services over time
MEAN NORTHING RESIDUAL
Figure 4.10 Mean northing difference of all services over time 0 0.01 0.02 0.03 0.04 0.05 0.06
1 2 4 6 8 12 24
AUSPOS CSRS-PPP SCOUT GIPSY 0 0.005 0.01 0.015 0.02 0.025
1 2 4 6 8 12 24
[image:46.595.93.466.432.694.2]0050086950-Benjamin Cleaver – Project Dissertation – University of Southern Queensland 2013 47
It is clear that the mean easting and northing residuals converge at the four hour observation period for AUSPOS, SCOUT and CSRS-PPP. GIPSY converges with the other services at the eight hour observation period. The largest residual difference between the services is less than 10mm. Once the residuals converge and become consistent between the services the difference between the residuals is in the order of a few millimetres.
[image:47.595.103.468.169.417.2]MEAN HEIGHT RESIDUAL
Figure 4.11 Mean height difference of all services over time
The residuals of the heights are larger than that of the easting and northing. The mean residuals of the heights range from 105mm to 146mm. Evidently the residuals between the different services are least comparable at the one hour observation length. Longer observations provide a more consistent result throughout the different services. The difference between the services is marginal compared to the residual to the known survey control marks.
4.5
Observation length
From the literature review it is found that the observation length at each of the survey control sites is related to the accuracy of the solution. The results of the observation length with relation to each service can be seen in the previous plots. An analysis of the relationship between the observation length and the accuracy of the processed coordinates are shown in the following chapter, chapter 5. 0 0.02 0.04 0.06 0.08 0.1 0.12 0.14 0.16
1 2 4 6 8 12 24
0050086950-Benjamin Cleaver – Project Dissertation – University of Southern Queensland 2013 48
Chapter 5.
Analysis and Discussion
5.1
Introduction
This chapter analyses the results that were presented in the previous chapter. This chapter focuses on the comparison of the services at each of the observation lengths. A statistical comparison is made between the services at each of the observation time periods to allow conclusions to be made. Due to the limited amount of data for each time period the statistical analysis is limited, a larger sample size would yield more definite results.
0050086950-Benjamin Cleaver – Project Dissertation – University of Southern Queensland 2013 49
5.2
Statistical analysis
5.2.1 One hour observation length
Control
Mark AUSPOS SCOUT CSRS-PPP GIPSY
∆E ∆N ∆H ∆E ∆N ∆H ∆E ∆N ∆H ∆E ∆N ∆H
BL234 0.002 -0.014 -0.172 -0.001 -0.011 -0.172 0.01 -0.023 -0.197 -0.019 0.005 -0.144
LN9 0.030 0.003 -0.107 0.007 0.014 -0.183 0.026 0.013 -0.193 -0.027 -0.013 -0.179
PR90 0.032 -0.018 -0.130 0.027 -0.018 -0.115 0.016 0.004 -0.092 0.075 -0.008 -0.143
PM117355 -0.019 0.023 -0.092 -0.021 0.032 -0.083 -0.030 0.026 -0.101 -0.019 0.025 -0.121
Range 0.051 0.041 0.038 0.048 0.050 0.100 0.057 0.049 0.105 0.102 0.039 0.058
Mean 0.011 -0.002 -0.125 0.003 0.004 -0.138 0.006 0.005 -0.146 0.002 0.002 -0.147
Standard
Deviation 0.024 0.019 0.035 0.020 0.023 0.048 0.025 0.021 0.057 0.048 0.017 0.024
[image:49.595.76.558.154.341.2]
Table 5.1 One hour statistics-All services
0050086950-Benjamin Cleaver – Project Dissertation – University of Southern Queensland 2013 50
5.2.2 Two hour observation length
Control
Mark AUSPOS SCOUT CSRS-PPP GIPSY
∆E ∆N ∆H ∆E ∆N ∆H ∆E ∆N ∆H ∆E ∆N ∆H
BL234 0.000 -0.011 -0.173 -0.002 -0.011 -0.173 0.018 -0.023 -0.209 0.071 -0.027 -0.186
LN9 0.007 0.011 -0.162 0.013 0.014 -0.170 0.011 0.013 -0.171 -0.029 -0.013 -0.121
PR90 0.019 -0.010 -0.123 0.024 -0.016 -0.111 0.040 -0.027 -0.151 0.075 -0.008 -0.143
PM117355 -0.018 0.025 -0.088 -0.021 0.028 -0.088 -0.025 0.029 -0.077 -0.019 0.025 -0.121
Range 0.037 0.036 0.085 0.044 0.044 0.085 0.065 0.056 0.132 0.103 0.052 0.065
Mean 0.002 0.004 -0.137 0.003 0.003 -0.135 0.011 -0.002 -0.152 0.024 -0.006 -0.143
Standard
[image:50.595.77.558.112.298.2]Deviation 0.015 0.017 0.039 0.019 0.021 0.043 0.027 0.027 0.055 0.056 0.022 0.031
Table 5.2 Two hour statistics-All services
0050086950-Benjamin Cleaver – Project Dissertation – University of Southern Queensland 2013 51
5.2.3 Four hour observation length
Control
Mark AUSPOS SCOUT CSRS-PPP GIPSY
∆E ∆N ∆H ∆E ∆N ∆H ∆E ∆N ∆H ∆E ∆N ∆H
BL234 -0.002 -0.010 -0.172 -0.001 -0.012 -0.170 -0.005 -0.013 -0.189 0.071 -0.027 -0.186
LN9 0.006 0.012 -0.164 0.013 0.011 -0.172 0.006 0.010 -0.166 -0.029 -0.013 -0.121
PR90 0.020 -0.011 -0.116 0.017 -0.012 -0.107 0.005 -0.014 -0.105 -0.011 0.023 -0.101
PM117355 -0.021 0.028 -0.083 -0.015 0.027 -0.092 -0.023 0.026 -0.083 -0.019 0.025 -0.121
Range 0.041 0.038 0.089 0.032 0.038 0.080 0.030 0.040 0.106 0.099 0.052 0.085
Mean 0.001 0.005 -0.134 0.003 0.003 -0.136 -0.004 0.002 -0.136 0.003 0.002 -0.132
Standard
[image:51.595.78.558.112.298.2]Deviation 0.017 0.019 0.042 0.015 0.019 0.042 0.014 0.019 0.050 0.046 0.026 0.037
Table 5.3 Four hour statistics-All services
The four hour statistics become more consistent than previous observation lengths. From this observation length onwards the solution does not improve significantly. The standard deviations are of the magnitude of the expected accuracy of the service. The standard deviations for the easting and northing also begin to reflect the residual difference to each of the survey control marks. This is not the case for the height residual and is expected.
5.2.4 Six hour observation length
Control
Mark AUSPOS SCOUT CSRS-PPP GIPSY
∆E ∆N ∆H ∆E ∆N ∆H ∆E ∆N ∆H ∆E ∆N ∆H
BL234 -0.001 -0.010 -0.172 -0.001 -0.011 -0.168 -0.002 -0.013 -0.186 0.071 -0.027 -0.186
LN9 0.005 0.012 -0.159 0.012 0.011 -0.174 0.003 0.013 -0.158 -0.029 -0.013 -0.121
PR90 0.019 -0.010 -0.117 0.013 -0.009 -0.100 0.010 -0.014 -0.115 -0.011 0.023 -0.101
PM117355 -0.021 0.029 -0.082 -0.017 0.029 -0.088 -0.028 0.026 -0.085 -0.019 0.025 -0.121
Range 0.041 0.039 0.090 0.030 0.040 0.086 0.038 0.040 0.101 0.099 0.052 0.085
Mean 0.000 0.005 -0.132 0.002 0.005 -0.132 -0.004 0.003 -0.136 0.003 0.002 -0.132
Standard
Deviation 0.017 0.019 0.041 0.014 0.019 0.045 0.017 0.020 0.045 0.046 0.026 0.037
0050086950-Benjamin Cleaver – Project Dissertation – University of Southern Queensland 2013 52
5.2.5 Eight hour observation length
Control
Mark AUSPOS SCOUT CSRS-PPP GIPSY
∆E ∆N ∆H ∆E ∆N ∆H ∆E ∆N ∆H ∆E ∆N ∆H
BL234 -0.001 -0.011 -0.174 0.000 -0.014 -0.178 -0.002 -0.01 -0.188 -0.019 0.005 -0.144
LN9 0.003 0.012 -0.158 0.010 0.012 -0.171 0.003 0.013 -0.157 -0.029 -0.013 -0.121
PR90 0.017 -0.010 -0.119 0.014 -0.012 -0.109 0.010 -0.014 -0.121 -0.011 0.023 -0.101
PM117355 -0.021 0.028 -0.086 -0.018 0.028 -0.089 -0.025 0.026 -0.091 -0.019 0.025 -0.121
Range 0.038 0.039 0.088 0.031 0.042 0.089 0.035 0.040 0.097 0.010 0.039 0.043
Mean 0.000 0.005 -0.134 0.001 0.004 -0.137 -0.003 0.004 -0.139 -0.019 0.010 -0.122
Standard
Deviation 0.016 0.019 0.040 0.014 0.020 0.044 0.015 0.019 0.042 0.007 0.018 0.018
Table 5.5 Eight hour statistics-All services
At the eight hour observation length GIPSY converges with the other services in regard to the standard deviation, although the mean residual for GIPSY is larger in magnitude than the other three services.
5.2.5 Twelve hour observation length
Control
Mark AUSPOS SCOUT CSRS-PPP GIPSY
∆E ∆N ∆H ∆E ∆N ∆H ∆E ∆N ∆H ∆E ∆N ∆H
BL234 0.000 -0.011 -0.174 -0.001 -0.014 -0.168 -0.002 -0.013 -0.183 -0.019 0.005 -0.144
LN9 0.004 0.012 -0.157 0.010 0.012 -0.168 0.006 0.013 -0.160 -0.029 -0.013 -0.121
PR90 0.017 -0.011 -0.123 0.013 -0.012 -0.118 0.008 -0.011 -0.129 -0.011 0.023 -0.101
PM117355 -0.020 0.027 -0.096 -0.020 0.027 -0.100 -0.028 0.026 -0.101 -0.019 0.025 -0.121
Range 0.037 0.038 0.078 0.032 0.040 0.068 0.036 0.039 0.082 0.018 0.039 0.043
Mean 0.000 0.004 -0.137 0.001 0.003 -0.139 -0.004 0.004 -0.143 -0.019 0.010 -0.122
Standard
[image:52.595.77.558.100.288.2]Deviation 0.015 0.019 0.035 0.015 0.019 0.035 0.017 0.019 0.036 0.007 0.018 0.018
0050086950-Benjamin Cleaver – Project Dissertation – University of Southern Queensland 2013 53
5.2.6 Twenty-Four hour observation length
Control
Mark AUSPOS SCOUT CSRS-PPP GIPSY
∆E ∆N ∆H ∆E ∆N ∆H ∆E ∆N ∆H ∆E ∆N ∆H
BL234 0.000 -0.011 -0.170 -0.001 -0.014 -0.170 -0.002 -0.013 -0.175 -0.019 0.005 -0.144
LN9 0.005 0.013 -0.143 0.007 0.012 -0.160 0.003 0.010 -0.151 -0.029 -0.013 -0.121
PR90 0.017 -0.010 -0.131 0.013 -0.012 -0.131 0.013 -0.011 -0.136 -0.011 0.023 -0.101
PM117355 -0.020 0.029 -0.098 -0.021 0.027 -0.105 -0.030 0.026 -0.096 -0.019 0.025 -0.121
Range 0.037 0.040 0.072 0.033 0.040 0.066 0.043 0.039 0.079 0.018 0.039 0.043
Mean 0.001 0.005 -0.136 0.000 0.003 -0.142 -0.004 0.003 -0.139 -0.019 0.010 -0.122
Standard
[image:53.595.77.557.100.288.2]Deviation 0.015 0.019 0.030 0.015 0.019 0.030 0.019 0.019 0.033 0.007 0.018 0.018
Table 5.7 Twenty-Four hour statistics-All services
The twenty-four hour statistics are comparable to the four hour statistics with respect to the magnitude of the standard deviation and mean of AUSPOS, SCOUT and CSRS-PPP. It is noted that the magnitude of the standard deviation for GIPSY has improved until 8 hours and plateaued from that observation length onwards.
5.2.7 Service Comparisons
AUSPOS SCOUT CSRS-PPP GIPSY
SD ∆E SD ∆N SD ∆H SD ∆E SD ∆N SD ∆H SD ∆E SD ∆N SD ∆H SD ∆E SD ∆N SD ∆H
1 Hour 0.024 0.019 0.035 0.020 0.023 0.048 0.025 0.021 0.057 0.048 0.017 0.024
2 Hour 0.015 0.017 0.039 0.019 0.021 0.043 0.027 0.027 0.055 0.056 0.022 0.031
4 Hour 0.017 0.019 0.042 0.015 0.019 0.042 0.014 0.019 0.050 0.046 0.026 0.037
6 Hour 0.017 0.019 0.041 0.014 0.019 0.045 0.017 0.020 0.045 0.046 0.026 0.037
8 Hour 0.016 0.019 0.040 0.014 0.020 0.044 0.015 0.019 0.042 0.007 0.018 0.018
12 Hour 0.015 0.019 0.035 0.015 0.019 0.035 0.017 0.019 0.036 0.007 0.018 0.018
24 Hour 0.015 0.019 0.030 0.015 0.019 0.030 0.019 0.019 0.033 0.007 0.018 0.018
Table 5.8 Standard deviation comparison
[image:53.595.84.550.437.582.2]0050086950-Benjamin Cleaver – Pr