This is a repository copy of Evaluation and combination of pitch estimation methods for
melody extraction in symphonic classical music.
White Rose Research Online URL for this paper:
http://eprints.whiterose.ac.uk/103396/
Version: Accepted Version
Article:
Bosch, J.J., Marxer, R. and Gómez, E. (2016) Evaluation and combination of pitch
estimation methods for melody extraction in symphonic classical music. Journal of New
Music Research. pp. 1-17. ISSN 0929-8215
https://doi.org/10.1080/09298215.2016.1182191
This is an Accepted Manuscript of an article published by Taylor & Francis in Journal of
New Music Research on 23/5/2016, available online:
http://www.tandfonline.com/10.1080/09298215.2016.1182191.
Reuse
Unless indicated otherwise, fulltext items are protected by copyright with all rights reserved. The copyright exception in section 29 of the Copyright, Designs and Patents Act 1988 allows the making of a single copy solely for the purpose of non-commercial research or private study within the limits of fair dealing. The publisher or other rights-holder may allow further reproduction and re-use of this version - refer to the White Rose Research Online record for this item. Where records identify the publisher as the copyright holder, users can verify any specific terms of use on the publisher’s website.
Takedown
If you consider content in White Rose Research Online to be in breach of UK law, please notify us by
Evaluation and Combination of Pitch Estimation
Methods for Melody Extraction in Symphonic
Classical Music
Juan J. Bosch
∗1, R. Marxer
†1,2and E. G´
omez
‡1 1Music Technology Group, Department of Information and
Communication Technologies, Universitat Pompeu Fabra,
Barcelona
2
Speech and Hearing Research Group, Department of Computer
Science, University of Sheffield
August 4, 2016
Abstract
The extraction of pitch information is arguably one of the most im-portant tasks in automatic music description systems. However, previous research and evaluation datasets dealing with pitch estimation focused on relatively limited kinds of musical data. This work aims to broaden this scope by addressing symphonic western classical music recordings, focusing on pitch estimation for melody extraction. This material is char-acterised by a high number of overlapping sources, and by the fact that the melody may be played by different instrumental sections, often alternating within an excerpt. We evaluate the performance of eleven state-of-the-art pitch salience functions, multipitch estimation and melody extraction al-gorithms when determining the sequence of pitches corresponding to the main melody in a varied set of pieces. An important contribution of the present study is the proposed evaluation framework, including the annota-tion methodology, generated dataset and evaluaannota-tion metrics. The results show that the assumptions made by certain methods hold better than others when dealing with this type of music signals, leading to a better performance. Additionally, we propose a simple method for combining the output of several algorithms, with promising results.
1
Introduction
Melody is one of the most relevant aspects of music. According to Selfridge-Field (1998),‘It is melody that enables us to distinguish one work from another. It is
melody that human beings are innately able to reproduce by singing, humming, and whistling. It is melody that makes music memorable: we are likely to recall a tune long after we have forgotten its text’.
Due to its relevance and the number of potential applications, there have been many efforts in the Music Information Retrieval (MIR) literature to au-tomatically extract melodic information from both monophonic (G´omez, Kla-puri, and Meudic 2003) and polyphonic (Salamon, G´omez, et al. 2014) music recordings, commonly applying concepts from auditory scene analysis (Bregman 1994) and voice leading principles (Huron 2001). Automatic melody extraction methods represent the first step to develop systems for automatic transcrip-tion (Klapuri and Davy 2006), melodic retrieval (e.g. query by humming (Hu and Dannenberg 2002)) or transformation (G´omez, Peterschmitt, et al. 2003). Further applications deal with the removal of the lead instrument from a poly-phonic music recording, since the identification of the pitches from the melody is helpful to guide source separation algorithms (Durrieu, Richard, et al. 2010; Marxer 2013). Furthermore, a symbolic representation of the melody is also useful for music classification systems (Salamon, Rocha, and G´omez 2012).
The definition of melody has evolved in the literature, depending on the context in which it was proposed (Ringer 2015). There is thus no standard way to define melody, even for monophonic music material (G´omez, Klapuri, and Meudic 2003). In the MIR community, melody has been defined as the single (monophonic) pitch sequence that a listener might reproduce if asked to whistle or hum a piece of polyphonic music, and that a listener would recognize as being the ‘essence’of that music when heard in comparison(Poliner et al. 2007). This operational definition is very open and involves cognitive processes behind the annotations.
In practice, research in polyphonic music material has focused on ‘single source predominant fundamental frequency (f0) estimation’. According to
Sala-mon, G´omez, et al. (2014),the melody is constrained to belong to a single sound source throughout the piece being analyzed, where this sound source is considered to be the most predominant instrument or voice in the mixture. Here, the term ‘predominant’ is used to denote the source with higher energy. This is the crite-rion followed to generate ground truth information for the evaluation of melody extraction systems in the Music Information Retrieval Evaluation eXchange1
(MIREX).
More specifically, most of the research has focused on singing voice, and as a consequence, melody extraction methods commonly work better for vocal music in comparison to instrumental music. For instance, the algorithm by Salamon and G´omez (2012) obtains the best mean overall accuracy across all datasets used in MIREX, but the results in vocal datasets (MIREX09, INDIAN08) are better than in datasets containing a mixture of vocal and instrumental excerpts (ADC2004, MIREX05). In vocal popular music the definitions of Poliner et al. (2007) and Salamon, G´omez, et al. (2014) provide similar annotation criteria, as people tend to sing the vocal part (when present in the signal), and the voice is usually the most predominant source in the mix. However, both defini-tions differ in more complex music, where the melody is alternatingly played by different instruments. A recent related contribution is the MedleyDB dataset (Bittner et al. 2014), which includes a variety of instrumentation and genres.
1
More importantly, it extends the definition in Salamon, G´omez, et al. (2014) to incorporate two other definitions of melody: ‘The f0 curve of the predomi-nant melodic line drawn from multiple sources’ (to annotate excerpts where the melody is alternated by different predominant instruments), and‘The f0 curves of all melodic lines drawn from multiple sources’ (to annotate excerpts where multiple instruments may be playing different melodic lines).
Such definitions are more useful in the context of symphonic music, which presents further challenges, since melodies are played by alternating instruments or instrument sections (playing in unison, octave relation, or with harmonised melodic lines), and which might not be energetically predominant. The main goal of this work is to study the limitations and challenges posed to state-of-the-art melody extraction algorithms when estimating the pitch sequence cor-responding to the melody in symphonic repertoire. For this study, we create an evaluation database by gathering human annotations according to the definition of melody in (Poliner et al. 2007), and do an analysis in terms of instrumenta-tion, melodic features and energy salience. In order to understand the influence of the different steps in melody extraction algorithms, we also consider an inter-mediate representational level which corresponds to the pitch salience. We are interested in evaluating the ability of this initial step of most methods to identify the pitch corresponding to the melody as the more salient, since it affects the following steps. Furthermore, we consider multipitch estimation methods, since they are based on similar principles as salience functions and melody extraction methods, but allowing multiple melodic lines. Finally, we propose a method for the combination of algorithms that takes advantage of the estimated pitch salience to refine estimations. The results of this work are exploited to design a music understanding system intended for the visualisation of descriptors such as the melodic contour. With such purpose, we restate the standard methodol-ogy for melody extraction evaluation by proposing a set of evaluation measures which are specially suitable for this context. The main contributions of this paper are summarised as follows:
• a methodology for the creation of a melody extraction dataset by collect-ing human annotation data through scollect-ingcollect-ing, assesscollect-ing agreement among subjects and performing manual transcriptions;
• a reliable dataset for melody extraction in symphonic music, featuring challenging musical characteristics which had not previously been consid-ered in the literature;
• a detailed study of the challenges and potential of state-of-the-art pitch estimation algorithms for symphonic music, including an analysis of the influence of melodic characteristics, instrumentation, and energetic pre-dominance of the melody on their accuracy;
• the proposal of novel evaluation metrics which account for both pitch and time continuity, and
The remainder of this paper is organised as follows: the dataset and method-ology for its creation are presented in Section 2. An overview of the evaluated pitch estimation algorithms is provided in Section 3, including the proposed combination method. The evaluation methodology and results (including the definition of novel metrics) are presented in Section 4, which are further analysed and discussed in Section 5.
2
Evaluation dataset: definition and annotation
The creation of a dataset for automatic melody extraction in symphonic mu-sic has been a challenge, partially due to the lack of a established annotation methodology when there is more than one instrument playing the melody. In-spired by the definitions of melody in (Poliner et al. 2007; Selfridge-Field 1998), we collected excerpts in which human listeners agreed in their ‘essence’, that is, the sequence of notes that they hum or sing to represent it. The problem with interannotator agreement has been discussed in tasks such as chord recognition (Ni et al. 2013) or music similarity (Flexer 2014). Several MIR datasets have also involved more than one annotator during their creation, e.g. for structure analysis (Smith et al. 2011), instrument recognition (Bosch, Janer, et al. 2012) or melody extraction (Bittner et al. 2014).
In this work, the dataset creation comprised several tasks: excerpts selection, recording sessions, analysis of the recordings and melody annotation. We first describe the procedure followed to collect music audio excerpts and describe the final music collection in terms of duration, instruments playing the melody and melodic features (Section 2.1). We then provide further details on the designed methodology for human annotation gathering (Section 2.2) and analysis of these annotations (Section 2.3).
2.1
Dataset description and statistics
The proposed dataset is focused on symphonies and symphonic poems, bal-lets suites and other musical forms interpreted by symphonic orchestras, mostly from the romantic period, as well as classical and 20th century pieces. Music recordings were taken from private collections, and selected to have an ade-quate recording audio quality. They were sampled to create short excerpts with a potential dominant melody, maximising the existence of voiced segments (containing a melody pitch) per excerpt.
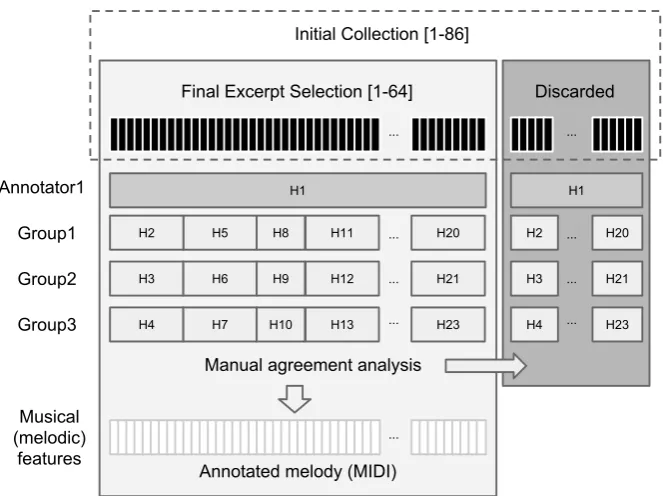
To verify that the excerpts contained a clear melody and identify the exact sequence of notes, we collected human annotations by recording subjects singing the melody, as described in section 2.2. From the starting set of excerpts, we selected those in which subjects agreed on the sequence of notes (melody), and annotated them as detailed in section 2.3. An overview of the whole process is shown in Figure 1.
The final collection, which is freely available for research purposes2, contains
64 audio excerpts with their corresponding annotation of the melody in MIDI format. The files were converted to mono combining left and right channels before executing the extraction, in order to ensure that all algorithms worked with exactly the same material.
2
The length of the excerpts ranges from 10 to 32 seconds (µ = 22.1 s., σ= 6.1 s.). For each excerpt we provide a text file with the sequence of melody pitches using a sampling period of 10 ms. If no melody pitch is annotated at a specific time, the frame is considered as unvoiced, otherwise it is consider as voiced. 93.69% of the frames of the dataset are labelled as voiced while 6.31% are unvoiced (in which case the pitch is set to be 0). The number of excerpts per composer are: Beethoven (13), Brahms (4), Dvorak (4), Grieg (3), Haydn (3), Holst (4), Mussorgsky (9), Prokofiev (2), Ravel (3), Rimsky-Korsakov (10), Schubert (1), Smetana (2), Strauss (3), Tchaikovsky (2), Wagner (1).
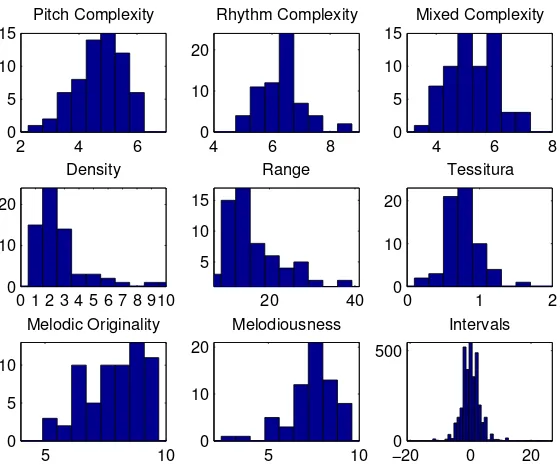
In order to understand the characteristic of the annotated melodies, we com-puted a set of statistics about instrumentation, pitch and rhythm related fea-tures. Regarding instrumentation, only in one of the excerpts there is a single instrument (oboe) playing the melody (with orchestral accompaniment). In the rest of the dataset, the melody is played by several instruments from an instru-ment section, or a combination of sections, or even alternating sections within the same excerpt. Figure 2 (left) illustrates the statistics of the predominant instrumental sections playing the melody. Figure 2 (right) depicts the distribu-tion of pitches of all frames of the dataset, and a Gaussian model (µ= 74.1, σ = 12.1). Using the MIDI Toolbox (Eerola and Toiviainen 2004), we computed a set of melodic descriptors for each of the ground truth MIDI files (containing the sequence of melody notes):
• Density: amount of notes per second.
• Range: difference in semitones between highest and lowest note pitch.
• Tessitura: melodic tessitura based on pitch deviation from median pitch height (Von Hippel 2000).
• Complexity (pitch, rhythm, mixed): expectancy-based model of melodic complexity (Eerola and North 2000) based either on pitch or rhythm-related components, or on a combination of them together.
• Melodiousness: ‘suavitatis gradus’ proposed by Euler, which is related to the degree of softness of a melody, and is a function of the prime factors of musical intervals (Leman 1995).
• Originality: Different measurement of melodic complexity, based on tone-transition probabilities (Simonton 1984).
per second, which also corresponds to the results obtained in (Dressler 2012b). Some differences with respect to the cited works are: the fact that our dataset presents a larger range of intervals, and that some excerpts present a higher amount of notes per second (and thus a lower inter-onset interval). Similar melodic features have been previously used in combination with classifiers to select the tracks containing the melody in a MIDI file (Rizo et al. 2006). In Sec-tion 4, we analyse the correlaSec-tion between the presented melodic characteristics and algorithm accuracy.
2.2
Recording sessions
We carried out recording sessions where subjects had to carefully listen to the audio samples twice and then sing or hum along with the audio three more times. As excerpts were repeated and relatively short, subjects could more easily memorize them. A total of 32 subjects with a varied musical background and a common interest in music took part in the recording sessions, including two of the authors. The instructions provided to the subjects were to ‘hum or sing the main melody (understood as the sequence of notes that best represent the excerpt)’. They were also instructed to focus on pitch information rather than on timing (onsets and offsets).
During the session, subjects rated how well they knew each of the excerpts before the experiment (ranking from 1 to 4). After the recordings, they also filled out a survey asking for their age, gender, musical background, amount of dedication to music playing, and a confidence rating of their own singing during the experiment, in terms of the percentage of melody notes that they considered they sang correctly (‘Less than 30%’, ‘30-60%’, ‘60-90%’, ‘More than 90%’). We discarded 9 subjects which could not properly accomplish the task, based on both their confidence (those which responded ‘Less than 30%’) and their performance in some excerpts, which contained an easy to follow single melodic line. The selected 23 subjects sang a subset of the collection, and were distributed to have three different subjects singing each excerpt. Additionally, the main author sang the whole collection, so finally there were four different subjects per excerpt, as shown in Figure 1.
Personal and musical background statistics of the selected annotators are: age (min=23, max=65, median=31.5), gender (‘male’ (66.7%), ‘female’ (33.3%)); musical background (‘None’ (16.7%), ‘Non-formal training’ (16.7%), ‘Formal training less than 5 years’ (0%) and ‘Formal training more than 5 years’ (66.7%)); dedication to music playing (‘None’ (16.7%), ‘Less than 2 hours per week’ (16.7%), ‘More than 2 hours per week’ (45.8%), ‘Professional musician’ (20.8%)).
2.3
Analysis of the recordings and annotation
some notes, notes which were not present in the piece but the participants sang, or from the presence of a chord in the excerpt, in which some subject sang a different note compared to the rest. In the final selection, we kept only the excerpts in which the four participants agreed in nearly all notes. In this process, we also considered the reported self-confidence on their singing, giving less importance to notes which disagree with the rest if they were sung by people with less self-confidence.
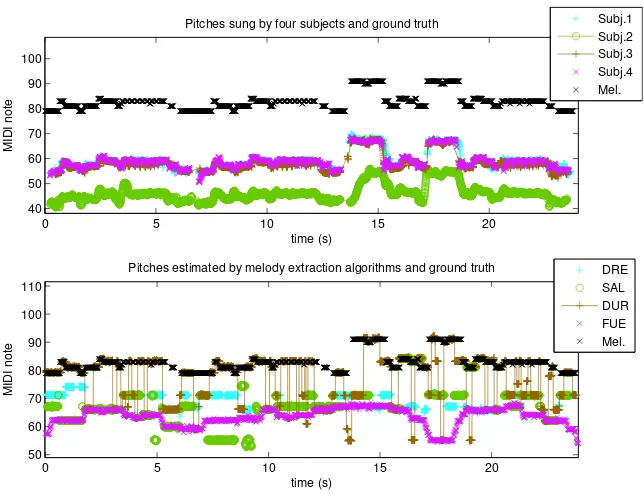
After selecting the excerpts, we manually transcribed the notes sung by the participants, adjusting onsets and offsets to the audio. Since vocal pitch range is different to the range of the instruments playing the main melody, notes were transposed to match the audio. For excerpts in which melody notes are simul-taneously played by several instruments in different octaves, we resolved the ambiguity by maximising the melodic contour smoothness (minimising jumps between notes). The recording sessions and the manual transcription of the melody notes were performed within a Digital Audio Workstation (Cubase 5), as shown in Figure 4. Figure 5 (top) shows the pitches sung by the four sub-jects, as well as the annotation of the melody for one of the excerpts. We observe that all subjects follow a similar melodic contour despite some slight differences, in some cases in different octaves (related to the gender of the anno-tator). An analysis of the pitch curves derived from the recordings showed that the agreement between subjects is correlated with some melodic features of the excerpts (Bosch and G´omez 2014). Specifically, there is a negative correlation with melodic density and complexity (specially pitch complexity).
3
Evaluated Approaches
The problem of mapping a sound signal from time-frequency domain to a ‘time-pitch’ domain has turned out to be especially hard in the case of polyphonic signals where several sound sources are active at the same time. Multipitch (multiplef0) estimation can be considered as one of the main challenges in the
MIR field, as they need to deal with masking, overlapping tones, mixture of harmonic and non-harmonic sources and the fact that the number of sources might be unknown (Schedl, G´omez, and Urbano 2014). Given the complex-ity of the musical material in consideration, it would be virtually impossible with current methods to estimate and track all present pitches. A simplified version of this problem is multiple f0 estimation on simple polyphonies. The
performance obtained by multipitch estimation methods recently reached 72% note accuracy for relatively simple music material, such as quartet, woodwind quintet recordings, and rendered MIDI, with a maximum polyphony of 5 notes. While the focus of this work is set on the melody extraction task, we also consider multiple pitch estimation methods, in order to investigate if the set of estimated pitches at a given time frame includes the pitch annotated as ‘melody’, as further detailed in Section 4. An important similarity between melody extraction and multiple pitch estimation methods is the use of pitch salience functions as an intermediate representational level. Their purpose is to create a time-frequency representation that assigns prominence tof0 values
After the computation of pitch salience, both melody extraction and multipitch estimation methods commonly use perceptual principles or additional musical knowledge (timbre, harmonicity, spectral smoothness, etc.) to separate partials and group salience peaks into streams, or even map them to a given pitched source. They may also perform polyphony estimation or voicing detection, following different approaches (commonly using a threshold). An analysis of each of the building blocks allows a better understanding of the characteristics of such methods.
We selected a total of eleven algorithms for evaluation, considering their relevance in the state of the art, availability (ideally as open source software, or by having access to their estimations on our dataset), and their performance in MIREX (audio melody extraction and multiple pitch estimation). An overview of the evaluated methods is provided in Table 1. We labelled each algorithm according to its type (SF: salience function, MP: Multiple Pitch estimation, ME: Melody extraction), and the three first letters of the first author’s surname to refer to a specific method (e.g. SF-DUR refers to the salience function by Durrieu in (Durrieu, David, and Richard 2011)). We evaluated the methods using the original implementation by the authors. We adapted the minimum and maximum pitches to fit the range of our dataset according to Figure 2 (right) (from 103 Hz to 2.33KHz), in all algorithms except SF-SAL, ME-SAL, ME-DRE and MP-DRE, which are not configurable to these values.
3.1
Salience functions
Salience functions ideally only contain clear peaks at the frequencies correspond-ing to the pitches present at a given instant. A commonly used pitch salience function is harmonic summation (Klapuri 2006), a frequency domain approach which computes the salience of each pitch by summing the energy of the spec-trum bins which contribute to that pitch, weighted by the strength of their contribution. This approach is computationally inexpensive and has been used successfully in a variety of forms for predominant melody extraction (Salamon and G´omez 2012; Dressler 2012b) as well as multiple pitch estimation (Dressler 2012a). More recently, probabilistic approaches based on decomposition models such as Non-negative Matrix Factorisation (NMF) have gained more interest, especially within source separation scenarios (Marxer 2013; Durrieu, David, and Richard 2011), but also for music transcription (Benetos and Dixon 2011; Carabias-Orti et al. 2011; Smaragdis and Brown 2003).
The computation of pitch salience in the evaluated algorithms starts with a time-frequency transformation such as the Short-Time Fourier Transform (STFT) (Salamon and G´omez 2012; Durrieu, David, and Richard 2011; Marxer 2013; Duan, Pardo, and Zhang 2010), multi-resolution transforms (MRFFT) (Dressler 2012b) or constant-Q transform (CQT) (Cancela, L´opez, and Ro-camora 2010; Fuentes et al. 2012; Benetos and Dixon 2011). Some of them perform a pre-processing step such as Equal-Loudness Filters (ELF) (Salamon and G´omez 2012; Marxer 2013), or a posterior step like frequency refinement (Salamon and G´omez 2012).
The approach by Salamon and G´omez (2012) computes the salience based on harmonic summation. Cancela, L´opez, and Rocamora (2010)3propose a
multi-3
resolution Fan Chirp Transform (FChT), which uses a Gaussian pitch preference function that we adjusted to the statistics of this dataset as in the cited work: tripling the standard deviation (σ= 36.3) and with the same mean (µ= 74.1) compared to the fitted Gaussian model from Figure 2 (right).
A different approach is taken by Durrieu, David, and Richard (2011)4, that
aims to model the signal first, using a source/filter model, and applying Non-negative Matrix Factorisation (NMF) to estimate the salience of the pitches. Finally, Marxer (2013) follows a similar strategy as Durrieu, David, and Richard (2011), but instead of using NMF, a Tikhonov Regularisation (TR) is employed, which is computationally cheaper and allows low-latency processing.
Two examples of pitch salience functions in the musical context under consid-eration are shown in Figure 6. The plot at the top corresponds to the approach by Salamon and G´omez (2012), implemented in the VAMP plugin MELODIA5.
As it can be observed, there is no clearly salient melodic line using this salience function. The proposed dataset is thus specially challenging for melody extrac-tion algorithms based on harmonic summaextrac-tion. The plot at the bottom corre-sponds to the pitch salience computed with the approach by Durrieu, David, and Richard (2011), which is visibly much sparser.
3.2
Multiple pitch estimation
Multipitch methods initially calculate a pitch salience function, and then per-form refinement or tracking to smooth pitch trajectories. For instance, Duan, Pardo, and Zhang (2010) estimate the pitches present with a Maximum Likeli-hood (ML) approach assuming spectral peaks at harmonic positions and lower energy elsewhere. They then employ a neighbourhood refinement method to create a pitch histogram in the vicinity of a frame to eliminate transient estima-tions, as well as to refine the polyphony estimation. We evaluated two variants of this method, one with refinement DUA-Ref), and one without it (MP-DUA). In both cases, we did not use the polyphony estimation, so that both algorithms output all estimated pitches.
Benetos and Dixon (2011) use Shift-Invariant Probabilistic Latent Compo-nent Analysis (SIPLCA), which is able to support multiple instrument models and pitch templates, and uses a Hidden Markov Model (HMM) for tracking. In our evaluation, we did not consider tracking, and no threshold for polyphony estimation, so as to only consider the intermediate non-binary pitch represen-tation (MP-BEN).
Dressler (2012a) uses a salience function based on the pair-wise comparison of spectral peaks (which is not available for evaluation), and streaming rules for tracking. MP-DRE is a more recent implementation of this method, with the main difference that it outputs more pitches, which are not ordered by salience.
3.3
Melody extraction
There are different strategies for melody extraction, which are commonly divided into salience-based and separation-based (Salamon, G´omez, et al. 2014). The former start by computing a pitch salience function and then perform tracking and voicing detection, and the latter perform an initial melody separation stage
4
https://github.com/wslihgt/IMMF0salience 5
(which is more or less explicit depending on the approach) and then estimate both pitch and voicing.
We evaluate two salience-based (Salamon and G´omez (2012)5, and Dressler
(2012b)) and two separation-based approaches (Fuentes et al. (2012)6, and
Dur-rieu, Richard, et al. (2010)7). Salamon and G´omez use the previously introduced
pitch salience function and then create contours, which are used to do the track-ing and filtertrack-ing of the melody ustrack-ing ad-hoc rules. Dressler uses almost the same system as in Dressler (2012a), except for the frequency range in the selection of pitch candidates, which is narrower in the case of melody extraction. Fuentes et al. (2012) use PLCA on a CQT to build a pitch salience function, and Viterbi smoothing to estimate the melody trajectory. Durrieu, Richard, et al. (2010) use the pitch salience previously introduced, and a Viterbi algorithm for tracking. Voicing detection (deciding if a particular time frame contains a pitch belong-ing to the melody or not) is approached by the evaluated algorithms usbelong-ing a dynamic threshold (Dressler 2012b), an energy threshold (Durrieu, Richard, et al. 2010; Fuentes et al. 2012), or a salience distribution strategy (Salamon and G´omez 2012).
Figure 5 (bottom) shows the pitches estimated by the four melody extraction algorithms, as well as the annotation of the melody. As it can be observed, this is a challenging excerpt since there are many estimation errors (including octave errors) with all of the algorithms, as well as jumps between octaves.
3.4
Proposed combination method
We propose a hybrid method that combines the output of several pitch salience functions and then performs peak detection and neighbourhood-based refine-ment. The main assumption is that if several algorithms agree on the estima-tion of a ‘melody’ pitch, it is more likely that the estimaestima-tion is correct. Related works also use agreement between algorithms for beat estimation (Holzapfel et al. 2012; Zapata, Davies, and G´omez 2014).
The proposed salience function is created frame-by-frame, placing a Gaus-sian with σsemitones standard deviation in the output pitches of each of the algorithms, weighted by the estimated salience of the pitch, and then summing all Gaussians. The selected value ofσ was 0.2, so that the maximum value of the sum of two Gaussians separated more than a quarter tone is not higher than the maximum value of both Gaussians.
Another option would be to combine the raw salience functions, however our method remains more generic since it could be equally applied to methods es-timating multiple discrete pitches. Additionally, the use of Gaussian functions allows to cope with small differences between the estimated and the melody pitch. Since each algorithm has a different pitch salience range, we normalise the values before combining them, so that the sum of the salience of all fre-quency bins in a given frame is equal to 1 (following probabilistic principles). Finally, we multiply the salience values of each of the methods (M) by a differ-ent value (αM ∈[0,1]), allowing a weighted combination. A value ofαM = 0 is
thus equivalent to not including a method in the combination. An example of the combination of salience functions is given in Figure 7, where three salience
6
http://www.benoit-fuentes.fr/articles/Fuentes2012 ICASSP/index.html 7
functions with the same weight (αM AR, αDU R, αCAN = 1) agree on the
estima-tion of pitches around MIDI notes 75 and 87, while only one of them estimates pitches around MIDI notes 74 and 77. This gives a maximum salience in the sum (combination) to the pitch around 75, which corresponds to the annotated melody pitch. After the addition, we extract the N highest peaks with a min-imum difference of a quarter tone between them. We denote this method as: COMB.
A further refinement step is then performed to remove the f0 estimates
inconsistent with their neighbours, with a method similar to the one employed in MP-DUA-Ref (Duan, Pardo, and Zhang 2010). Our contribution is to weight each of the estimated pitches with its salience when computing the histogram, as opposed to the original method, which gives the same weight to all estimated pitches in a frame, regardless of their (estimated) salience. We denote this method as RCOMB. In the evaluation, the maximum number of peaks extracted was set to N=10. Higher values of N did not change in any significant way the obtained results. The same maximum value is also used for the rest of salience functions and multipitch algorithms.
We tested several combinations of SF-DUR, SF-CAN, SF-SAL and SF-MAR with different weights, in order to find the best performing configuration. We conducted a 5 fold cross validation with 20% of the dataset for training, and 80% for testing. The combinations are named: COMB, and RCOMB for the refined version, followed by theαvalue and the identifier of each of the salience functions (e.g. COMB-0.5SAL-1DUR). We also use the name: RNSCOMB for the combination refined with the original method from (Duan, Pardo, and Zhang 2010) (which is the same as RCOMB but does not use estimated salience information).
4
Evaluation Methodology
Three types (SF, MP, ME) of pitch estimation algorithms are evaluated on the proposed dataset. We are interested on the evaluation of both complete melody extraction algorithms, as well as intermediate representational levels in order to better understand the origin of differences between methods’ results. Specif-ically, we evaluate the ability of salience functions and multipitch methods to output the ground truth pitch of the melody within the N most salient estimates. The motivation behind this evaluation strategy is twofold: first to understand which methods obtain better accuracy when estimating the melody pitch, and second to analyse the number of estimates that each of the methods needs to output, in order to have the ground truth pitch among the pitch estimates. This would be useful for tasks such as pitch tracking, since we would like to reduce the number off0’s to be tracked.
4.1
Standard Metrics
Melody extraction algorithms are commonly evaluated by comparing their out-put against a ground truth, corresponding to the sequence of pitches that the main instrument plays. Such pitch sequence is usually created by employing a monophonic pitch estimator on the solo recording of the instrument playing the melody (Bittner et al. 2014). Pitch estimation errors are then usually corrected by the annotators. In our case, the ground truth is a sequence of notes corre-sponding to the annotated melody, from which we derived a sequence of pitches at intervals of 0.01s.
The evaluation in MIREX8 focuses on both voicing detection and pitch
es-timation itself. An algorithm may report an estimated melody pitch even for a frame which is considered unvoiced. This allows the evaluation of voicing and pitch estimation separately. Voicing detection is evaluated using metrics from detection theory, such as voicing recall (Rvx) and voicing false alarm (F Avx)
rates. We define a voicing indicator vectorv, whoseτthelement (υ
τ) has a value
of 1 when the frame contains a melody pitch (voiced), and 0 when it does not (unvoiced). We define the ground truth of such vector as v∗. We also define
¯
υτ = 1−υτ as an unvoicing indicator.
• Voicing recall rateis the proportion of frames labelled as melody frames in the ground truth that are estimated as melody frames by the algorithm.
Rvx=
P
τυτυ
∗
τ
P
τυτ∗
(1)
• Voicing false alarm rate is the proportion of frames labelled as non-melody in the ground truth that are mistakenly estimated as non-melody frames by the algorithm.
F Avx=
P
τυτυ¯∗τ
P
τυ¯τ∗
(2)
Pitch estimation is evaluated by comparing the estimated and the ground truth pitch vectors, whoseτth elements aref
τ andfτ∗ respectively. Most
com-monly used accuracy metrics are raw pitch (RP) and raw chroma accuracy (RC). Another metric used in the literature is the concordance measure, or weighted raw pitch (WRP) which linearly weights the score of a correctly detected pitch by its distance in cents to the ground truth pitch. Finally, the overall accu-racy (OA) is used as a single measure to measure the performance of the whole system:
• Raw Pitch accuracy (RP) is the proportion of melody frames in the ground truth for which the estimation is considered correct (within half a semitone of the ground truth).
RP =
P
τυ
∗
τT [M(fτ)− M(fτ∗)]
P
τυ
∗
τ
(3)
T and Mare defined as: 8
T[a] =
(
1, if|a|<0.5
0, else (4)
M(f) = 12 log2(f) (5)
wheref is a frequency value in Hertz.
• Raw Chroma accuracy (RC)is a measure of pitch accuracy, in which both estimated and ground truth pitches are mapped into one octave, thus ignoring the commonly found octave errors.
RC=
P
τυ
∗
τT [k M(fτ)− M(fτ∗)k12]
P
τυτ∗
=PNch
τυτ∗
(6)
wherekak12=a−12⌊12a +0.5⌋, andNchrepresents the number of chroma
matches.
• Overall Accuracy (OA) measures the proportion of frames that were correctly labelled in terms of both pitch and voicing
OA= 1 Nf r
X
τ
υ∗
τT [M(fτ)− M(fτ∗)] +υτ∗υτ (7)
whereNf ris the total number of frames.
In the case of pitch salience functions and multipitch algorithms, only the estimated pitch which is closest to the ground truth (in cents) is used in each frame for the calculation of raw pitch related measures (equation 3). For chroma related measures, we create the sequencepcchby keeping in each frame the pitch
(in cents) which is both correct in chroma (chroma match) and closer in cents to the ground truth, or we set a 0 otherwise. For instance, if the ground truth is 440 Hz, and the output pitches are 111 Hz, 498 Hz and 882 Hz (N=3) we would keep the last one.
In a similar way as with the proposed combination method, for pitch salience functions we also extract the N=10 highest peaks with a minimum difference of a quarter tone between them, and order them by salience. For multipitch algorithms, we select a maximum of 10 estimates (commonly they output less than 10 pitches). In the case of MP-DRE, pitches are not ordered by salience, so we just consider N=10.
4.2
Proposed Metrics
• Weighted Raw Chroma accuracy (W RC) measures the distance in octaves (ODi) between the correct chroma estimates and the ground truth
pitches. The parameterβ ∈[0,1] is introduced to control the penalisation weight due to the difference in octaves. If β is low the value of W RC tends toRC, and ifβ is highW RC tends toRP.
ODi=round
h
(pcch
i −pi)/1200
i
(8)
Echi =min(1, β· |ODi|) (9)
W RC=
P
i(1−Echi)
Nvx
·100 (10)
where i is the index of a voiced frame with a chroma match, pi is the
value in framei of the ground truth pitch,pcch
i is the value in frame i of
the sequencepcch,N
vx is the number of voiced frames.
• Octave Jumps (OJ)is the ratio between the number of voiced frames in which there is a jump between consecutive correct estimates in chroma, and the number of chroma matches (Nch).
Ji= (ODi−ODi−1) (11)
OJ =count(|Ji|>0)/Nch·100 (12)
• Chroma Continuity (CC)quantifies errors due to octave jumps (EJ), and is influenced by their localization with respect to other octave jumps, as well as by the difference in octaves between estimated and ground truth pitch (Echi). The parameterλis introduced to control the penalty weight
due to the amount of octaves difference in an octave jump (Ji), and ranges
from 0 to 1. The lower the value ofλ, the moreCC tends to W RC.
EJi= min (1, λ· |Ji|) (13)
M EJi= max
k∈[i−w,i](EJk) (14)
CCi = 1−min(1, Echi+M EJi) (15)
CC=
P
i(CCi)
Nvx
·100 (16)
where w = min(F, i), F =round[L/H], L is the length in seconds of the region of influence of an octave jump, and H is the hop size in seconds. The lower the value of Lthe moreCC tends to W RC.
The values of λ, β and L should be tuned according to the application where the algorithms will be used. The pitch range of analysis in our case spans 4.5 octaves, and thus the maximum distance between correct chroma estimates is ODmax
i = 4 octaves. We decide to linearly divide the errorEchi, and thus
we set a value ofβ = 1/ODmax
i = 0.25. We equally weight both octave jumps
and octave errorsβ =λ= 0.25, and setL= 0.2 s.
5
Results and Discussion
In this section we present and discuss our evaluation results. Section 5.1 provides an overview of algorithm performance. Section 5.2 provides a deeper analysis and discussion on the results obtained by melody extraction methods, including the influence of instrumentation, melodic features and energetic predominance of the melody. Section 5.3 presents an analysis of how different methods can be combined in order to take advantage of the agreement between them. Section 5.4 discusses algorithms’ results with the proposed evaluation measures. Finally, Section 5.5 presents a generalizability study in order to assess the significance of these results.
5.1
Overview
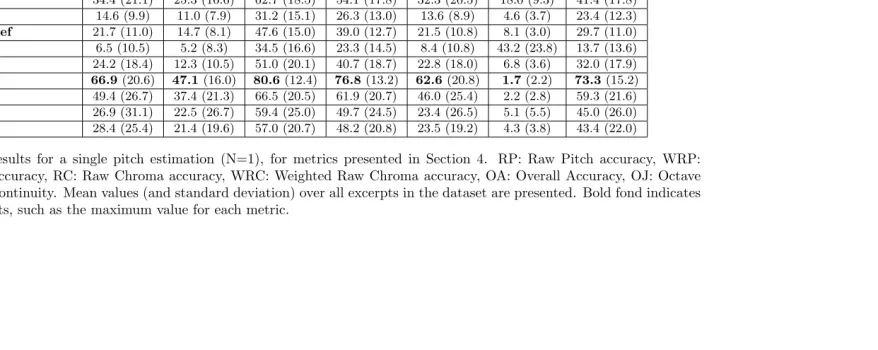
Table 2 summarizes the evaluation results of all considered methods for a single pitch estimate. Results for each evaluation metric are computed as an average of the results for each excerpt in the dataset. Additionally, standard devia-tions are presented between parentheses. We observe that the best performance is obtained by the melody extraction method ME-DUR for all metrics. Its raw pitch accuracy (RP) is equal to 66.9%. The difficulty of this material for state of the art approaches is evident since ME-SAL obtains up to 91% RP in the MIREX09+5dB dataset, and only 28.4% in our dataset. SF-DUR obtains the highest RP among all evaluated salience functions and multipitch methods (61.8%). Table 2 also presents results obtained with a combination of two meth-ods (SF-MAR and SF-DUR) with equal weight (α= 1) and two combination strategies: original (COMB) and with the proposed salience-based neighbour-hood refinement (RCOMB). The refined combination method increases the RP obtained with SF-DUR up to 64.8%. Further analysis about the proposed com-bination method is provided in Section 5.3.
In the case of multipitch estimation algorithms, the best accuracy for any value of N is obtained with MP-BEN, but is lower than any of the salience func-tions, possibly due to the fact that the instrument basis used is not applicable in large orchestral settings. MP-DRE obtains slightly lower results for N=10. Since this algorithm does not output pitch estimates ordered by salience, it is not possible to know accuracy results for lower values of N. MP-DUA does not perform as accurately even with refinement (MP-DUA-Ref). Possible causes include the use of a binary mask for the peak region in the definition of the likelihood, and the shape of the peaks, which may be significantly different than expected (Duan, Pardo, and Zhang 2010).
Given the potential of combining different methods, we further study the accuracy of the combination method with different weights. We performed a grid search with α∈ {0,0.5,1}, for each of the 4 salience functions (SF-MAR, SF-DUR, SF-CAN, SF-CLA). The highest raw pitch accuracies were always ob-tained withαDU R = 1, andαM AR, αSAL, αCAN = 0.5 or 0. We then performed
a finer search, with αDU R = 1, and αM AR, αSAL, αCAN ∈ {0,0.2,0.4,0.6}.
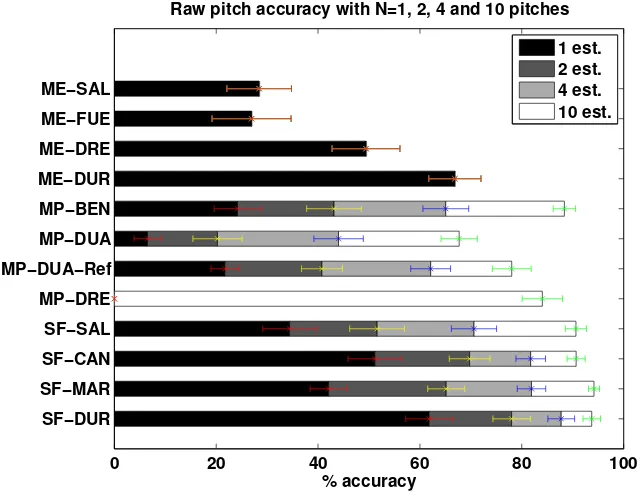
Figure 9 shows the results obtained in the testing set by the best performing combinations in the training set. We chose several combinations, with a differ-ent number of algorithms (from 2 up to 4). Results obtained with the proposed refinement method (RCOMB-) are also presented for two of the approaches, and results of SF-DUR are additionally included as a reference. The accuracy ob-tained with the weighted combination increases in comparison to the individual methods, specially with the proposed salience-based neighbourhood refinement, for all values of N.
A manual examination of the estimation errors suggests that the most chal-lenging excerpts contain chords and harmonisations of the melody, a highly energetic accompaniment, and in some cases percussion. Most accurate estima-tions are generally obtained in excerpts with a very predominant melody (e.g. those in which the orchestra plays in unison). A more detailed analysis of the influence of several musical characteristics is presented in the following section.
5.2
Discussion
5.2.1 Comparison between melody extraction methods
We here study the performance of melody extraction methods, and analyse the influence of their salience functions. The focus is set on ME-DUR and ME-SAL since their respective salience functions are also available for evaluation.
The accuracy obtained with SF-SAL, is the lowest compared to the rest of salience functions. In comparison to SF-DUR, it achieves 27.4 percentage points (pp) less RP for N=1, which partially explains that the complete melody extraction method (SAL) also performs much worse in comparison to ME-DUR (38.5 pp. less RP). Additionally, this rule-based approach (which obtained the highest overall accuracy in MIREX) seems to be tuned to the pitch contour features of vocal music (pop, jazz), and is not able to generalise to the character-istics of our dataset. The salience-based voicing detection is quite conservative in this dataset, and classifies only 57.4% of the frames as voiced, possibly due to the high dynamic range in symphonic music. For this reason, both false alarm rate and voicing recall are the lowest from all methods. Since the pro-posed dataset contains a high ratio of voiced versus unvoiced frames, the overall accuracy obtained with ME-SAL is more reduced than with other methods com-pared to the raw pitch accuracy. It is important to recall that even if only a part (57.4%) of the frames are estimated as melody pitches, for the calculation of metrics not related to voicing, we use both voiced and unvoiced estimated pitches (98.8% of frames in our dataset). The difference in the raw pitch esti-mation accuracy between ME-DUR and ME-SAL is thus not due to errors in voicing detection.
ME-DRE achieves higher accuracy than ME-SAL, possibly due to the fact that it does not assume specific features of human voice, and is thus more general. This agrees with the results obtained in datasets used in MIREX which contain non-vocal melodies, such as ADC2004 and MIREX05 (Salamon, G´omez, et al. 2014). However, the results in our dataset are not as good as those obtained with ME-DUR. Since we do not have access to the salience function used by ME-DRE (based on the pair-wise analysis of spectral peaks), it is difficult to get further insights on the limitations of this approach. A possible explanation of the better performance is the fact that the source filter model used by Durrieu adapts to the spectrum of the melody source even if it does not correspond to a single instrument, or even to a single instrumental section. Finally, ME-FUE presents the lowest accuracy in this dataset. Its probabilistic model and the smoothing method employed seem not to be adequate for this kind of data.
5.2.2 Influence of instrumentation
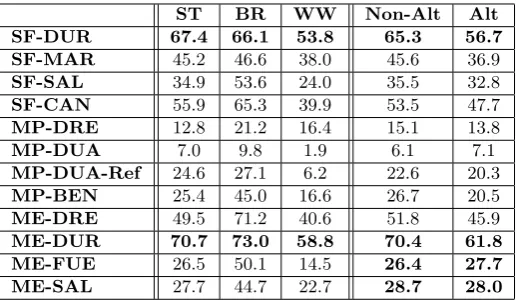
In order to illustrate the influence of instrumentation in algorithm performance, Table 3 presents mean RP results for excerpts with a melody predominantly played by either strings, brass or woodwinds sections. We also compute the mean RP for excerpts with a melody which is alternatingly played by two or more instrument sections, and compare it against results obtained from excerpts with no alternation. Although there is only a small number of excerpts for cer-tain instrument sections, we still identify some trends in algorithm performance. For instance, Table 3 shows that ME-SAL or ME-FUE are less influenced by the alternation of melody between instrument sections, while ME-DUR presents a higher difference in accuracy. This is probably due to the fact that SF-DUR aims to learn the timbre of the lead instrument for each excerpt, and if the tim-bre of the instrument playing the main melody changes throughout the excerpt, the extraction may be affected. However, even with alternating instruments, SF-DUR learns timbral basis that are generic (Durrieu, Richard, et al. 2010), and creates a salience function that outperforms the rest of algorithms in terms of pitch estimation accuracy. In contrast, ME-SAL does not exploit timbre, which explains why there is just a small difference between excerpts alternating and non-alternating instrumentation with both SF-SAL and ME-SAL.
According to Table 3, it is generally easier to extract the melody in excerpts in which it is played by the brass section, while in the case of the strings section, accuracies are generally lower. The relative decrease in accuracy reaches up to almost 50% in the case of ME-FUE. An important exception is ME-DUR, for which melodies played by strings are equally well recognised as with brass, probably due to the fact that timbral information is exploited by learning the lead instrument filter basis for each excerpt. This aspect has a large influence on the average results of this dataset, given the high percentage of excerpts which contain a string section playing the melody.
5.2.3 Influence of melodic characteristics
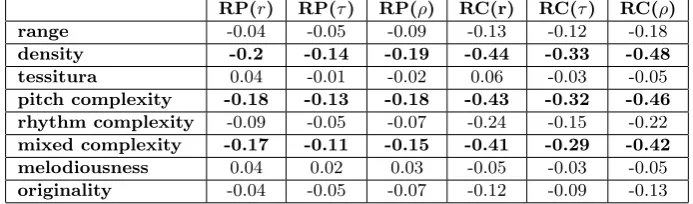
In order to study the influence of melodic characteristics (described in Section 2.1) on algorithm performance, we present a correlation analysis in Table 4. For the sake of simplicity, we analyse only melody extraction methods (ME-DUR, ME-DRE, ME-SAL, ME-FUE). Results obtained with three different correlation measures show that note density and pitch complexity are the features that most affect accuracy, while melodic originality and tessitura have almost no effect on it. Correlations are stronger with RC compared to RP, since some algorithms commonly produce octave errors (difference between RC and RP in Table 2).
5.2.4 Influence of energetic predominance of the melody
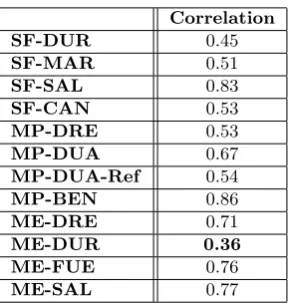
correlation between the estimated ratio and the accuracy results of each ex-cerpt, as shown in Table 5. In the case of salience functions (with N=1), we observe that SAL has the highest correlation (0.83). On the other hand, SF-DUR presents the lowest correlation (0.44). Other approaches such as SF-MAR (0.51) or SF-CAN (0.53) obtain intermediate correlations. This shows that the harmonic salience function used by SF-SAL is less capable than SF-DUR to identify melodic pitches as the most salient when they are not energetically predominant over the accompaniment. Since salience functions strongly affect the performance of whole melody extraction algorithm, ME-DUR presents the smallest correlation among them (0.36), while ME-SAL (0.76), ME-FUE (0.75) and ME-DRE (0.71) present much stronger correlations. These results sug-gest that separation-based approaches such as ME-DUR are specially useful in the context of orchestral classical music, since they are better able to ex-tract melodies played by non-predominant instruments, partially thanks to the melody-oriented pitch salience function.
5.3
Proposed combination method
In this section we analyse the performance obtained by combining the results of different algorithms, using the methodology presented in Section 3.4. The highest RP obtained in the training data with N=1, and no refinement reached 62.7%, with COMB-0.6MAR-1DUR-0.2CAN. This combination increases the accuracy obtained with SF-DUR alone in more than 1 pp. However, 7 different combinations obtained a RP with a difference of less than 0.1 pp compared to the maximum, all of them withαDU R = 1, and several combinations of weights
for the rest of algorithms. The best combination using only two algorithms was among them: COMB-0.6MAR-1DUR. For N = 2, best RP in the training set was obtained with: COMB-0.4MAR-1DUR-0.6CAN-0.2SAL, reaching 80.4%. The best combination with 3 algorithms is: COMB-0.5MAR-1DUR-0.5CAN, achieving 80.3% and with 2 algorithms, COMB-0.5MAR-1DUR achieved 79.5%. It is worth noting that other combinations, with different algorithms also pro-duce similar results: COMB-1DUR-0.4CAN-0.4SAL obtains 80.1%. For N=4 and N= 10, SF-DUR obtained 87.7%, 93.7% respectively, and the best combina-tions obtained a 3% absolute improvement in RP. Figure 9 shows the evaluation results for the test set. It is worth mentioning that raw pitch accuracies are very similar to the ones obtained in the training set. Also note that the best perform-ing combinations are those that give the highest weight to the salience function with highest raw pitch accuracy (SF-DUR), and lower weights to other salience functions (different ones depending on the value of N). As future work, we would like to study the influence of pitch range in the performance of each method, and use this to improve the combination method.
function (SF-MAR) obtains 94.2%. Additionally, the 95% confidence interval is smaller with the combination (98.9% 99.5%) than with SFSAL (93.1% -95.3%). We also observed that considering the salience of pitch estimates in the refinement step is crucial for a better performance, specially for small values of N, as we can see in the difference between RCOMB (refinement considering pitch salience) and RNSCOMB (refinement without considering pitch salience) in Figure 9.
Finally, we study the influence of the width of the Gaussian function used in the combination method. We evaluate the estimations obtained with different values of the standard deviation (σ), ranging from 0.05 to 1 in semitones. Even though the results vary slightly with the specific combination, we observe some general trends. The highest accuracy for N=10 is obtained with the default value σ= 0.2. The accuracy decreases with lower values of σ, since the combination only creates salience peaks if the pitches estimated by different methods are very close to each other. On the other hand, wider Gaussians (up to σ=0.8) allow some increase in accuracy for N=1 (less than 1 pp), since more distant pitches can be combined. However, if N increases, the accuracy decreases with wider Gaussians, because of the higher interference between all combined pitches.
5.4
Proposed evaluation measures
We have focused so far on two evaluation measures, raw pitch accuracy and over-all accuracy, which are useful to get a general understanding of the performance of the algorithms. However, we can gain further insights on their behaviour by means of the proposed metrics. For instance, the octave jumps ratio (OJ) is higher in methods where no tracking is performed, such as salience functions, as opposed to melody extraction algorithms. We also observe that the proposed neighbourhood refinement technique increases pitch continuity between correct estimates in chroma, since RCOMB has a lower OJ than COMB according to Table 2. The difference betweenW RC andRC shows that algorithms such as ME-DUR and ME-DRE estimate pitches at a closer octave to the ground truth octave, in comparison to ME-SAL or ME-FUE, since the latter present a higher difference. TheCC measure is useful to obtain information about both smooth-ness and accuracy of the extracted melodic contour, since it combines W RC, N J and localisation of jumps. As an example of the usefulness of this mea-sure, we observe that it allows us to differentiate between COMB and RCOMB, and to gain knowledge about their behaviour which can not be obtained with traditional MIREX measures. Both methods obtain quite similar RP and RC scores, but there is an important difference inCC. The novel metric reflects the fact that the pitch sequences estimated by RCOMB are much smoother thanks to the application of the refinement, which is a desirable property of a pitch estimation method, specially for visualisation purposes.
5.5
Generalisability Study
variability in evaluation results, which could arise from differences between algo-rithms, music excerpts, or the interaction effect between algorithms and music excerpts. Ideally, all variance should be due to differences between algorithms and not due to variability of the excerpts. If the considered music excerpts are very varied, or if differences between systems are too small, then we need many excerpts to ensure that our results are reliable.
The GT study has two stages: a Generalisability study (G-study), which estimates variance components on the evaluation results for each of the metrics, and a Decision study (D-study), which computes reliability indicators for a larger set of excerpts, based on the previous analysis of variance. We calculated two commonly used indicators: the index of dependability Φ, which provides a measure of the stability of absolute scores, and the generalisability coefficient Eρ2, which provides a measure of the stability of relative differences between
systems (the closer to one the better). For our collection, we obtained values of Φ andEρ2 over 0.97 forCC, as well as for pitch and voicing detection metrics.
This indicates that the variability of the scores was mostly due to differences between algorithms and not to differences between excerpts, which validates the obtained results. According to Salamon and Urbano (2012), some of the melody extraction datasets used in MIREX obtain the following values of Φ for raw pitch accuracy, when evaluating a larger set of state-of-the-art algorithms: ADC04 (Φ=0.86), MIREX05 (Φ=0.81), or INDIAN08 (Φ=0.72). Large scale collections for text information retrieval, obtain on average Eρ2 = 0.88 and
Φ=0.72 (Urbano, Marrero, and Mart´ın 2013). The proposed dataset is thus very reliable (Urbano, Marrero, and Mart´ın 2013), specially in comparison with commonly used collections for melody extraction evaluation.
6
Conclusions and Future Work
the combination of pitch estimation algorithms, which uses pitch salience for refinement, decreases the variance of the results and improves the accuracy.
In future work, the knowledge obtained in this evaluation will be used to design a specific approach for this repertoire. We also foresee exploiting the combination method to build a complete melody extraction method, and for other tasks such as audio-score alignment. It would also be of interest to conduct listening experiments to contrast evaluation metrics with human perception of algorithm quality. These results will be used to create a music visualisation system able to deal with the challenges of symphonic music.
Acknowledgements
We would like to thank the volunteers for participating in the recordings, the authors for giving us access to their algorithms or execution results, Julian Ur-bano for his comments and help, and the anonymous reviewers for their careful reading of our manuscript and their many insightful comments and suggestions. This work is supported by the European Union Seventh Framework Programme FP7 / 2007-2013 through the PHENICX project (grant agreement no. 601166). This work is also (partly) supported by the Spanish Ministry of Economy and Competitiveness under the Maria de Maeztu Units of Excellence Programme (MDM-2015-0502).
References
Benetos, E. and S. Dixon (2011). “Multiple-instrument polyphonic music tran-scription using a convolutive probabilistic model”. In:8th SMC Conf.Pp. 19– 24.
Bittner, R. et al. (2014). “MedleyDB: a multitrack dataset for annotation-intensive MIR research”. In:Proc. ISMIR, pp. 155–160.
Bosch, J. and E. G´omez (2014). “Melody extraction in symphonic classical mu-sic: a comparative study of mutual agreement between humans and algo-rithms”. In:9th Conference on Interdisciplinary Musicology – CIM14. Bosch, J., J. Janer, et al. (2012). “A Comparison of Sound Segregation
Tech-niques for Predominant Instrument Recognition in Musical Audio Signals”. In:Proc. ISMIR, pp. 559–564.
Bregman, A. (1994). Auditory scene analysis: The perceptual organization of sound. MIT press.
Cancela, P., E. L´opez, and M. Rocamora (2010). “Fan chirp transform for music representation”. In:Proc DAFx10, pp. 1–8.
Carabias-Orti, J. et al. (2011). “Musical instrument sound multi-excitation model for non-negative spectrogram factorization”. In: Selected Topics in Signal Processing, IEEE Journal of 5.6, pp. 1144–1158.
Dressler, K. (2012a). “Multiple fundamental frequency extraction for MIREX 2012”. In:Music Inf. Retr. Eval. Exch.
Duan, Z., B. Pardo, and C. Zhang (2010). “Multiple fundamental frequency estimation by modeling spectral peaks and non-peak regions”. In: Audio, Speech, Lang. Process. IEEE Trans.18.8, pp. 2121–2133.
Durrieu, J., B. David, and G. Richard (2011). “A musically motivated mid-level representation for pitch estimation and musical audio source separation”. In:
Sel. Top. Signal Process. IEEE J.5.6, pp. 1180–1191.
Durrieu, J., G. Richard, et al. (2010). “Source/filter model for unsupervised main melody extraction from polyphonic audio signals”. In:Audio, Speech, Lang. Process. IEEE Trans.18.3, pp. 564–575.
Eerola, T. and A. North (2000). “Expectancy-based model of melodic complex-ity”. In:Proc. Int. Conf. Music Perception and Cognition.
Eerola, T. and P. Toiviainen (2004). MIDI Toolbox: MATLAB Tools for Music Research. Jyv¨askyl¨a, Finland: University of Jyv¨askyl¨a.url: www.jyu.fi/ musica/miditoolbox/.
Flexer, A. (2014). “On Inter-rater Agreement in Audio Music Similarity”. In:
ISMIR, pp. 245–250.
Friberg, A. and S. Ahlb¨ack (2009). “Recognition of the main melody in a poly-phonic symbolic score using perceptual knowledge”. In:Journal of New Mu-sic Research 38.2, pp. 155–169.
Fuentes, B. et al. (2012). “Probabilistic model for main melody extraction using constant-Q transform”. In:IEEE ICASSP. IEEE, pp. 5357–5360.
G´omez, E., A. Klapuri, and B. Meudic (2003). “Melody description and extrac-tion in the context of music content processing”. In:Journal of New Music Research 32.1, pp. 23–40.
G´omez, E., G. Peterschmitt, et al. (2003). “Content-based melodic transforma-tions of audio material for a music processing application”. In:Proc. of the 6th International Conference on Digital Audio Effects (DAFx). Citeseer. Holzapfel, A. et al. (2012). “Selective sampling for beat tracking evaluation”.
In: Audio, Speech, and Language Processing, IEEE Transactions on 20.9, pp. 2539–2548.
Hu, N. and R. Dannenberg (2002). “A comparison of melodic database retrieval techniques using sung queries”. In: Proc. of the 2nd ACM/IEEE-CS joint conference on Digital libraries. ACM, pp. 301–307.
Huron, D. (2001). “Tone and voice: A derivation of the rules of voice-leading from perceptual principles”. In:Music Perception 19.1, pp. 1–64.
Klapuri, A. (2006). “Multiple fundamental frequency estimation by summing harmonic amplitudes”. In:Proc. ISMIR, pp. 216–221.
Klapuri, A., M. Davy, et al. (2006). Signal processing methods for music tran-scription. Vol. 1. Springer.
Leman, Marc (1995). Music and schema theory: cognitive foundations of sys-tematic musicology. eng. Springer.
Marxer, R. (2013). “Audio source separation for music in low-latency and high-latency scenarios”. PhD thesis. Universitat Pompeu Fabra, Barcelona, pp. 95–124.
Ni, Y. et al. (2013). “Understanding effects of subjectivity in measuring chord estimation accuracy”. In: Audio, Speech, and Language Processing, IEEE Transactions on 21.12, pp. 2607–2615.
Ringer, A. L. (2015). Melody. Grove Music Online, Oxford Music Online. Available: http://www.oxfordmusiconline.com/subscriber/article/ grove/music/18357. (Visited on 2015).
Rizo, D. et al. (2006). “A Pattern Recognition Approach for Melody Track Selection in MIDI Files”. In:Proc. ISMIR, pp. 61–66.
Salamon, J. and E. G´omez (2012). “Melody extraction from polyphonic music signals using pitch contour characteristics”. In:IEEE Trans. Audio. Speech. Lang. Processing 20.6, pp. 1759–1770.
Salamon, J., E. G´omez, et al. (2014). “Melody Extraction from Polyphonic Music Signals: Approaches, applications, and challenges”. In: IEEE Signal Process. Mag.31, pp. 118–134.
Salamon, J., B. Rocha, and E. G´omez (2012). “Musical Genre Classification using Melody Features Extracted from Polyphonic Music Signals”. In:IEEE Int. Conf. on Acoustics, Speech and Signal Processing (ICASSP). Kyoto, Japan, pp. 81–84.
Salamon, J. and J. Urbano (2012). “Current Challenges in the Evaluation of Predominant Melody Extraction Algorithms”. In: Proc. ISMIR, pp. 289– 294.
Schedl, M., E. G´omez, and J. Urbano (2014). “Music Information Retrieval: Recent Developments and Applications”. In:Foundations and Trends in In-formation Retrieval 8, pp. 127–261.
Selfridge-Field, E. (1998). “Conceptual and representational issues in melodic comparison”. In:Computing in musicology: a directory of research11, pp. 3– 64.
Simonton, D.K. (1984). “Melodic structure and note transition probabilities: A content analysis of 15,618 classical themes”. In:Psychology of Music 12.1, pp. 3–16.
Smaragdis, P. and J. Brown (2003). “Non-negative matrix factorization for poly-phonic music transcription”. In: Proc. IEEE Workshop on Applications of Signal Processing to Audio and Acoustics. IEEE, pp. 177–180.
Smith, J. et al. (2011). “Design and creation of a large-scale database of struc-tural annotations”. In:ISMIR. Vol. 11, pp. 555–560.
Urbano, J., M. Marrero, and D. Mart´ın (2013). “On the measurement of test collection reliability”. In:Proc. 36th Int. ACM SIGIR Conf. Res. Dev. Inf. Retr.ACM, pp. 393–402.
Von Hippel, P. (2000). “Redefining pitch proximity: Tessitura and mobility as constraints on melodic intervals”. In:Music Perception, pp. 315–327. Zapata, J. R., M.E.P Davies, and E. G´omez (2014). “Multi-feature beat
Type (Pre Proc.)+Transform Salience/Multif0 Estim. Tracking Voicing/Polyph.
Cancela, L´opez, and Rocamora (2010) SF* CQT FChT -
-Durrieu, David, and Richard (2011) SF* STFT NMF on S/F model -
-Marxer (2013) SF* (ELF)+STFT TR -
-Salamon and G´omez (2012) SF* (ELF)+STFT+IF Harmonic summ. -
-Benetos and Dixon (2011) MP CQT SIPLCA [HMM] [HMM]
Dressler (2012b) and Dressler (2012a) MP&ME MRFFT Spectral peaks comparison Streaming rules Dynamic thd. Duan, Pardo, and Zhang (2010) MP STFT ML in frequency [Neighbourhood refin.] [Likelihood thd].
Durrieu, Richard, et al. (2010) ME STFT NMF on S/F model HMM Energy thd.
Fuentes et al. (2012) ME CQT PLCA on the CQT HMM Energy thd.
[image:26.595.99.708.192.310.2]Salamon and G´omez (2012) ME (ELF)+STFT+IF Harmonic summ. Contour-based Salience-based
Table 1: Overview of evaluated approaches. The star (*) symbol denotes that pitch salience values were extracted for each of the estimated pitches. Square brackets denote that either tracking or polyphony estimation is not used in the evaluation. In the case of MP-DUA, two versions are considered, with and without refinement. STFT: Short Time Fourier Transform, IF: Instantaneous Frequency estimation, CQT: Constant-Q Transform, AF: Auditory Filterbank, NT: Neural Transduction, ELF: Equal-Loudness Filters, MRFFT: Multi-Resolution Fast Fourier Transform, FChT: Fan Chirp Transform, NMF: Non-negative Matrix Factorisation, TR: Tikhonov Regu-larisation, (SI)PLCA: (Shift-Invariant) Probabilistic Latent Component Analysis, S/F: Source/Filter, ML: Maximum Likelihood, HMM: Hidden Markov Model.
RP WRP RC WRC OA OJ CC RCOMB-1MAR-1DUR 64.8(18.6) 47.2 (15.6) 79.3 (12.8) 75.5 (13.2) 60.6 (18.9) 2.2 (1.9) 70.6(14.4)
COMB-1MAR-1DUR 61.6(17.4) 44.8 (14.6) 77.5 (11.9) 73.3 (12.2) 57.5 (17.7) 11.3 (8.0) 62.7(14.3)
SF-DUR 61.8(18.4) 43.2 (14.2) 77.1 (12.5) 73.0 (13.0) 57.8 (18.7) 11.7 (8.3) 62.5 (15.1)
SF-MAR 42.1 (14.5) 30.7 (12.3) 68.9 (14.3) 61.6 (13.3) 39.3 (14.4) 11.1 (4.9) 48.4 (12.2)
SF-CAN 51.2 (21.1) 35.1 (16.9) 74.8 (13.1) 68.4 (13.0) 48.0 (20.7) 12.3 (9.4) 57.0 (16.2)
SF-SAL 34.4 (21.1) 25.3 (16.6) 62.7 (18.5) 54.1 (17.8) 32.3 (20.5) 18.0 (9.3) 41.4 (17.8)
MP-DRE 14.6 (9.9) 11.0 (7.9) 31.2 (15.1) 26.3 (13.0) 13.6 (8.9) 4.6 (3.7) 23.4 (12.3)
MP-DUA-Ref 21.7 (11.0) 14.7 (8.1) 47.6 (15.0) 39.0 (12.7) 21.5 (10.8) 8.1 (3.0) 29.7 (11.0)
MP-DUA 6.5 (10.5) 5.2 (8.3) 34.5 (16.6) 23.3 (14.5) 8.4 (10.8) 43.2 (23.8) 13.7 (13.6)
MP-BEN 24.2 (18.4) 12.3 (10.5) 51.0 (20.1) 40.7 (18.7) 22.8 (18.0) 6.8 (3.6) 32.0 (17.9)
ME-DUR 66.9(20.6) 47.1(16.0) 80.6(12.4) 76.8(13.2) 62.6(20.8) 1.7(2.2) 73.3(15.2)
ME-DRE 49.4 (26.7) 37.4 (21.3) 66.5 (20.5) 61.9 (20.7) 46.0 (25.4) 2.2 (2.8) 59.3 (21.6)
ME-FUE 26.9 (31.1) 22.5 (26.7) 59.4 (25.0) 49.7 (24.5) 23.4 (26.5) 5.1 (5.5) 45.0 (26.0)
[image:27.595.156.679.181.356.2]ME-SAL 28.4 (25.4) 21.4 (19.6) 57.0 (20.7) 48.2 (20.8) 23.5 (19.2) 4.3 (3.8) 43.4 (22.0)
Table 2: Evaluation results for a single pitch estimation (N=1), for metrics presented in Section 4. RP: Raw Pitch accuracy, WRP: Weighted Raw Pitch accuracy, RC: Raw Chroma accuracy, WRC: Weighted Raw Chroma accuracy, OA: Overall Accuracy, OJ: Octave Jumps, CC: Chroma Continuity. Mean values (and standard deviation) over all excerpts in the dataset are presented. Bold fond indicates specially relevant results, such as the maximum value for each metric.
ST BR WW Non-Alt Alt SF-DUR 67.4 66.1 53.8 65.3 56.7 SF-MAR 45.2 46.6 38.0 45.6 36.9
SF-SAL 34.9 53.6 24.0 35.5 32.8
SF-CAN 55.9 65.3 39.9 53.5 47.7
MP-DRE 12.8 21.2 16.4 15.1 13.8
MP-DUA 7.0 9.8 1.9 6.1 7.1
MP-DUA-Ref 24.6 27.1 6.2 22.6 20.3
MP-BEN 25.4 45.0 16.6 26.7 20.5
ME-DRE 49.5 71.2 40.6 51.8 45.9
[image:28.595.168.428.313.463.2]ME-DUR 70.7 73.0 58.8 70.4 61.8 ME-FUE 26.5 50.1 14.5 26.4 27.7 ME-SAL 27.7 44.7 22.7 28.7 28.0
RP(r) RP(τ) RP(ρ) RC(r) RC(τ) RC(ρ) range -0.04 -0.05 -0.09 -0.13 -0.12 -0.18
density -0.2 -0.14 -0.19 -0.44 -0.33 -0.48 tessitura 0.04 -0.01 -0.02 0.06 -0.03 -0.05
pitch complexity -0.18 -0.13 -0.18 -0.43 -0.32 -0.46 rhythm complexity -0.09 -0.05 -0.07 -0.24 -0.15 -0.22
mixed complexity -0.17 -0.11 -0.15 -0.41 -0.29 -0.42 melodiousness 0.04 0.02 0.03 -0.05 -0.03 -0.05
[image:29.595.122.469.343.445.2]originality -0.04 -0.05 -0.07 -0.12 -0.09 -0.13
Correlation
SF-DUR 0.45
SF-MAR 0.51
SF-SAL 0.83
SF-CAN 0.53
MP-DRE 0.53
MP-DUA 0.67
MP-DUA-Ref 0.54
MP-BEN 0.86
ME-DRE 0.71
ME-DUR 0.36
ME-FUE 0.76
[image:30.595.225.371.323.475.2]ME-SAL 0.77
Figure 1: Dataset creation process. H1, H2, etc. refer to the recordings of each of the annotators, which correspond to several excerpts. Group1, Group2 and Group3 refer to different sets of subjects, and Annotator1 refers to the main author, who annotated all excerpts.
Figure 2: Distribution of the sections of the instruments playing the main melody (left) (ST: Strings, BR: Brass, WW: Woodwinds), where Alt- denotes that the sections alternate within the excerpt. Distribution and Gaussian model of the annotated ‘melody’ pitches (right).
Figure 3: Distribution of the melodic features.
Figure 4: Recordings and annotation of the melody in a Digital Audio Work-station.
Figure 5: Pitches sung by four subjects and annotation of the melody, for an excerpt of the 4th movement of Dvoˇr´ak’s 9th Symphony (top). Pitches estimated by four melody extraction methods and melody annotation for the same excerpt (bottom).
Figure 6: Pitch salience functions estimated from an excerpt of the 1st move-ment of Beethoven’s 3rd symphony. They were computed with MELODIA (top) and Durrieu’s approach (bottom), as VAMP plugins in Sonic Visualiser. Verti-cal axis corresponds to the frequency between 55 and 1760 Hz, in logarithmic scale. Horizontal axis corresponds to time, from 0 to 10 seconds. Both salience functions have been normalised per frame, for a better visualisation.
Figure 7: Gaussians centred at the pitches estimated by three salience func-tions (SF-MAR, SF-DUR and SF-CAN) at a given frame, and the sum of them (COMB). The maximum peak of the combination is found at the annotation of the melody pitch (vertical dashed line).
Figure 8: Mean raw pitch accuracy for N=1,2,4 and 10 pitch estimates. Bars represent 95% confidence intervals. For MP-DRE we only provide the measure for N=10 as the output pitches are not ordered by salience.
Final Excerpt Selection [1-64] Discarded
H4
H1
H7 H10 H23
H3 H6 H9 H12 H21
H5 H8 H11 H20
H13 H4
H3 H2
H23 H21 H20 H1
Initial Collection [1-86]
H2 ...
...
... ...
...
...
... ...
...
Group1
Group2
Group3 Annotator1
Manual agreement analysis
Annotated melody (MIDI) Musical
[image:32.595.134.466.122.370.2](melodic) features