INVESTIGATION OF THE EFFECT OF RASTER ANGLE AND
LAYER THICKNESS ON MECHANICAL PROPERTIES OF FUSED
DEPOSITION MODELING (FDM) PARTS
This report is submitted in accordance with requirement of the Universiti Teknikal Malaysia Melaka (UTeM) for Bachelor Degree of Manufacturing Engineering
(Manufacturing Design) (Hons.)
by
TING HUI YIN B051310080 930225-06-5448
DECLARATION
I hereby, declared this report entitled “Investigation of The Effect of Raster Angle And Layer Thickness On Mechanical Properties of Fused Deposition Modeling (FDM) Parts” is
the results of my own research except cited in reference.
Signature : ………. Author’s Name : TING HUI YIN
APPROVAL
This report is submitted to the Faculty of Manufacturing Engineering of UTeM as a partial fulfillment of the requirements for the degree of Bachelor of Manufacturing Engineering (Manufacturing Design) (Hons.). The members of the supervisory committee are as follow:
i
ABSTRAK
ii
ABSTRACT
iii
DEDICATION
I would like to dedicate this work to my
Beloved parents
Honorable supervisor and lecturers
iv
ACKNOWLEDGEMENT
v
TABLE OF CONTENT
Abstrak i
Abstract ii
Dedication iii
Acknowledgement iv
Table of Content v
List of Tables viii
List of Figures xi
List of Abbreviations xiv
List of Symbols xv
CHAPTER 1: INTRODUCTION 1
1.1 Background 1
1.2 Problem Statement 3
1.3 Objective 4
1.4 Scope of Study 4
1.5 Activity Planning 4
CHAPTER 2: LITERATURE REVIEW 5
2.1 Definitions of AM 5
2.2 Classification of AM and AM system 6
2.2.1 Fused Deposition Modeling (FDM) 7
2.2.2 Selective Laser Sintering (SLS) 9
2.2.3 Stereolithgraphy (SLA) 10
2.3 Application 11
2.3.1 Aerospace 11
2.3.2 Automotive industries 12
2.3.3 Biomedical industries 12
2.4 Advantages and Disadvantages of AM 13
vi
2.5.1 The Eight Steps in AM Process 15
2.5.2 Step 1: Create CAD Data 16
2.5.3 Step 2: STL file Conversion 16
2.5.4 Step 3: Transfer to AM Machine and STL File Manipulation 16
2.5.5 Step 4: Machine Setup 16
2.5.6 Step 5: Part Construction or Build 17
2.5.7 Step 6: Removal and Cleanup 17
2.5.8 Step 7: Post-processing 18
2.5.9 Step 8: Application 18
2.6 Process Parameter 18
2.6.1 Build Orientation 19
2.6.2 Raster Angle 20
2.6.3 Layer Thickness 21
2.6.4 Air Gap 21
2.6.5 Raster width/ Road width 22
2.6.6 Effects of Process Parameters on the Printed Part 22
2.7 Materials 27
2.7.1 Acrylonitrile Butadiene Styrene (ABS) 28
2.7.2 Polylatic Acid (PLA) 29
2.8 Mechanical Properties 30
2.8.1 Tensile test 30
2.8.2 Flexural test 31
2.8.3 Impact test 31
2.8.4 Surface roughness 32
2.9 Summary of previous work of FDM process 32
2.10 Conclusion 35
CHAPTER 3: METHODOLOGY 36
3.1 Process Flow Chart 37
3.2 Determination Method of Design of Experiment (DOE) 39 3.2.1 Selection of Levels and Variables 39
3.2.3 Design Matrix 39
3.3 Material 41
vii
3.3.1 Polylatic Acid (PLA) 41
3.4 Equipment Setup and Process 42
3.4.1 FDM machine 42
3.4.2 Testing Specimen Preparation 43
3.4.2.1 Tensile Test Specimen 43 3.4.2.2 Flexural Test Specimen 44
3.4.3 Production of Specimen 45
3.4.4 Tensile Testing 47
3.4.5 Flexural Testing 48
3.5 Conclusion 49
CHAPTER 4: RESULT AND DISCUSSION 50
4.1 Testing specimen 50
4.2 Analysis of Experiment For Tensile Test 51
4.2.1 Tensile strength 51
4.2.2 Maximum Strain 54
4.2.3 Main Effect Plot 57
4.2.4 Interaction Plot 60
4.2.5 Analysis of Variance 63
4.3 Analysis of Experiment For Flexural Test 65
4.3.1 Flexural Strength 65
4.3.2 Maximum Strain 68
4.3.3 Main Effect Plot 70
4.3.4 Interaction Plot 73
4.3.5 Analysis of Variance 76
4.4 Optimization set of Parameter 77
4.5 Sustainability 78
4.5.1 Reduce 78
4.5.2 Recycle 79
CHAPTER 5: CONCLUSION AND RECOMMENDATION 80
5.1 Conclusion 80
viii
REFERENCES 83
APPENDICES
A Gantt Chart for FYP I and FYP II
ix
LIST OF TABLE
2.1 Advantages and Disadvantage of AM 14
2.2 Average values of mechanical properties 23 2.3 Mechanical properties in different raster angle and different layer thickness 24 2.4 Various process conditions for specimen preparation 25
2.5 Material properties of ABS 28
2.6 Material properties of PLA 29
2.7 Summary of previous work on FDM process optimization 33
3.1 Input factors and levels 39
3.2 Design Matrix 40
3.3 Fixed parameters and their level 42
4.1 Tabulation of data for tensile strength for PLA specimen 52 4.2 Tabulation of data for tensile strength for ABS specimen 52 4.3 Average value of tensile strength for each combination of layer thickness and
raster angle 53
4.4 Tabulation of data for maximum strain for PLA specimen 55 4.5 Tabulation of data for maximum strain for ABS specimen 55 4.6 Average value of maximum strain for each combination of layer thickness
and raster angle 55
4.7 Two way ANOVA (Tensile Strength of ABS and PLA specimen versus
Layer Thinckness and Raster Angle) 63
4.8 Two-way ANOVA (Maximum Strain of ABS and PLA specimen versus
Layer Thinckness and Raster Angle) 64
4.9 Tabulation of data for flexural strength for PLA specimen 65 4.10 Tabulation of data for flexural strength for ABS specimen 65 4.11 Average value of flexural strength for each combination of layer thickness
and raster angle 66
x
4.13 Tabulation of data for maximum strain for ABS specimen 68 4.14 Average value of maximum strain for each combination of layer thickness
and raster angle 69
4.15 Two way ANOVA (Flexural Strength of ABS and PLA specimen versus
Layer Thinckness and Raster Angle) 76
4.16 Two way ANOVA (Maximum Strain of ABS and PLA specimen versus
xi
LIST OF FIGURE
2.1 Additive Manufacturing (AM) process chain 6
2.2 Classification of AM 7
2.3 Main components of an FDM machine 7
2.4 FDM Process 8
2.5 Selective Laser Sintering process 9
2.6 Stereolithography 10
2.7 Hot air duct for an aero engine 11
2.8 Gas turbine engine 11
2.9 3D printed automotive cylinder head water jacket sand core printed use
binder jetting 12
2.10 Race car gear box produced by EBM 12
2.11 Bone scaffolds fabricated by using SLS 13 2.12 A platform of dental restorations produced by using SLS technology 13
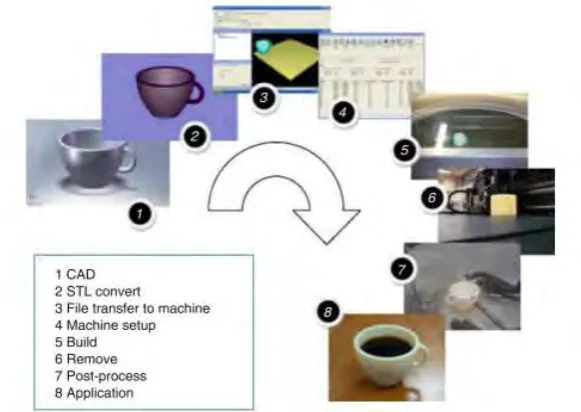
2.13 The eight steps of the AM process 15
2.14 Distribution of influential parameters in the fabrication of 3D printing parts 19 2.15 Built orientation. (a) X-orientation, (b) Y-orientation and (c) Z-orientation 20 2.16 Deposited toolpath direction on the specimen in three build orientation 20
2.17 The raster angle of 3D printing 20
2.18 Layer thickness of a printing part 21
2.19 Air gap parameter 21
2.20 Raster width 22
2.21 Top view of road width 22
2.22 Tensile strength of test specimens with different raster angle compared with
injection molded ABS P400 24
2.23 Main effort plot 26
2.24 Variable symbols and level settings 27 2.25 Graph of tensile strength (MPa) versus main effects 27 2.26 Synthesis and chemical structure of PLA 29
xii
2.28 Bending test specimen dimension 31
2.29 Impact test specimen 32
3.1(a) Process Flow Chart 37
3.1(b) Process Flow Chart 38
3.2 32 Design Schematic 40
3.3 FDM Machine. 42
3.4 Dimension of dog-bone specimen according to ASTM D638 Type IV 44 3.5 Flexural Testing Specimen Dimensions according to ASTM D790 standard 44 3.6 Drawing of Tensile Test specimen by using SolidWork 45 3.7 Drawing of Flexural Test Specimen by using SolidWork. 46 3.8 Tensile test specimen made from PLA (red) and ABS (purple) 46 3.9 Flexural test specimen made from PLA (red) and ABS (orange) 47
3.10 Tensile tester (UTM machine) 47
3.11 Three point bending test (UTM machine). 48
4.1 Separation of dog bone specimen 50
4.2 Test specimen after the flexural test 51 4.3 Tensile Strength measurements of ABS and PLA specimens with various
raster angle and layer thickness 53
4.4 Maximum strain measurements of ABS and PLA specimens with various
raster angle and layer thickness 56
4.5 (a) Main Effect Plot for Tensile Strength (ABS Specimen) 57 4.5 (b) Main Effect Plot for Tensile Strength (PLA Specimen) 57 4.6 (a) Main Effort Plot for Maximum Strain (ABS Specimen) 58 4.6 (b) Main Effort Plot for Maximum Strain (PLA Specimen) 59 4.7 (a) Interaction Plot for Tensile Strength (ABS specimen) 60 4.7 (b) Interaction Plot for Tensile Strength (PLA specimen) 60 4.8 (a) Interaction Plot for Maximum Strain (ABS specimen) 61 4.8 (b) Interaction Plot for Maximum Strain (PLA specimen) 62 4.9 Flexural Strength measurements of ABS and PLA specimens with various
raster angle and layer thickness
66
xiii
4.11 Maximum strain measurements of ABS and PLA specimens with various
raster angle and layer thickness 69
4.12(a) Main Effect Plot for Flexural Strength (ABS Specimen) 70 4.12(b) Main Effect Plot for Flexural Strength (PLA Specimen) 71 4.13(a) Main Effect Plot for Maximum Strain (ABS Specimen) 72 4.13(b) Main Effect Plot for Maximum Strain (PLA Specimen) 72 4.14(a) Interaction Plot for Flexural Strength (ABS specimen) 73 4.14(b) Interaction Plot for Flexural Strength (PLA specimen) 74 4.15(a) Interaction Plot For Maximum Strain (ABS specimen) 75 4.15(b) Interaction Plot For Maximum Strain (PLA specimen) 75
xiv
LIST OF ABBREVIATIONS
AM - Additive Manufacturing
ASTM - American Society for Testing and Materials 3D - Three Dimensional
CAD - Computer –Aided Design FDM - Fused Deposition Modeling DOE - Design of Experiment ANOVA - Analysis of Variance
ABS - Acrylonitrile-Butadiene-Styrene PLA - Polylatic Acid
UTM - Universal Testing Machine FKP - Fakulti Kejuruteraan Pembuatan PSM - Project Sarjana Muda
FFF - Fused Filament Fabrication SLS - Selective Laser Sintering SLA - Stereolithgraphy
UV - Ultraviolet
xv
LIST OF SYMBOLS
mm - Millimeter
° - Degree
MPa - Mega Pascal
1
CHAPTER 1
INTRODUCTION
In this chapter, an introduction of Additive Manufacturing (AM) technology-3D printing, which includes the parameters, application as well as the performance of printed parts are discussed. Next, the inspiration of using AM systems to replace the conventional method is discussed in the background of this study. Furthermore, the problem statement, objective and scope are also discussed.
1.1 Background
There are more than 20 years Additive manufacturing (AM) technology has been developed and researched. AM system involves different new manufacturing technologies, which allocate such as metal and polymer materials to be utilized to make new objects through layer-wise material melding. Based on ASTM F42 Technical Committee, additive manufacturing is defined as “ process of joining materials to make objects from three-dimensional (3D) model data, usually layer upon layer, as opposed to subtractive manufacturing methodologies” (Guo & Leu, 2013). The process is basically different from conventional method like drilling, milling, and turning, which are used to remove the materials. AM term describe additive manufacturing processes in the widest way that included model, designs, apparatuses, and ideas parts, furthermore useful part with required properties for direct manufacturing applications and resource.
2
parts customisation and multiple assemble. Therefore, AM drastically reduce the lead time, production cost, and can build parts that subtractive manufacturing processes cannot make it (Guo & Leu, 2013). AM technology has been utilized to carry model parts with required material properties for assessment and testing, and additionally to fabricate little or standard amounts of end-utilize items.
Fused Deposition Modeling (FDM) is one of the current 3D printing technologies. FDM is one of the broadly used technologies that rapidly created three-dimensional (3D) solid object with complex geometries (Bagsik et al., 2010). In this process, the nozzle is heated to melt the material, and then deposited in the part layer by layer. Besides, Wu et al., (2015) explained the benefit of FDM are include simple material change easily, without supervision operation, low costs, minimized size and low working temperature. In spite of the fact that FDM is fundamentally utilized for prototyping, with gradual improvement in process and material factors, the scope of application of the process further increase and being considered for the direct requires particular end-utilize parts. Keeping in mind the end goal to be utilized as a part for serial production, the parts must have the required mechanical properties. Enhancing the mechanical performance of the product regularly comes to the loss of printing speed, affordability and quality.
3
1.2 Problem Statement
AM has exposed excellent potential, especially in term of process duration and cost of product development. However, when presented with an FDM system, many process parameters are involved when manufacture the part. The mechanical performance includes surface roughness, build time and material usage, which eventually determines customer satisfaction or dissatisfaction are the major influence of the process parameters. The mechanical properties such as tensile strength, development of residual stress and impact strengths play an vital role in tooling applications (Chockalingam, Jawahar, & Chandrasekhar, 2006). However, the raster angle and layer thickness plays an important character in influencing the mechanical characteristic of parts produced compared to others parameters. When the parameters are set at different levels, the mechanical performance will change. This is because of changing at microstructure of the product or part. Thus, to enhance the quality of the part, the process parameters raster angle and layer thickness should be optimized.
4
1.3 Objective
The objectives of the study are:
i. To conduct tensile test and flexural test for different level of raster angle and layer thickness on the 3D printed.
ii. To study the influence of raster angle and layer thickness on the mechanical properties of FDM test specimens.
iii. To identify the optimum raster angle and the layer thickness parameter for the test specimen.
1.4 Scope of Study
In this study mainly focused on the process parameter raster angle and layer thickness. This project will use AM to produce the sample specimen. The specimens are fabricated by using Fused Deposition Modeling (FDM) machine which is the FolgerTech 3D printer. All test specimen parts are built using Acrylonitrile-Butadiene-Styrene (ABS) and Polylatic Acid (PLA) materials. Furthermore, flexural test and tensile test are carried out to collect the data, such as elongation at break, ultimate tensile strength and bend test. The universal testing machine (UTM) available in the laboratory FKP is used to carry out all two tests which are tensile tested and flexural test. The sample specimens will be also discussed and analysis. In addition, Design of Experiment (DOE) method is utilized to list out all the possible parameter combinations and the CAD software used in this study is SolidWork. The experiment result will analysis by using Analysis of Variance (ANOVA) method.
1.5 Activity Planning
5
CHAPTER 2
LITERATURE REVIEW
In this chapter, it focuses on the review of the literature from the journal, article, books and other resources. The main idea of this chapter is to acquire an understanding of the additive manufacturing as well as the impact of process parameters on the mechanical properties.
2.1 Definitions of AM
Based on American Society for Testing and Materials (ASTM) 52900:2015 standard, the definition of Additive Manufacturing is a process of joining the filaments or materials from 3D CAD data to create an object, layer upon layer, as different with subtractive manufacturing and formative manufacturing methodologies (ASTM, 2012). It was initially called “3D Printing” and is still regularly called additive manufacturing (Gebhardt, 2012). Besides that, it also identified as rapid prototyping, additive fabrication, layer manufacturing, additive processes, rapid manufacturing and solid freedom fabrication (Guo & Leu, 2013).
6
Figure 2.1: Additive Manufacturing (AM) process chain (Gibson, Rosen, & Stucker, 2010).
The first 3D printer was developed in 1985 and its use becomes more widespread. This technology is broadly used in various fields, for example, aerospace, medical implants, industry and electrical. Furthermore, diverse 3D printers use distinctive materials to fabricate layers. Some machine use fluid polymer or gel, sheet material, powder or others, which has a tendency to be more costly.
AM technology has offer greatest benefit, especially in term of time, cost and quality compare to subtractive manufacturing. Besides that, it also capable to create a wide range of shape that could be very complicated to machine.
2.2 Classification of AM and AM system