13
eurostat
STATISTISCHES AMT DER EUROPAISCHEN GEMEINSCHAFTEN STATISTICAL OFFICE OF THE EUROPEAN COMMUNITIES OFFICE STATISTIQUE DES COMMUNAUTÉS EUROPÉENNES
L-2920 Luxembourg — Tél. (352) 43 01-1 — T é l e x COMEUR LU 3423 B-1049 Bruxelles, rue de la Loi 200 — Tél. (32-2) 299 11 11
Eurostat hat die Aufgabe, den Informa-tionsbedarf der Kommission und aller am Aufbau des Binnenmarktes Beteiligten mit Hilfe des europäischen statistischen Systems zu decken.
Um der Öffentlichkeit die große Menge an verfügbaren Daten zugänglich zu machen und Benutzem die Orientierung zu erleichtern, werden zwei Arten von Publi-kationen angeboten: Statistische Doku-mente und Veröffentlichungen.
Statistische Dokumente sind für den Fachmann konzipiert und enthalten das ausführliche Datenmaterial: Bezugs-daten, bei denen die Konzepte allgemein bekannt, standardisiert und wissenschaft-lich fundiert sind. Diese Daten werden in einer sehr tiefen Gliederung dargeboten. Die Statistischen Dokumente wenden sich an Fachleute, die in der Lage sind, selbständig die benötigten Daten aus der Fülle des dargebotenen Materials auszu-wählen. Diese Daten sind in gedruckter Form und/oder auf Diskette, Magnet-band, CD-ROM verfügbar. Statistische Dokumente unterscheiden sich auch optisch von anderen Veröffentlichungen durch den mit einer stilisierten Graphik versehenen weißen Einband.
Veröffentlichungen wenden sich an eine ganz bestimmte Zielgruppe, wie zum Beispiel an den Bildungsbereich oder an Entscheidungsträger in Politik und Ver-waltung. Sie enthalten ausgewählte und auf die Bedürfnisse einer Zielgruppe abgestellte und kommentierte Informa-tionen. Eurostat übernimmt hier also eine Art Beraterrolle.
Für einen breiteren Benutzerkreis gibt Eurostat Jahrbücher und periodische Veröffentlichungen heraus. Diese enthal-ten statistische Ergebnisse für eine erste Analyse sowie Hinweise auf weiteres Datenmaterial für vertiefende Unter-suchungen. Diese Veröffentlichungen werden in gedruckter Form und in Daten-banken angeboten, die in Menütechnik zugänglich sind.
Um Benutzem die Datensuche zu erleich-tem, hat Eurostat Themenkreise, d. h. eine Untergliederung nach Sachgebieten, eingeführt. Daneben sind sowohl die Statistischen Dokumente als auch die Veröffentlichungen in bestimmte Reihen, wie zum Beispiel „Jahrbücher", „Kon-junktur", „Methoden", untergliedert, um den Zugriff auf die statistischen Informa-tionen zu erleichtem.
Y. Franchet Generaldirektor
It is Eurostat's responsibility to use the European statistical system to meet the requirements of the Commission and all parties involved in the development of the single market.
To ensure that the vast quantity of ac-cessible data is made widely available, and to help each user make proper use of this information, Eurostat has set up two main categories of document: statistical documents and publications.
The statistical document is aimed at spe-cialists and provides the most complete sets of data: reference data where the methodology is well-established, stand-ardized, uniform and scientific. These data are presented in great detail. The statistical document is intended for ex-perts who are capable of using their own means to seek out what they require. The information is provided on paper and/or on diskette, magnetic tape, CD-ROM. The white cover sheet bears a stylized motif which distinguishes the statistical docu-ment from other publications.
The publications proper tend to be com-piled for a well-defined and targeted public, such as educational circles or political and administrative decision-makers. The information in these docu-ments is selected, sorted and annotated to suit the target public. In this instance, therefore, Eurostat works in an advisory capacity.
Where the readership is wider and less well-defined, Eurostat provides the infor-mation required for an Initial analysis, such as yearbooks and periodicals which contain data permitting more in-depth studies. These publications are available on paper or in videotext databases. To help the user focus his research, Eurostat has created themes', i.e. subject classifications. The statistical documents and publications are listed by series: e.g. yeartxwks, short-term trends or method-ology in order to facilitate access to the statistical data.
Y. Franchet Director-General
Pour établir, évaluer ou apprécier les dif-férentes politiques communautaires, la Commission européenne a besoin d'infor-mations.
Eurostat a pour mission, à travers le sys-tème statistique européen, de répondre aux besoins de la Commission et de l'en-semble des personnes impliquées dans le développement du marché unique. Pour mettre à la disposition de tous l'im-portante quantité de données accessibles et faire en sorte que chacun puisse s'orienter correctement dans cet ensem-ble, deux grandes catégories de docu-ments ont été créées: les docudocu-ments statistiques et les publications.
Le document statistique s'adresse aux spécialistes. Il fournit les données les plus complètes: données de référence où la méthodologie est bien connue, standar-disée, normalisée et scientifique. Ces données sont présentées à un niveau très détaillé. Le document statistique est des-tiné aux experts capables de rechercher, par leurs propres moyens, les données requises. Les informations sont alors disponibles sur papier et/ou sur disquette, bande magnétique, CD-ROM. La couver-ture blanche ornée d'un graphisme stylisé démarque le document statistique des autres publications.
Les publications proprement dites peu-vent, elles, être réalisées pour un public bien déterminé, ciblé, par exemple l'enseignement ou les décideurs politi-ques ou administratifs. Des informations sélectionnées, triées et commentées en fonction de ce public lui sont apportées. Eurostat joue, dès lors, le rôle de conseil-ler.
Dans le cas d'un public plus large, moins défini, Eurostat procure des éléments nécessaires à une première analyse, les annuaires et les périodiques, dans les-quels figurent les renseignements adé-quats pour approfondir l'étude. Ces publications sont présentées sur papier ou dans des banques de données de type vidéotex.
Pour aider l'utilisateur à s'orienter dans ses recherches, Eurostat a créé les thèmes, c'est-à-dire une classification par sujet. Les documents statistiques et les publications sont répertoriés par série — par exemple, annuaire, conjonc-ture, méthodologie — afin de faciliter l'accès aux informations statistiques.
RESULTS 1993
Population and social conditions Series Accounts and surveys
Theme ¿~
Luxembourg: Off ice for Official Publications of the European Communities, 1995 ISBN 92-827-4240-7
© ECSC-EC-EAEC, Brussels · Luxembourg, 1995
Reproduction is authorized, except for commercial purposes, provided the source is acknowledged. Printed in Belgium
with Council Regulation (EEC) No. 3711/91 of 16 December 1991.
This survey, like preceding surveys earned out between 1983 and 1992, was based upon the International Labour Office guidelines on labour force statistics as adopted by the 13th International Conference of Labour Statisticians in 1982 and subsequently confirmed at the 14th and 15th conferences in 1987 and 1993. The fact that the methodology of the European Labour Force Survey conforms with internationally-accepted standards has assisted its development over the years into a rich and powerful source of labour force statistics. The unique application of common definitions and standardised contents for all Member States of the European Union permits the survey to be used extensively in meeting requirements with regard to labour market statistics for the social and regional development policies of the Union.
The 1993 European Labour Force Survey was the second survey in a new series. In comparison with the surveys conducted between 1983 and 1991, a number of modifications were made in 1992 in order to meet changing statistical requirements and to improve data quality and reliability at both national and regional levels. Information about the content and methodology of the survey as implemented from 1992 onwards may be found in the Eurostat publication Labour Force Survey : Methods and Definitions -1992 Series. Some clarifications and updates to the definitions as given there are provided below in the explanatory notes to this publication.
Eurostat wishes to thank all those involved at the national statistical offices for their contribution to the survey in preparing the questionnaires, selecting the samples, conducting the interviews and transmitting the data to Eurostat. The preparation of this publication was the responsibility of the unit Population, Migration, Employment and Unemployment in the Directorate for Social and Regional Statistics and Regional Plans at Eurostat.
and abbreviations
— Zero or not availableNot zero but extremely unreliable
( ) Unreliable data due to small size of the sample Eur 12 European Union (as it was before 1-1-1995)
Bibliographical note
Main publications of 1993 national survey resultsBelgique/Be/giö
Enquête par sondage sur les forces de travail, INS 1993 Steekproefenquête naarde beroepsbevolking, NIS 1993 Danmark
Arbejdsstyrkeundersøgelsen, Statistiske efterretninger, Danmarks Statistik
B.R. Deutschland
Bevölkerung und Erwerbstätigkeit, Fachserie 1, Reihe 4.1, Statistisches Bundesamt
Greece
Labour force survey, National Statistical Service of Greece España
Encuesta de población activa
Principales resultados y resultados detallados (trimestral), Tablas anuales, INE
France
Enquête sur l'emploi 1993, les collections de l'Insee Ireland
Labour force survey 1993, Central Statistics Office
Itala
Rilevazione trimestrale sulle forze di lavoro, Istat Annuario statistico italiano, Istat
Luxembourg Bulletin du Statec Nederland
Enquête beroepsbevolking 1993, CBS Portugal
Inquérito ao emprego 1993, INE United Kingdom
Explanatory notes Page 9
Table
001 002 003 004 005 006 007 008 009 010 011 012 013 014 015 016 017 018 019 020 021 022 023 024 025 026 027 028 029 030 031
032 033 034 035 036 037 038 039 040 041 042 043 044 045 046
(Old Table Number )
(01) (02) (03) (04) (05) (06) (07) (08) (09) (10) (11) (12) (13) (14) (15) (16) (17) (18) (19) (20) (21) (22) (23)
(-) (-) (-) (-) (-) (-) (-) (-)
(25) (26) (27) (28) (29) (30) (31) (32) (43) (44)
(-) (-) (-) (-) (-)
Population and activity
Principal characteristics of activity of the population (1,000/%)
Principal characteristics of activity of persons aged 15 to 24 years (1,000/%) Activity rates by age groups (%)
Activity rates by marital status and broad age groups (%) Activity rates by nationality and broad age groups (%) Employment/population ratios by age groups (%)
Employment/population ratios by marital status and broad age groups (%) Unemployment rates by age groups (%)
Unemployment rates by marital status and broad age groups (%) Total population by age groups (1,000)
Total population by age groups (%)
Non-national population by broad age groups (1,000) Non-national population by broad age groups (%) Labour force by age groups (1,000)
Labour force by age groups (%)
Labour force by nationality and broad age groups (1,000) Labour force by nationality and broad age groups (%) Persons in employment by age groups (1,000) Persons in employment by age groups (%) Unemployed persons by age groups (1,000) Unemployed persons by age groups (%) Inactive persons by age groups (1,000) Inactive persons by age groups (%)
Persons aged 15 to 24 years-rate of participation in education (%)
Unemployment rates of persons aged 25 to 59 years by educational attainment level (%)
Population aged 15 and overby degree of urbanisation and main population categories (1,000) . . Population aged 15 and over by degree of urbanisation and main population categories (%) . . . . Unemployment rates, employment/population ratios, and activity rates by degree of urbanisation (%) Employment status by educational attainment level of persons aged 25 to 59 years (1,000) . . . . Employment status by educational attainment level of persons aged 25 to 59 years (%)
Educational attainment level by employment status of persons aged 25 to 59 years (%) Employment
Persons in employment by professional status (1,000) Persons in employment by sector of activity (1,000) Persons in employment by professional status (%) Persons in employment by sector of activity (%)
Persons in employment by professional status and sector of activity (1,000) Persons in employment by professional status and sector of activity (%) Persons in employment by sector of activity and professional status (1,000) Persons in employment by sector of activity and professional status (%) Persons in employment by economic activity (NACE Rev. 1) (1,000) Persons in employment by economic activity (NACE Rev. 1)(%) Employees by economic activity (NACE Rev. 1) (1,000)
Employees by economic activity (NACE Rev. 1)(%)
Persons in employment by occupation (ISCO-8 (COM)) (1,000) Persons in employment by occupation (ISC°-88(COM)) (%) Employees by occupation (ISCO-88(COM)) (1,000)
14 16 18 20 22 24 26 28 30 32 34 36 38 40 42 44 46 48 50 52 54 56 58 60 62 64 66 68 70 72 74
047
048
049
050
051
052
053
054
055
056
057
058
059
060
061
062
063
064
065
066
067
068
069
070
Number )
(-)
(41) (42) (33) (34) (35) (36) (37) (38) (39) (40)(-)
(-)
(-)
(-)
(-)
(-)
(-)
(-)
(-)
(-)
(-)
(-)
(-)
Employees by occupation (ISCO-88(COM)) (%)
Persons working full-time/part-time by broad age groups (1,000) Persons working full-time/part-time by broad age groups (%)
Persons in employment by professional status and full-time/part-time breakdown (1,000) Persons in employment by professional status and full-time/part-time breakdown (%) Persons in employment by sector of activity and full-time/part-time breakdown (1,000) Persons in employment by sector of activity and full-time/part-time breakdown (%) Employees by sector of activity and full-time/part-time breakdown (1,000)
Employees by sector of activity and full-time/part-time breakdown (%) Non-employees by sector of activity and full-time/part-time breakdown (1,000) Non-employees by sector of activity and full-time/part-time breakdown (%) Married women-sector of activity by full-time/part/time breakdown (1,000/%) Persons working part-time by reason (1,000 / %)
Persons working shiftwork, in the evening orat night (1,000) Persons working shiftwork, in the evening orat night (%) Persons working on Saturday, Sunday or from home (1,000) Persons working on Saturday, Sunday or from home (%) Employees with a temporary job by reason (1,000/%)
Reasons for total absence from work during the reference week (1,000/%)
Percentage of employees aged 25 to 59 years receiving training during the previous four weeks by sector of activity (NACE Rev. 1)(%)
Persons in employment with more than one job by professional status of the second job (1,000). . Persons in employment with more than one job by sector of activity of the second job (1,000) . . . Persons in employment with more than one job by professional status of the second job ( % ) . . . . Persons in employment with more than one job by sector of activity of the second job (%)
104 106 108 110 112 114 116 118 120 122 124 126 128 130 132 134 136 138 140
142 144 144 146 146
071 072 073 074 075 076 077 078 079 080 081 082 083 084 085 086 087 088 089 090 091
(47/48) (54) (-) (-) (-) (49) (50) (51) (52) (-) (-) (59) (60) (-) (53)
(-Working time
Persons in employment - comparison of average usual and average actual number of hours
worked by sector of activity (hrs) 150 Employees-average hours usually worked per week by economic activity (NACE Rev. 1) (hrs) . . 152
Employees working full-time - average hours usually worked per week by economic activity
(NACE Rev.1) (hrs) 154 Employees working part-time - average hours usually worked per week by economic activity
(NACE Rev.1) (hrs) 156 Employees -average hours usually worked per week by occupation (ISCO-88(COM)) (hrs) . . . . 158
Persons in full-time employment-groups of hours usually worked per week (%) 160 Persons in full-time employment - groups of hours actually worked during the reference week (%) 162
Persons in part-time employment-groups of hours usually worked per week (%) 164 Persons in part-time employment-groups of hours actually worked during the reference week (%) 166
Employees in industry working full-time - groups of hours usually worked per week by economic
activity (NACE Rev.1) (%) 168 Employees in services working full-time - groups of hours usually worked per week by economic
activity (NACE Rev.1) (%) 172 Employees in industry and services working part-time - groups of hours usually worked per week
(%) 176
Persons in full-time employment - detailed groups of hours actually worked during the reference
week(%) 178
Persons in full-time employment-detailed groups of hours usually worked per week (%) 180 Persons in full/part-time employment-differences between usual and actual hours (1,000) . . . . 182
Persons in full/part-time employment -differences between usual and actual hours (%) 184 Persons in employment having worked during the reference week - reasons for differences between
usual and actual hours (1,000) 186 Persons in employment having worked during the reference week - reasons for differences between
usual and actual hours (%) 188 Persons in employment having worked during the reference week - average difference in hours
between usual and actual hours (hrs) 190 Persons in employment with a second job - number of persons and average hours actually worked
in second job during the reference week (1,000/hours) 192 Persons in employment with a second job -type of second job by hours actually worked during the
092 093 094 095 096 097 098 099 100 101 102
Number )
(62) (63) (64) (65) (68) (69) (70) (71)
(-)
(72)
(-)
Unemployment and search for work
Principal characteristics of the unemployed (1,000) 198 Principal characteristics of the unemployed (%) 200 Principal characteristics of the unemployed aged 15 to 24 years (1,000) 202
Principal characteristics of the unemployed aged 15 to 24 years (%) 204
Detailed duration of unemployment (1,000) 206 Detailed duration of unemployment (%) 208 Duration of unemployment forthe main groups of unemployed (1,000) 210
Duration of unemployment for the main groups of unemployed (%) 212
Duration of unemployment by broad age groups (1,000) 214 Duration of unemployment by broad age groups (%) 216 Unemployed having lost/left job as employee due to economic reasons by previous economic
activity (NACE Rev.1) (1,000) 218 103 (—) Unemployed having lost/left job as employee due to economic reasons by previous economic
activity (NACE Rev.1) (%) 220 104 (—) Unemployed having lost/left job as employee due to economic reasons by occupation of last
job (ISCO-88(COM)) (1,000) 222 105 (—) Unemployed having lost/left job as employee due to economic reasons by occupation of last
job (ISCO-88(COM)) (%) 224 Unemployed seeking employment by broad age group and type of employment sought (1,000) . . 226
Unemployed seeking employment by broad age group and type of employment sought (%) . . . . 228
Unemployed seeking employment by method of job search (1,000) 230 Unemployed seeking employment by method of job search (%) 232 Inactive persons-reasons for not seeking employment and willingness to work (1,000) 234
Inactive persons - reasons for not seeking employment and willingness to work (%) 236 Persons having a job and seeking another by broad age groups and reasons (1,000) 238 Persons having a job and seeking another by broad age groups and reasons (%) 240 Households
Number of private households by household type (children under 15) (1,000/%) 244 Activity rates and unemployment rates by household type (children under 15) (%) 246 Number households by number of unemployed persons living in household (1,000/%) 248 Number of private households by age of yougest person in the household (1,000) 250 Number of private households by age of yougest person in the household (%) 250
Unemployed by relationship to head of household (1,000) 252 Unemployed by relationship to head of household (%) 254 Duration of unemployment by relationship to head of household (1,000) 256
Duration of unemployment by relationship to head of household (%) 258 106
107 108 109 110 111 112 113
114 115 116 117 118 119 120 121 122
(75) (76) (79) (80)
(-) (-)
(81) (82)
(-) (-) (-) (-) (-)
(66) (67)
(-)
Organization of the survey
The content of the European Labour Force Survey is determined by the Statistical Office of the European Union (Eurostat), together with the national experts of the Member States. An agreed coding scheme is then used by the Member States in transmitting the data.
A summary presentation of the type of information covered by the survey was included in Article 4 of Council Regulation (EEC) N° 3711/91 which formed the legal basis for surveys from 1992 onwards.
The national statistical institutes are responsible for selecting the sample, preparing the questionnaires, conducting the direct interviews among households, and forwarding the results to Eurostat in accordance with the standard coding scheme.
Eurostat devises the programme for analysing the results and is responsible for processing and disseminating the information forwarded by the national institutes.
A detailed description of the sampling methods, the adjustment procedures, the definitions and the common Community coding currently used in the labour force survey is presented in the publication Labour Force Survey - Methods and definitions, 1992 series.
Reference period
The labour force characteristics of each person interviewed refer to his situation in a particular reference week.
As a general rule the reference week should be a normal week in spring excluding bank holidays. For countries using a fixed week such as Italy, this requirement is easy to fulfil. In some countries, however, the reference week is the one preceding the week of the interview and, as the survey extends over a period ottime, the mobile reference week method is used. In this case it cannot be guaranteed that the reference week represents a normal week.
For the 1993 survey, the reference weeks were distributed within the following periods:
Belgium Denmark FR of Germany Greece Spain France Ireland Italy Luxembourg Netherlands Portugal United Kingdom
May
February^June May
April-August AprikJune February-April April-July April May
January ^June April-July March-June
Field of survey
The survey is intended to cover the whole of the resident population, i.e. all persons whose usual place of residence is in the territory of the Member States of the Community. For technical and methodological reasons, however, it is not possible in all the countries to include the population living in collective households, i.e. persons living in homes, boarding schools, hospitals, religious institutions, workers' hostels, etc. Consequently, for the purposes of harmonizing the field of survey, the Community results are compiled on the basis of the population of private households only. This comprises all persons living in the households surveyed during the reference week. This definition also includes persons absent from the household for short periods due to studies, holidays, illness, business trips, etc.
The sampling method was designed separately by each national statistical office in the light of the experience and practices of the individual Member States. The design adopted in each case was required by the Regulation to ensure a certain minimum reliability at regional level, expressed as follows : the sampling plan shall guarantee that for characteristics relatíng to 5% of the population of working age the relative standard error at NUTS II level (or equivalent) does not exceed 8%, assuming the design effect for the variable 'unemployment. '
(Council Regulation (EEC) No. 3711/91, Article 3.2)
The number of private households for which data was finally available from each Member State, was as follows :
Belgium Denmark F.R. of Germany Greece
Spain France Ireland Italy Luxembourg Netherlands Portugal United Kingdom
Reliability of the results
32,554 13,952 143,070 61,026 58,438 72,387 46,946 72,543 5,318 29,725 15,677 66,329
Sampling error
techniques, etc. as those used in the labour force survey. This difference is known as the sampling error of the estimate. In a given sample, there are basically two factors which account for the relative magnitude of the sampling error of a characteristic: the frequency with which it occurs, and the evenness with which it is distributed among the population. Of two estimates, the larger is likely to have a smaller per cent sampling error, while of two estimates of comparable size the one which refers to a characteristic more evenly spread throughout the population would, in general, be subject to smaller relative sampling variability.
In this publication results likely to have very wide margins of relative sampling variability have been replaced by a dot, while other relatively imprecise estimates are shown within brackets. An indication of the per cent sampling error can be provided by the coefficient of variation of an estimate. Eurostat has requested the Member States to calculate the coefficient of variation for certain basic variables (employed by broad industrial group, unemployed, unemployment rates, labour force and activity rates) by sex and age. The answers received indicate thatforthe above mentioned variables the labourforce survey provides reliable results at national level.
Survey response
A significant source of non-sampling error in the labour force survey is the effect of non-response on the results. Non-response rates range from 1 (in Italy) to 42% (in Netherlands). This rate is normally less than 10% in the countries where the survey is compulsory. Adjustment for non-response in the majority of countries was made by reweighting the results while in some cases the method used was 'duplication' or 'substitution' of units. Quality checks carried out in various countries suggest that one-person households may be under-represented in the sample as they tend to be more difficult to contact than households containing several persons.
Weighting
The 1993 survey results were weighted up to independently derived population estimates for various age, sex, region, nationality, etc. categories. More information about weighting and adjustment procedures can be found in Labour Force Survey - Methods and definitions, 1988.
Basic concepts and definitions
The concepts and definitions used in the survey are those contained in the Recommendation of the 13th International Conference of Labour Statisticians, convened in 1982 by the International Labour Organisation (and therefore referred to throughout these notes as the 'ILO guidelines'). In accordance with the ILO guidelines, the definitions given below are applied. All these definitions apply to persons aged 15 years and over, living in private households.
Persons in employment are those who during the reference week did any work for pay or profit, or were not working but had jobs from which they were temporarily absent. Family workers are also included.
Unemployed persons are those who, during the reference week :
(a) had no employment, and
(b) were available to start work within the next two weeks, and
In addition, unemployed persons include those who had no employment and had already found a job to start later. Duration of unemployment is defined as:
(a) the duration of search for a job, or
(b) the length of the period since the last job was held (if this period is shorter than the duration of search for a job).
The labour force is defined as the sum of persons in employment and unemployed persons.
Inactive persons are those who are not classified as persons in employment nor as unemployed persons.
Activity rates represent the labourforce as a percentage of the population of working age.
Employment/population ratios represent persons in employment as a percentage of the population ofworking age. Unemployment rates represent unemployed persons as a percentage of the labourforce.
The above rates are usually calculated for sex/age groups and sometimes further cross-classified by other demographic variables.
Application of the concepts
As discussed below, the revision of the survey in 1992 included a number of modifications designed to ensure a more exact application of the ILO guidelines. This application modifies certain aspects of the text in the publication Labour Force Survey - Methods and Definitions, 1992 series. In terms of the codification as presented in that publication, the definitions of employed and unemployed persons may be expressed as follows :
Employed :
(Column 13 = '1') or (Column 13 ='2'and (Column 14 NE'7')) Unemployed :
(((Column 13 = '3' or '5') and (Column 77 = '1') and (Column 73 = '01' or '02' or '03' or '04' or '05' or '06' or '07' or '08' or '12'))
or ((Column 13 = '2' and Column 14 = '7') or (Column 13 = '5' and Column 69 = '2')))
Comparability with previous surveys
The concepts and definitions used in the European Labour Force Survey have been derived from the ILO guidelines since 1983. This has guaranteed the comparability of the results between all the surveys held since that year. The results of surveys held before 1983 are not comparable since they were not based upon these guidelines.
of 14 years as in the previous series).
The definition of employed persons in the two series is identical.
The definition of unemployed persons contains the following differences:
(a) Persons seeking work as self-employed are now considered unemployed only if they satisfy the same criteria of seeking work and availability for work, as persons seeking work as employees. Before 1992, these criteria were not applied for this small group.
(b) Persons not at work and hoping to be re-engaged by a former employer ('temporary lay-offs') are similarly now considered as unemployed only if they satisfy the usual criteria of seeking work and availability for work, which were not previously applied.
(c) Persons without employment are considered as unemployed only if they are available for work and have used an active method of job-search within the reference period as specified by the ILO guidelines. The questionnaires were therefore modified to permit active methods to be distinguished separately. In the absence of comparative data from both the old and new sets of questions, it is difficult to estimate the effect of this change, but most Member States considered that the category of unemployed already comprised exclusively persons actively seeking work.
Implementation of the survey at national level
Germany was not able to provide data on economic activity according to the new NACE Revl classification; Germany was only able to provide NACE 1970 and a conversion has been done.
There are still some difficulties in the conversion between the national classifications on occupations and the ISCO-88 (COM) but some progress was made and it is hoped that this information will become more consistent in future years. In addition some countries have adopted different and not always comparable approaches concerning the allocation of national qualifications to the different levels of education as defined by Eurostat. For this reason, data on ISCED is only available for three categories. Data for Italy is not comparable
due to the fact that the answer to education questions is not compulsory. ISCED 3 is underestimated for Ireland due to the nature of the Irish questionnaire which does not provide information on specific vocational training.
In Denmark the sample unit is the individual instead of the household. The other members of the household are identified from the registers. Additionally, from 1992 onwards, a family can be constituted by a couple (married or cohabiting) with or without children. With this definition, a family cannot be constituted of more than two generations.
In France, the new questions implemented in 1992 are put to the section of the sample which is interviewed using computers. The part of the sample interviewed using computers is larger in 1993 than it was in 1992 but the non-responses rates for some variables are still high.
In the Netherlands, the ILO guidelines have not been strictly observed in respect of the one-hour criterion on employment, so that certain figures have had to be imputed. In addition part-time work in the Netherlands is higher than for other member states due to the nature of the Dutch questionnaire. For Luxembourg data on the 'degree of urbanisation' was not provided. It is hoped to rectify this omission in subsequent surveys.
In the United Kingdom persons shown as 'registered unemployed' are, in fact, claimants to unemployment benefit. Data on recipients of unemployment benefit are not available
Contents of this publication
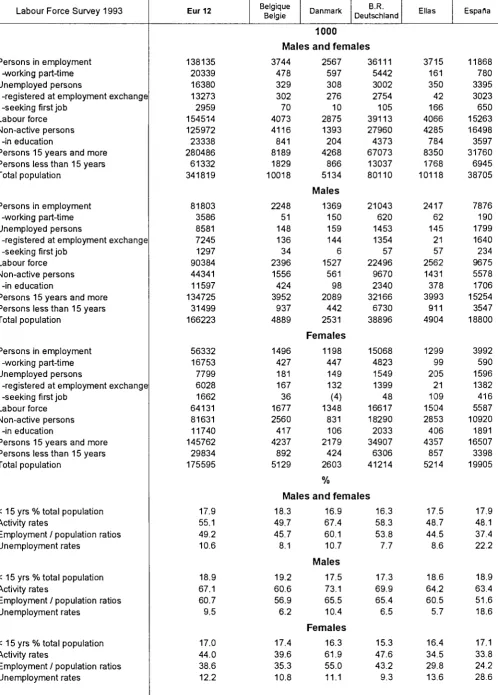
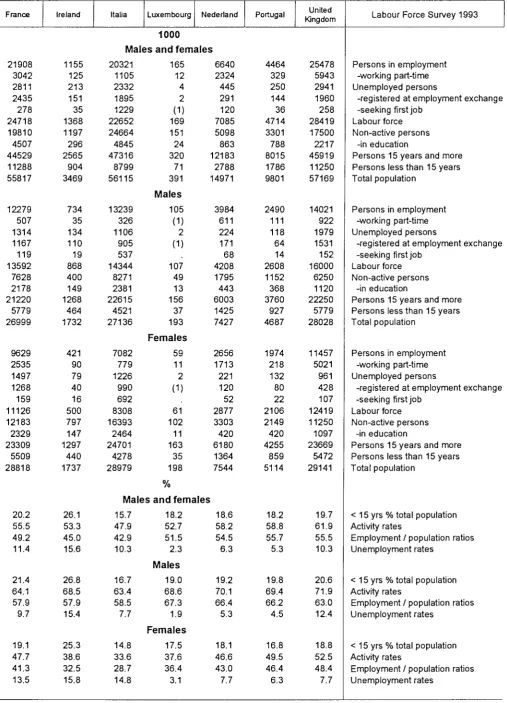
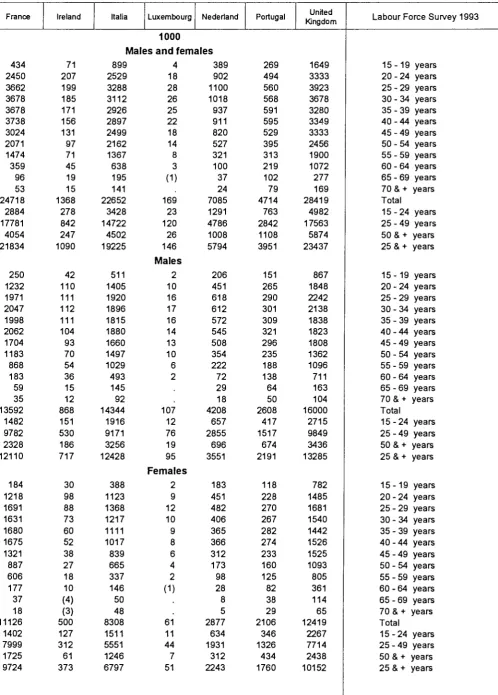
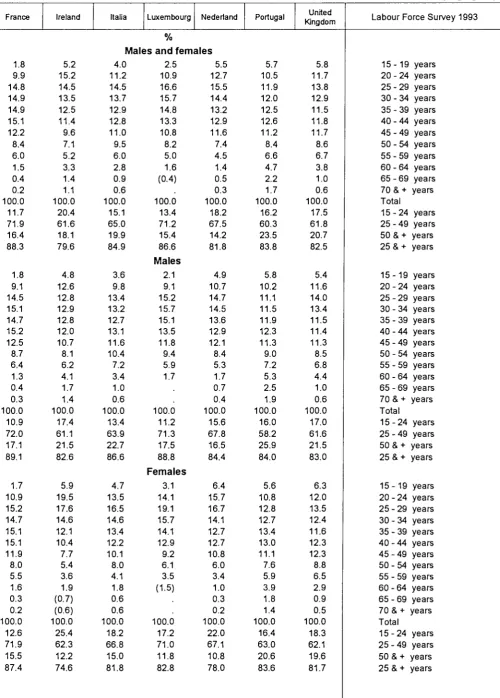
Principal characteristics of activity of the population
Labour Force Survey 1993
Persons in employment -working part-time Unemployed persons
-registered at employment exchange -seeking first job
Labour force Non-active persons
-in education
Persons 15 years and more Persons less than 15 years Total population
Persons in employment -working part-time Unemployed persons
-registered at employment exchange -seeking first job
Labour force Non-active persons
-in education
Persons 15 years and more Persons less than 15 years Total population
Persons in employment -working part-time Unemployed persons
-registered at employment exchange -seeking first job
Labourforce Non-active persons
-in education
Persons 15 years and more Persons less than 15 years Total population
< 15 yrs % total population Activity rates
Employment / population ratios Unemployment rates
< 15 yrs % total population Activity rates
Employment / population ratios Unemployment rates
< 15 yrs % total population Activity rates
Employment / population ratios Unemployment rates
Eur 12
138135 20339 16380 13273 2959 154514 125972 23338 280486 61332 341819
81803 3586 8581 7245 1297 90384 44341 11597 134725 31499 166223
56332 16753 7799 6028 1662 64131 81631 11740 145762 29834 175595
17.9 55.1 49.2 10.6
18.9 67.1 60.7 9.5
17.0 44.0 38.6 12.2
Belgique
België Danmark 1000
B.R. Deutschland
Males and females 3744
478 329 302 70 4073 4116 841 8189 1829 10018
2248 51 148 136 34 2396 1556 424 3952 937 4889
1496 427 181 167 36 1677 2560 417 4237 892 5129
Mai 18.3 49.7 45.7 8.1
19.2 60.6 56.9 6.2
17.4 39.6 35.3 10.8
2567 597 308 276 10 2875 1393 204 4268 866 5134 Males
1369 150 159 144 6 1527 561 98 2089 442 2531 Females
1198 447 149 132 (4) 1348 831 106 2179 424 2603 % es and fern
16.9 67.4 60.1 10.7 Males
17.5 73.1 65.5 10.4 Females
16.3 61.9 55.0 11.1
36111 5442 3002 2754 105 39113 27960 4373 67073 13037 80110
21043 620 1453 1354 57 22496 9670 2340 32166 6730 38896
15068 4823 1549 1399 48 16617 18290 2033 34907 6306 41214
ales 16.3 58.3 53.8 7.7
17.3 69.9 65.4 6.5
15.3 47.6 43.2 9.3
Ellas
3715 161 350 42 166 4066 4285 784 8350 1768 10118
2417 62 145 21 57 2562 1431 378 3993 911 4904
1299 99 205 21 109 1504 2853 406 4357 857 5214
17.5 48.7 44.5 8.6
18.6 64.2 60.5 5.7
16.4 34.5 29.8 13.6
España
11868 780 3395 3023 650 15263 16498 3597 31760 6945 38705
7876 190 1799 1640 234 9675 5578 1706 15254 3547 18800
3992 590 1596 1382 416 5587 10920 1891 16507 3398 19905
17.9 48.1 37.4 22.2
18.9 63.4 51.6 18.6
[image:16.595.60.559.102.798.2]Principal characteristics of activity of the population
France
21908 3042 2811 2435 278 24718 19810 4507 44529 11288 55817
12279 507 1314 1167 119 13592 7628 2178 21220 5779 26999
9629 2535 1497 1268 159 11126 12183 2329 23309 5509 28818
20.2 55.5 49.2 11.4
21.4 64.1 57.9 9.7
19.1 47.7 41.3 13.5
Ireland
1155 125 213 151 35 1368 1197 296 2565 904 3469
734 35 134 110 19 868 400 149 1268 464 1732
421 90 79 40 16 500 797 147 1297 440 1737
26.1 53.3 45.0 15.6
26.8 68.5 57.9 15.4
25.3 38.6 32.5 15.8
Italia Luxembourg 1000
Nederland
Males and females 20321
1105 2332 1895 1229 22652 24664 4845 47316 8799 56115
13239 326 1106 905 537 14344 8271 2381 22615 4521 27136
7082 779 1226 990 692 8308 16393 2464 24701 4278 28979
165 12 4 2 (1) 169 151 24 320 71 391 Males
105 (1) 2 (1) 107 49 13 156 37 193 Females
59 11 2 (1) 61 102 11 163 35 198
0/
6640 2324 445 291 120 7085 5098 863 12183 2788 14971
3984 611 224 171 68 4208 1795 443 6003 1425 7427
2656 1713 221 120 52 2877 3303 420 6180 1364 7544
70
Males and females 15.7
47.9 42.9 10.3
16.7 63.4 58.5 7.7
14.8 33.6 28.7 14.8
18.2 52.7 51.5 2.3 Males
19.0 68.6 67.3 1.9 Females
17.5 37.6 36.4 3.1
18.6 58.2 54.5 6.3
19.2 70.1 66.4 5.3
18.1 46.6 43.0 7.7
Portugal
4464 329 250 144 36 4714 3301 788 8015 1786 9801
2490 111 118 64 14 2608 1152 368 3760 927 4687
1974 218 132 80 22 2106 2149 420 4255 859 5114
18.2 58.8 55.7 5.3
19.8 69.4 66.2 4.5
16.8 49.5 46.4 6.3
United Kingdom
25478 5943 2941 1960 258 28419 17500 2217 45919 11250 57169
14021 922 1979 1531 152 16000 6250 1120 22250 5779 28028
11457 5021 961 428 107 12419 11250 1097 23669 5472 29141
19.7 61.9 55.5 10.3
20.6 71.9 63.0 12.4
18.8 52.5 48.4 7.7
Labour Force Survey 1993
Persons in employment -working part-time Unemployed persons
-registered at employment exchange -seeking first job
Labourforce Non-active persons
-in education
Persons 15 years and more Persons less than 15 years Total population
Persons in employment -working part-time Unemployed persons
-registered at employment exchange -seeking first job
Labour force Non-active persons
-in education
Persons 15 years and more Persons less than 15 years Total population
Persons in employment -working part-time Unemployed persons
-registered at employment exchange -seeking first job
Labourforce Non-active persons
-in education
Persons 15 years and more Persons less than 15 years Total population
< 15 yrs % total population Activity rates
Employment / population ratios Unemployment rates
< 15 yrs % total population Activity rates
Employment / population ratios Unemployment rates
< 15 yrs % total population Activity rates
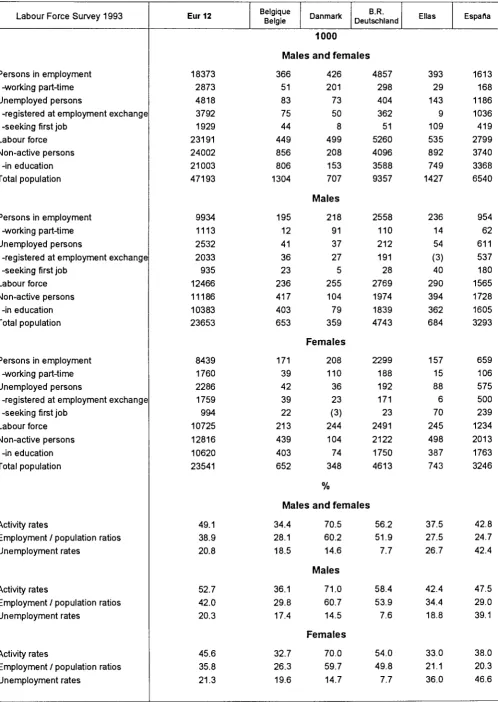
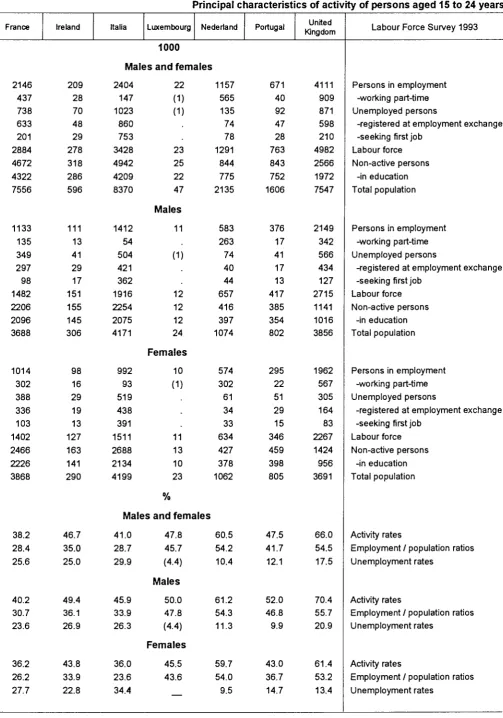
[image:17.595.49.557.92.796.2]Principal characteristics of activity of persons aged 15 to 24 years Labour Force Survey 1993
Persons in employment -working part-time Unemployed persons
-registered at employment exchange -seeking first job
Labour force Non-active persons
-in education Total population
Persons in employment -working part-time Unemployed persons
-registered at employment exchange -seeking first job
Labour force Non-active persons
-in education Total population
Persons in employment -working part-time Unemployed persons
-registered at employment exchange -seeking first job
Labour force Non-active persons
-in education Total population
Activity rates
Employment / population ratios Unemployment rates
Activity rates
Employment / population ratios Unemployment rates
Activity rates
Employment / population ratios Unemployment rates
Eur 12
18373 2873 4818 3792 1929 23191 24002 21003 47193
9934 1113 2532 2033 935 12466 11186 10383 23653
8439 1760 2286 1759 994 10725 12816 10620 23541
49.1 38.9 20.8
52.7 42.0 20.3
45.6 35.8 21.3
Belgique
België Danmark 1000
B.R. Deutschland
Males and females 366
51 83 75 44 449 856 806 1304
195 12 41 36 23 236 417 403 653
171 39 42 39 22 213 439 403 652
426 201 73 50 8 499 208 153 707 Males
218 91 37 27 5 255 104 79 359 Females
208 110 36 23 (3) 244 104 74 348
0/
4857 298 404 362 51 5260 4096 3588 9357
2558 110 212 191 28 2769 1974 1839 4743
2299 188 192 171 23 2491 2122 1750 4613
70
Males and females
34.428.1 18.5
36.1 29.8 17.4
32.7 26.3 19.6
70.5 60.2 14.6
Males
71.0 60.7 14.5 Females
70.0 59.7 14.7
56.2 51.9 7.7
58.4 53.9 7.6
54.0 49.8 7.7
Ellas
393 29 143 9 109 535 892 749 1427
236 14 54 (3) 40 290 394 362 684
157 15 88 6 70 245 498 387 743
37.5 27.5 26.7
42.4 34.4 18.8
33.0 21.1 36.0
Espana
1613 168 1186 1036 419 2799 3740 3368 6540
954 62 611 537 180 1565 1728 1605 3293
659 106 575 500 239 1234 2013 1763 3246
42.8 24.7 42.4
47.5 29.0 39.1
[image:18.595.60.559.93.796.2]Principal characteristics of activity of persons aged 15 to 24 years
France2146 437 738 633 201 2884 4672 4322 7556
1133 135 349 297 98 1482 2206 2096 3688
1014 302 388 336 103 1402 2466 2226 3868
38.2 28.4 25.6
40.2 30.7 23.6
36.2 26.2 27.7
Ireland
209 28 70 48 29 278 318 286 596
111 13 41 29 17 151 155 145 306
98 16 29 19 13 127 163 141 290
46.7 35.0 25.0
49.4 36.1 26.9
43.8 33.9 22.8
Italia Luxembourg
1000
Nederland
Males and females 2404
147 1023 860 753 3428 4942 4209 8370
1412 54 504 421 362 1916 2254 2075 4171
992 93 519 438 391 1511 2688 2134 4199
22 (1) (1)
23 25 22 47 Males
11
(D
12 12 12 24 Females
10
(D
11 13 10 23
0/
1157 565 135 74 78 1291 844 775 2135
583 263 74 40 44 657 416 397 1074
574 302 61 34 33 634 427 378 1062
70
Males and females 41.0
28.7 29.9
45.9 33.9 26.3
36.0 23.6 34.4
47.8 45.7 (4.4) Males
50.0 47.8 (4.4) Females
45.5 43.6
—
60.5 54.2 10.4
61.2 54.3 11.3
59.7 54.0 9.5
Portugal
671 40 92 47 28 763 843 752 1606
376 17 41 17 13 417 385 354 802
295 22 51 29 15 346 459 398 805
47.5 41.7 12.1
52.0 46.8 9.9
43.0 36.7 14.7
United Kingdom
4111 909 871 598 210 4982 2566 1972 7547
2149 342 566 434 127 2715 1141 1016 3856
1962 567 305 164 83 2267 1424 956 3691
66.0 54.5 17.5
70.4 55.7 20.9
61.4 53.2 13.4
Labour Force Survey 1993
Persons in employment -working part-time Unemployed persons
-registered at employment exchange -seeking first job
Labour force Non-active persons
-in education Total population
Persons in employment -working part-time Unemployed persons
-registered at employment exchange -seeking first job
Labour force Non-active persons
-in education Total population
Persons in employment -working part-time Unemployed persons
-registered at employment exchange -seeking first job
Labourforce Non-active persons
-in education Total population
Activity rates
Employment / population ratios Unemployment rates
Activity rates
Employment / population ratios Unemployment rates
Activity rates
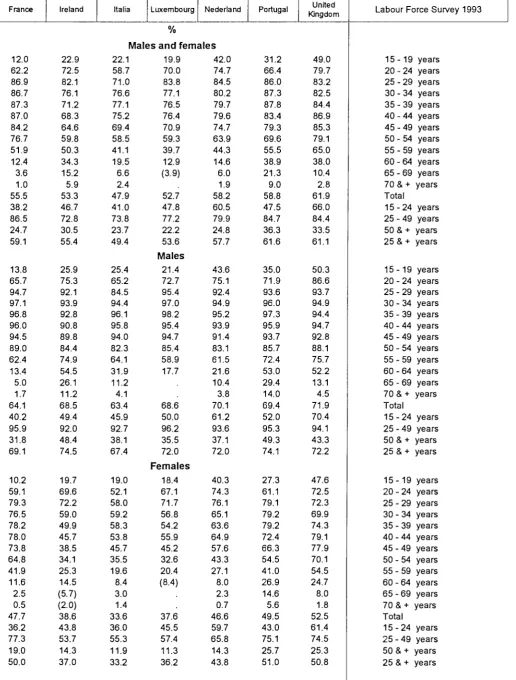
[image:19.595.46.550.81.800.2]Activity rates by age groups
Labour Force Survey 1993
15-19 20-24 25-29 30-34 35-39 40-44 45-49 50-54 55-59 60-64 65-69 70 & + Total
15-24 25-49 50 & + 25 & +
15-19 20-24 25-29 30-34 35-39 40-44 45-49 50-54 55-59 60-64 65-69 70 & + Total
15-24 25-49 50 & + 25 & +
15-19 20-24 25-29 30-34 35-39 40-44 45-49 50-54 55-59 60-64 65-69 70 & + Total 15-24 25-49 50 & + 25 & +
years years years years years years years years years years years years years years years years
years years years years years years years years years years years years years years years years
years years years years years years years years years years years years
years years years years
Eur 12
28.4 67.8 80.5 82.2 82.7 82.2 78.6 71.4 52.3 23.3 6.8 2.1 55.1 49.1 81.3 28.4 56.3
31.0 72.7 89.7 95.4 95.9 95.6 93.9 88.0 68.9 33.8 9.8 3.5 67.1 52.7 94.0 40.4 70.2
25.8 62.9 71.0 68.8 69.6 68.7 63.5 54.8 36.3 13.7 4.4 1.2 44.0 45.6 68.5 18.7 43.7
Belgique
België Danmark Deutschland B.R.
%
Males and females
7.3 58.3 87.2 86.7 83.3 80.4 72.7 56.1 33.9 11.8 2.4 0.8 49.7 34.4 82.5 17.9 52.6
8.2 61.2 92.7 95.7 94.3 94.3 90.2 77.4 48.8 19.3 3.6 (1.0) 60.6 36.1 93.6 28.2 65.5
6.5 55.3 81.4 77.5 71.9 65.9 54.7 35.0 19.6 4.9 (1.5) (0.6) 39.6 32.7 71.0 9.6 40.8
62.7 77.8 87.1 91.5 92.5 92.1 91.1 85.5 72.8 37.9 16.0 2.6 67.4 70.5 90.8 37.6 66.7
Males
61.8 79.8 90.9 94.5 94.5 95.0 94.0 90.5 81.8 47.4 22.6 4.8 73.1 71.0 93.7 46.3 73.6
Females
63.6 75.8 83.0 88.5 90.4 89.1 88.1 80.4 63.8 29.5 10.2 (1.2) 61.9 70.0 87.7 30.2 60.3
35.5 72.7 79.6 83.6 85.2 86.2 84.5 79.7 56.2 19.1 4.7 1.6 58.3 56.2 83.6 32.7 58.7
38.5 75.2 85.8 95.2 96.4 96.7 95.7 92.5 70.8 29.2 6.7 2.9 69.9 58.4 93.6 46.0 71.9
32.3 70.3 72.8 71.4 73.9 75.7 73.1 66.4 41.5 9.4 3.3 1.0 47.6 54.0 73.3 22.2 46.6
Ellas
17.5 58.5 75.2 76.9 77.5 74.7 68.6 61.4 49.3 30.6 12.9 3.6 48.7 37.5 74.6 28.5 51.0
19.1 67.6 91.7 96.1 96.9 96.6 94.5 87.3 72.6 44.7 19.5 6.0 64.2 42.4 95.2 42.6 68.7
16.1 50.3 60.4 58.6 59.2 53.1 43.8 37.2 27.3 17.6 7.3 1.7 34.5 33.0 55.2 16.0 34.8
Espana
23.2 63.3 79.1 78.2 76.0 70.8 66.0 59.3 48.3 29.8 5.3 0.8 48.1 42.8 74.3 24.4 49.4
26.1 70.0 90.0 95.4 95.6 94.9 93.3 88.6 74.2 44.7 6.4 1.3 63.4 47.5 93.7 38.9 67.8
France
12.0 62.2 86.9 86.7 87.3 87.0 84.2 76.7 51.9 12.4 3.6 1.0 55.5 38.2 86.5 24.7 59.1
13.8 65.7 94.7 97.1 96.8 96.0 94.5 89.0 62.4 13.4 5.0 1.7 64.1 40.2 95.9 31.8 69.1
10.2 59.1 79.3 76.5 78.2 78.0 73.8 64.8 41.9 11.6 2.5 0.5 47.7 36.2 77.3 19.0 50.0
Ireland
22.9 72.5 82.1 76.1 71.2 68.3 64.6 59.8 50.3 34.3 15.2 5.9 53.3 46.7 72.8 30.5 55.4
25.9 75.3 92.1 93.9 92.8 90.8 89.8 84.4 74.9 54.5 26.1 11.2 68.5 49.4 92.0 48.4 74.5
19.7 69.6 72.2 59.0 49.9 45.7 38.5 34.1 25.3 14.5 (5.7) (2.0) 38.6 43.8 53.7 14.3 37.0
Italia Luxembourg
%
Nederland
Males and females
22.1 58.7 71.0 76.6 77.1 75.2 69.4 58.5 41.1 19.5 6.6 2.4 47.9 41.0 73.8 23.7 49.4
25.4 65.2 84.5 94.4 96.1 95.8 94.0 82.3 64.1 31.9 11.2 4.1 63.4 45.9 92.7 38.1 67.4
19.0 52.1 58.0 59.2 58.3 53.8 45.7 35.5 19.6 8.4 3.0 1.4 33.6 36.0 55.3 11.9 33.2
19.9 70.0 83.8 77.1 76.5 76.4 70.9 59.3 39.7 12.9 (3.9) 52.7 47.8 77.2 22.2 53.6
Males
21.4 72.7 95.4 97.0 98.2 95.4 94.7 85.4 58.9 17.7
68.6 50.0 96.2 35.5 72.0
Females
18.4 67.1 71.7 56.8 54.2 55.9 45.2 32.6 20.4 (8.4)
37.6 45.5 57.4 11.3 36.2
42.0 74.7 84.5 80.2 79.7 79.6 74.7 63.9 44.3 14.6 6.0 1.9 58.2 60.5 79.9 24.8 57.7
43.6 75.1 92.4 94.9 95.2 93.9 91.4 83.1 61.5 21.6 10.4 3.8 70.1 61.2 93.6 37.1 72.0
40.3 74.3 76.1 65.1 63.6 64.9 57.6 43.3 27.1 8.0 2.3 0.7 46.6 59.7 65.8 14.3 43.8
Portugal
31.2 66.4 86.0 87.3 87.8 83.4 79.3 69.6 55.5 38.9 21.3 9.0 58.8 47.5 84.7 36.3 61.6
35.0 71.9 93.6 96.0 97.3 95.9 93.7 85.7 72.4 53.0 29.4 14.0 69.4 52.0 95.3 49.3 74.1
27.3 61.1 79.1 79.2 79.2 72.4 66.3 54.5 41.0 26.9 14.6 5.6 49.5 43.0 75.1 25.7 51.0
United Kingdom
49.0 79.7 83.2 82.5 84.4 86.9 85.3 79.1 65.0 38.0 10.4 2.8 61.9 66.0 84.4 33.5 61.1
50.3 86.6 93.7 94.9 94.4 94.7 92.8 88.1 75.7 52.2 13.1 4.5 71.9 70.4 94.1 43.3 72.2
47.6 72.5 72.3 69.9 74.3 79.1 77.9 70.1 54.5 24.7 8.0 1.8 52.5 61.4 74.5 25.3 50.8
Activity rates by age groups
Labour Force Survey 1993
15-19 years 20 - 24 years 25-29 years 30 - 34 years 35 - 39 years 40 - 44 years 45 - 49 years 50 - 54 years 55 - 59 years 60-64 years 65-69 years 70 & + years Total
15-24 years 25 - 49 years 50 & + years 25 & + years
15-19 years 20-24 years 25-29 years 30-34 years 35-39 years 40 - 44 years 45 - 49 years 50 - 54 years 55 - 59 years 60 - 64 years 65-69 years 70 & + years Total
15-24 years 25 - 49 years 50 & + years 25 & + years
15-19 years 20-24 years 25-29 years 30-34 years 35-39 years 40 - 44 years 45 - 49 years 50 - 54 years 55 - 59 years 60-64 years 65-69 years 70 & + years Total
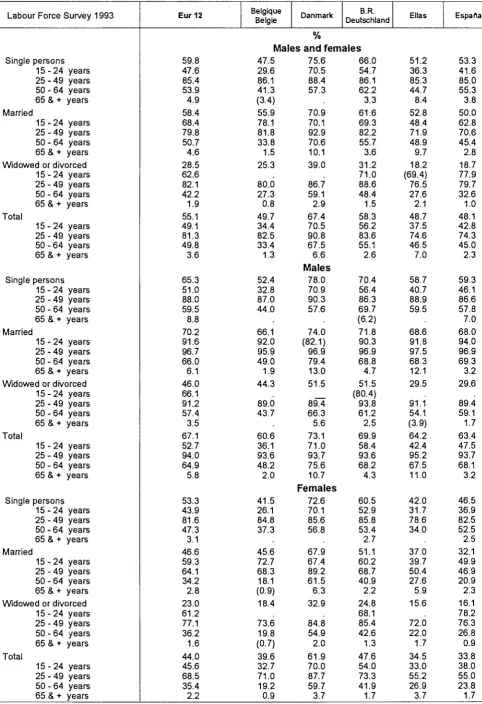
[image:21.595.41.558.102.783.2]Activity rates by marital status and broad age groups
Labour Force Survey 1993Single persons 15-24 years 25 - 49 years 50 - 64 years 65 & + years Married
15-24 years 25 - 49 years 50 - 64 years 65 & + years Widowed or divorced
15-24 years 25 - 49 years 50 - 64 years 65 & + years Total
15-24 years 25 - 49 years 50 - 64 years 65 & + years
Single persons 15-24 years 25 - 49 years 50 - 64 years 65 & + years Married
15-24 years 25 - 49 years 50 - 64 years 65 & + years Widowed or divorced
15-24 years 25 - 49 years 50 - 64 years 65 & + years Total
15-24 years 25-49 years 50 - 64 years 65 & + years
Single persons 15-24 years 25 - 49 years 50 - 64 years 65 & + years Married
15-24 years 25 - 49 years 50 - 64 years 65 & + years Widowed or divorced
15-24 years 25 - 49 years 50 - 64 years 65 & + years Total
15-24 years 25 - 49 years 50 - 64 years 65 & + years
Eur 12
59.8 47.6 85.4 53.9 4.9 58.4 68.4 79.8 50.7 4.6 28.5 62.6 82.1 42.2 1.9 55.1 49.1 81.3 49.8 3.6
65.3 51.0 88.0 59.5 8.8 70.2 91.6 96.7 66.0 6.1 46.0 66.1 91.2 57.4 3.5 67.1 52.7 94.0 64.9 5.8
53.3 43.9 81.6 47.3 3.1 46.6 59.3 64.1 34.2 2.8 23.0 61.2 77.1 36.2 1.6 44.0 45.6 68.5 35.4 2.2
Belgique
België Danmark Deutschland B.R.
%
Males and females
47.529.6 86.1 41.3 (3.4) 55.9 78.1 81.8 33.8 1.5 25.3 80.0 27.3 0.8 49.7 34.4 82.5 33.4 1.3
52.4 32.8 87.0 44.0 66.1 92.0 95.9 49.0 1.9 44.3 89.0 43.7 60.6 36.1 93.6 48.2 2.0
41.5 26.1 84.8 37.3 45.6 72.7 68.3 18.1 (0.9) 18.4 73.6 19.8 (0.7) 39.6 32.7 71.0 19.2 0.9
75.6 70.5 88.4 57.3 70.9 70.1 92.9 70.6 10.1 39.0 86.7 59.1 2.9 67.4 70.5 90.8 67.5 6.6
Males
78.0 70.9 90.3 57.6 74.0 (82.1) 96.9 79.4 13.0 51.5 89^4 66.3 5.6 73.1 71.0 93.7 75.6 10.7
Females
72.6 70.1 85.6 56.8 67.9 67.4 89.2 61.5 6.3 32.9 84.8 54.9 2.0 61.9 70.0 87.7 59.7 3.7
66.0 54.7 86.1 62.2 3.3 61.6 69.3 82.2 55.7 3.6 31.2 71.0 88.6 48.4 1.5 58.3 56.2 83.6 55.1 2.6
70.4 56.4 86.3 69.7 (6.2) 71.8 90.3 96.9 68.8 4.7 51.5 (80.4) 93.8 61.2 2.5 69.9 58.4 93.6 68.2 4.3
60.5 52.9 85.8 53.4 2.7 51.1 60.2 68.7 40.9 2.2 24.8 68.1 85.4 42.6 1.3 47.6 54.0 73.3 41.9 1.7
Ellas
51.2 36.3 85.3 44.7 8.4 52.8 48.4 71.9 48.9 9.7 18.2 (69.4) 76.5 27.6 2.1 48.7 37.5 74.6 46.5 7.0
58.7 40.7 88.9 59.5 68.6 91.8 97.5 68.3 12.1 29.5 91.1 54.1 (3.9) 64.2 42.4 95.2 67.5 11.0
42.0 31.7 78.6 34.0 37.0 39.7 50.4 27.6 5.9 15.6 72.0 22.0 1.7 34.5 33.0 55.2 26.9 3.7
Espana
53.3 41.6 85.0 55.3 3.8 50.0 62.8 70.6 45.4 2.8 18.7 77.9 79.7 32.6 1.0 48.1 42.8 74.3 45.0 2.3
59.3 46.1 86.6 57.8 7.0 68.0 94.0 96.9 69.3 3.2 29.6 89.4 59.1 1.7 63.4 47.5 93.7 68.1 3.2
[image:22.595.71.554.98.803.2]Activity rates by marital status and broad age groups
France 56.2 35.8 89.9 50.9 5.5 60.0 73.8 84.9 46.4 2.0 34.5 68.9 89.9 43.9 1.0 55.5 38.2 86.5 46.3 1.9 60.7 38.5 92.3 49.7 9.9 67.5 91.2 97.6 55.7 2.6 51.3 94.6 50.1 (1.5) 64.1 40.2 95.9 54.7 2.9 51.1 33.0 86.7 52.5 (2.6) 52.6 67.4 73.1 36.6 1.3 28.8 84.1 87.0 41.3 0.9 47.7 36.2 77.3 38.5 1.2 Ireland 55.8 46.0 85.6 57.6 15.5 56.8 67.6 69.0 49.6 10.4 18.1 65.0 32.4 3.9 53.3 46.7 72.8 49.0 8.9 59.9 48.6 87.7 63.3 25.4 77.6 90.7 93.7 75.5 15.9 32.8 86.9 55.1 68.5 49.4 92.0 72.4 16.3 50.8 43.2 82.6 47.6 36.4 57.8 46.5 22.6 13.2 53.7 24.1 (2.8) 38.6 43.8 53.7 25.2 3.1Italia Luxembourg Nederland
%
Males and females
51.3 40.2 77.7 43.4 5.6 51.2 53.3 72.4 42.0 4.7 18.2 52.1 76.6 26.8 2.0 47.9 41.0 73.8 40.5 3.9 58.6 44.9 82.6 54.0 10.9 68.0 87.9 96.9 61.9 6.6 35.6 53.1 92.2 50.0 4.8 63.4 45.9 92.7 60.8 6.6 43.0 35.1 70.6 33.0 3.1 34.7 43.9 50.6 20.7 2.2 13.7 51.0 68.7 20.6 1.4 33.6 36.0 55.3 21.6 1.9 60.4 44.9 90.2 50.9 54.4 69.0 72.7 38.4 (2.3) 32.2 85.8 30.3 52.7 47.8 77.2 37.9 (1.9)
Males
64.7 46.5 92.0 (49.6) 72.7 100.0 97.8 57.0 51.6 95.6 46.2 68.6 50.0 96.2 55.3 (2.7)Females
54.7 43.0 87.1 (52.6) 35.7 57.0 48.5 17.3 24.8 79.4 22.6 37.6 45.5 57.4 20.7 69.6 59.8 89.5 45.9 (3.0) 57.8 69.6 77.3 43.6 4.6 29.7 65.1 71.3 34.2 1.3 58.2 60.5 79.9 42.4 3.3 72.8 60.4 91.2 51.0 71.0 83.5 95.2 59.8 6.9 49.2 86.7 47.2 3.5 70.1 61.2 93.6 57.9 6.3 65.7 59.1 86.8 39.5 44.6 64.8 60.4 25.9 1.7 21.6 (62.1) 61.1 27.1 (0.7) 46.6 59.7 65.8 26.8 1.2 Portugal 53.0 44.7 83.6 56.9 15.7 65.3 77.1 84.7 55.7 16.0 31.7 (74.3) 88.8 45.5 8.1 58.8 47.5 84.7 54.7 13.3 58.9 49.9 86.9 52.9 27.6 75.6 92.6 97.1 71.6 21.1 39.7 94.4 62.0 11.2 69.4 52.0 95.3 70.7 19.8 47.0 38.9 79.7 58.7 12.0 55.2 70.9 73.5 38.9 9.2 29.7 (77.1) 87.1 42.2 7.3 49.5 43.0 75.1 40.6 8.6 United Kingdom 69.8 65.0 86.1 59.6 4.0 65.1 77.0 85.2 63.2 6.6 32.1 56.4 72.6 51.9 3.2 61.9 66.0 84.4 61.3 5.1 75.5 68.8 91.2 65.2 5.2 73.2 95.2 96.0 74.4 8.5 46.7 87.1 86.3 64.9 4.7 71.9 70.4 94.1 72.7 7.5 62.8 60.8 78.8 51.4 3.2 56.9 67.6 74.7 51.2 4.4 26.7 49.9 65.5 46.0 2.8 52.5 61.4 74.5 50.2 3.5Labour Force Survey 1993
Single persons 15-24 years 25 - 49 years 50 - 64 years 65 & + years Married
15-24 years 25 - 49 years 50 - 64 years 65 & + years Wdowed or divorced
Total
Single
15-24 years 25 - 49 years 50 - 64 years 65 & + years 15-24 years 25 - 49 years 50 - 64 years 65 & + years
persons 15 -24 years 25 - 49 years 50 - 64 years 65 & + years Married
15-24 years 25 - 49 years 50 - 64 years 65 & + years Wdowed or divorced
Total
Single
15-24 years 25 - 49 years 50 - 64 years 65 & + years 15-24 years 25 - 49 years 50 - 64 years 65 & + years
persons 15-24 years 25 - 49 years 50 - 64 years 65 & + years Married
15-24 years 25 - 49 years 50 - 64 years 65 & + years Wdowed or divorced
Total
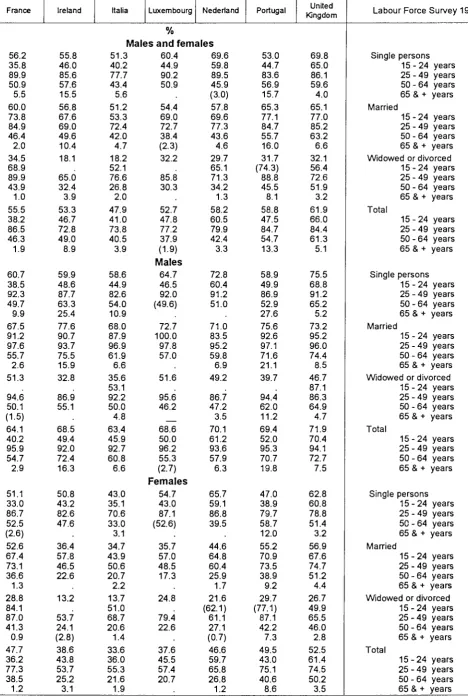
[image:23.595.44.513.98.797.2]Activity rates by nationality and broad age groups
Labour Force Survey 199315 - 24 years
25 - 49 years
50 - 64 years
65 & + years
Total
1 5 - 2 4 years
25 - 49 years
50 - 64 years
65 & + years
Total
1 5 - 2 4 years
25 - 49 years
50 - 64 years
65 & + years
Total
Nationals
Other EU countries Non-EU countries Total
Nationals
Other EU countries Non-EU countries Total
Nationals
Other EU countries Non-EU countries Total
Nationals
Other EU countries Non-EU countries Total
Nationals
Other EU countries Non-EU countries Total
Nationals
Other EU countries Non-EU countries Total
Nationals
Other EU countries Non-EU countries Total
Nationals
Other EU countries Non-EU countries Total
Nationals
Other EU countries Non-EU countries Total
Nationals
Other EU countries Non-EU countries Total
Nationals
Other EU countries Non-EU countries Total
Nationals
Other EU countries Non-EU countries Total
Nationals
Other EU countries Non-EU countries Total
Nationals
Other EU countries Non-EU countries Total
Nationals
Other EU countries Non-EU countries Total
Eur 12
49.3 51.8 43.2 49.1 81.7 80.5 69.6 81.3 49.6 56.2 59.5 49.8 3.6 3.9 5.5 3.6 54.9 62.7 59.1 55.1 52.8 56.7 49.4 52.7 94.3 94.3 86.4 94.0 64.7 67.7 72.7 64.9 5.8 5.4 7.9 5.8 66.8 73.9 72.6 67.1 45.9 46.8 36.5 45.6 69.2 64.7 50.8 68.5 35.3 41.4 39.0 35.4 2.2 (2.4) (2.9) 2.2 43.9 49.9 43.7 44.0
Belgique
België Danmark
B.R. Deutschland
%
Males and females
34.935.9 24.0 34.4 83.9 77.4 57.2 82.5 33.7 31.5 23.9 33.4 1.3
1.3 49.8 52.0 42.0 49.7 36.0 42.1 30.8 36.1 94.4 91.5 78.5 93.6 48.8 45.8 30.4 48.2 2.0
2.0 60.5 65.0 56.5 60.6
33.7 28.9 17.0 32.7 73.2 57.9 33.0 71.0 19.6 14.1 19.2 0.9
0.9 40.2 35.9 25.0 39.6
71.2 41.3 70.5 91.3 91.0 68.1 90.8 67.7 (70.8) (49.3) 67.5 6.6
6.6 67.5 75.7 56.8 67.4
Males
71.7 (45.8) 71.0 94.3 94.8 68.9 93.7 75.8
75.6 10.6
10.7 73.3 80.3 59.7 73.1
Females
70.7 (37.7) 70.0 88.2 (82.6) 67.2 87.7 59.8
59.7 3.7
3~7 62.0 68.8 53.9 61.9
56.9 56.7 50.0 56.2 84.6 82.1 72.3 83.6 54.5 65.7 66.6 55.1 2.6 (5.4) (6.1) 2.6 57.7 70.2 64.2 58.3
58.2 64.4 58.0 58.4 94.1 95.5 87.6 93.6 67.6 74.6 78.6 68.2 4.3 (7.4) 4.3 69.1 81.7 77.0 69.9 55.6 48.2 40.6 54.0 75.0 64.3 53.5 73.3 41.7 48.8 44.9 41.9 1.7
1.7 47.5 54.8 47.8 47.6
Ellas
37.3 52.4 37.5 74.6 66.1 77.2 74.6 46.6 (43.1) 46.5 7.0
7.0 48.5 48.8 62.6 48.7
42.0 68.6 42.4 95.2 (94.3) 94.3 95.2 67.5 (60.2) 67.5 11.0
11.0 64.0 (60.2) 80.0 64.2 32.9 38.3 33.0 55.1 (53.2) 59.8 55.2 26.9
26.9 3.7
3.7 34.4 (42.2) 46.3 34.5
Espana
42.8 53.6 41.7 42.8 74.3 73.9 72.4 74.3 44.9 50.9 (48.5) 45.0 2.3
2.3 48.0 48.1 57.9 48.1
47.5 (47.2) 47.5 93.8 93.4 87.6 93.7 68.1 67.2 68.1 3.2
3.2 63.4 58.3 72.4 63.4 38.0 (58.3) (38.0) 38.0 55.0 56.6 57.2 55.0 23.7 (347) 23.8 1.7
France 38.5 44.6 28.6 38.2 87.5 81.7 69.2 86.5 45.8 54.5 55.7 46.3 1.8 1.9 55.4 60.1 54.5 55.5 40.5 47.8 30.4 40.2 96.1 95.5 91.3 95.9 53.8 64.1 69.0 54.7 2.9 2.9 63.6 70.1 70.3 64.1 36.6 41.4 26.9 36.2 79.1 66.9 44.4 77.3 38.5 42.2 29.3 38.5 1.1 1.2 48.1 49.2 36.0 47.7 Ireland 46.7 54.0 46.7 72.9 71.2 59.7 72.8 48.9 (51.2) 49.0 9.0 8.9 53.3 57.8 47.6 53.3 49.5 (58.8) 49.4 92.1 90.4 (79.3) 92.0 72.5 (69.1) 72.4 16.5 16.3 68.4 72.8 58.4 68.5 43.8 (50.1) 43.8 53.9 53.6 53.7 25.0 25.2 3.1 3.1 38.4 44.6 (36.0) 38.6
Italia Luxembourg Nederland %
Males and females 40.9 (45.7) 42.7 41.0 73.8 74.7 73.2 73.8 40.4 53.8 47.7 40.5 3.8 (7.5) 3.9 47.8 54.7 53.1 47.9 46.0 47.4 45.9 92.7 94.5 90.6 92.7 60.7 (77.6) 73.2 60.8 6.6 (15.1) 6.6 63.4 65.9 69.9 63.4 36.0 36.9 36.0 55.3 59.2 53.3 55.3 21.5 27.9 21.6 1.9 1.9 33.6 44.5 36.2 33.6 45.1 52.2 (50.1) 47.8 75.2 81.7 72.3 77.2 35.0 48.7 (45.3) 37.9 (1.6)
( 1 ^ j 46.8 66.6 62.0 52.7 Males 46.7 54.7 (60.4) 50.0 95.6 97.5 94.5 96.2 52.0 67.3 55.3
(27)
62.9 80.9 79.6 68.6 Females 43.5 49.7 45.5 54.0 64.9 48.5 57.4 18.4 28.6 20.7 31.8 52.0 43.3 37.6 61.4 58.1 42.2 60.5 81.1 76.8 50.8 79.9 42.5 54.4 30.4 42.4 3.3 3.3 58.4 67.2 45.2 58.2 61.8 65.2 48.1 61.2 94.7 92.3 63.2 93.6 58.2 65.6 43.6 57.9 6.2 6.3 70.4 81.0 55.2 70.1 61.0 49.5 36.2 59.7 66.9 56.1 37.2 65.8 27.0 (32.3) 26.8 1.2 1~2 46.9 48.4 33.7 46.6Activity rates by nationality and broad age groups Portugal 47.6 (38.0) (43.7) 47.5 84.7 88.8 80.4 84.7 54.7 54.7 13.3 13.3 58.8 49.3 62.6 58.8 52.2 (48.5) 52.0 95.4 (100.0) (86.9) 95.3 70.7 70.7 19.9 19.8 69.4 62.2 69.9 69.4 43.1 43.0 75.1 75.8 75.1 40.7 40.6 8.6 8.6 49.5 (36.2) 57.6 49.5 United Kingdom 66.6 64.7 42.1 66.0 85.0 79.8 68.2 84.4 61.4 58.2 61.3 61.3 5.1 6.7 (5.6) 5.1 62.0 59.9 58.6 61.9 71.0 66.3 42.5 70.4 94.5 91.0 83.4 94.1 72.7 70.9 76.0 72.7 7.4 (9.3) 7.5 72.0 67.6 69.6 71.9 61.9 63.5 41.8 61.4 75.3 70.5 55.4 74.5 50.3 48.3 48.9 50.2 3.5 3.5 52.5 53.4 49.0 52.5
Labour Force Survey 1993
15-24 years
25 - 49 years
50 - 64 years
65 & + years
Total
15-24 years
25 - 49 years
50 - 64 years
65 & + years
Total
15-24 years
25 - 49 years
50 - 64 years
65 & + years
Total
Nationals
Other EU countries Non-EU countries Total
Nationals
Other EU countries Non-EU countries Total
Nationals
Other EU countries Non-EU countries Total
Nationals
Other EU countries Non-EU countries Total
Nationals
Other EU countries Non-EU countries Total
Nationals
Other EU countries Non-EU countries Total
Nationals
Other EU countries Non-EU countries Total
Nationals
Other EU countries Non-EU countries Total
Nationals
Other EU countries Non-EU countries Total
Nationals
Other EU countries Non-EU countries Total
Nationals
Other EU countries Non-EU countries Total
Nationals
Other EU countries Non-EU countries Total
Nationals
Other EU countries Non-EU countries Total
Nationals
Other EU countries Non-EU countries Total
Nationals
Employment/population ratios by age groups Labour Force Survey 1993
15- 19 years 20-24 years 25-29 years 30-34 years 35-39 years 40-44 years 45 - 49 years 50-54 years 55 - 59 years 60-64 years 65 - 69 years 70 & + years Total
15 - 24 years 25 - 49 years 50 & + years 25 & + years
15 -19 years 20-24 years 25-29 years 30-34 years 35-39 years 40 - 44 years 45 - 49 years 50-54 years 55-59 years 60-64 years 65-69 years 70 & + years Total
15-24 years 25 - 49 years 50 & + years 25 & + years
15-19 years 20-24 years 25-29 years 30-34 years 35-39 years 40 - 44 years 45 - 49 years 50-54 years 55 - 59 years 60-64 years 65-69 years 70 & + years Total
15-24 years 25 - 49 years 50 & + years 25 & + years
Eur 12
22.1 54.1 70.0 73.9 75.7 76.3 73.3 66.0 47.8 21.8 6.7 2.0 49.2 38.9 73.8 26.3 51.3
24.4 58.2 79.2 87.5 89.0 89.8 88.3 82.2 62.8 31.3 9.6 3.4 60.7 42.0 86.5 37.5 64.7
19.7 50.1 60.6 60.3 62.5 62.7 58.5 50.0 33.3 13.1 4.3 1.2 38.6 35.8 60.9 17.2 39.2
Belgique
België Danmark Deutschland B.R. %
Males and females 5.1
48.3 78.9 80.2 78.1 75.2 68.5 53.2 32.6 11.5 2.4 0.8 45.7 28.1 76.5 17.1 49.1
5.7 51.6 85.5 90.4 91.0 90.0 86.5 74.1 47.0 18.7 3.5 (1.0) 56.9 29.8 88.7 27.1 62.2
4.5 45.1 72.0 69.7 64.7 59.9 50.0 32.4 18.7 4.9 (1.4) (0.6) 35.3 26.3 63.9 9.1 36.9
56.8 63.4 74.6 80.9 83.2 85.3 83.3 77.4 64.8 36.3 15.5 2.6 60.1 60.2 81.3 34.4 60.1 Males
57.2 64.1 79.1 84.6 84.2 87.6 85.7 82.4 73.4 45.7 22.1 4.8 65.5 60.7 84.1 42.7 66.5 Females
56.3 62.7 69.9 77.1 82.1 83.0 80.9 72.5 56.3 28.0 9.7 (1.2) 55.0 59.7 78.4 27.4 54.1
33.6 66.5 73.3 77.2 79.0 80.5 79.1 73.2 49.9 17.7 4.7 1.6 53.8 51.9 77.6 29.8 54.2
36.4 68.7 79.7 89.5 90.7 91.8 91.2 87.0 63.5 27.0 6.7 2.8 65.4 53.9 88.1 42.6 67.4
30.5 64.4 66.5 64.4 67.1 69.0 66.9 58.7 36.1 8.8 3.2 1.0 43.2 49.8 66.7 19.7 42.2
Ellas
11.5 44.3 66.4 70.8 73.0 71.1 65.5 59.0 47.7 30.1 12.8 3.6 44.5 27.5 69.4 27.7 48.0
15.1 55.4 83.9 91.6 93.5 93.7 91.8 84.3 70.1 43.8 19.3 5.9 60.5 34.4 90.9 41.3 65.9
8.1 34.5 50.6 51.1 53.7 48.8 40.3 35.4 26.4 17.3 7.2 1.7 29.8 21.1 49.0 15.5 31.6
España I I
11.6 38.3 56.1 61.6 63.2 60.7 56.8 51.4 42.3 27.2 5.2 0.7 37.4 24.7 59.6 21.6 40.7
14.0 44.6 67.5 79.4 83.6 84.4 82.6 77.8 64.4 40.4 6.3 1.2 51.6 29.0 79.0 34.3 57.9
France
8.3 46.9 74.7 77.0 79.2 80.3 78.0 70.8 47.6 12.0 3.6 1.0 49.2 28.4 77.9 22.9 53.4
10.3 50.4 83.5 88.8 89.2 89.9 88.4 83.0 57.1 13.2 5.0 1.7 57.9 30.7 88.0 29.6 63.6
6.3 43.7 66.1 65.4 69.6 70.7 67.6 59.0 38.5 11.0 2.5 0.5 41.3 26.2 67.9 17.5 44.3
Ireland
15.4 56.4 69.5 64.9 60.9 58.7 56.2 52.9 45.8 31.9 14.9 5.7 45.0 35.0 62.3 27.8 48.1
17.5 56.6 76.2 80.1 79.8 78.2 78.6 74.6 67.8 50.6 25.6 10.9 57.9 36.1 78.6 44.2 64.8
13.0 56.1 62.8 50.4 42.2 39.0 32.9 30.1 23.3 13.6 (5.5) (1.7) 32.5 33.9 46.1 13.0 32.1
Italia Luxembourg
%
Nederland
Males and females
14.442.2 60.2 69.9 72.6 71.8 66.7 56.5 39.8 19.1 6.5 2.4 42.9 28.7 67.9 23.0 46.0
17.7 49.0 74.2 88.8 92.4 93.1 91.4 80.1 62.0 31.3 11.1 4.0 58.5 33.9 87.4 37.1 64.1
11.2 35.4 46.6 51.4 53.0 49.8 42.9 33.7 19.1 8.2 3.0 1.3 28.7 23.6 48.7 11.5 29.7
17.7 68.0 81.8 75.4 74.2 75.0 69.7 58.8 39.4 12.8 (3.7) 51.5 45.7 75.5 22.0 52.5
Males
19.2 70.5 93.5 95.2 96.6 93.6 93.6 84.8 58.3 17.4
67.3 47.8 94.6 35.2 70.9
Females
16.2 65.4 69.6 55.1 51.2 55.1 44.1 32.1 20.4 (8.4)
36.4 43.6 55.6 11.2 35.2
36.4 67.8 79.1 76.1 74.5 75.5 71.1 60.7 42.7 14.1 6.0 1.9 54.5 54.2 75.4 23.8 54.6
37.6 67.5 86.7 90.5 90.6 91.0 88.7 79.3 59.6 21.1 10.4 3.8 66.4 54.3 89.4 35.7 69.0
35.1 68.2 71.0 61.1 57.8 59.6 53.2 40.9 25.8 7.5 2.3 0.7 43.0 54.0 60.8 13.6 40.7
Employment/population ratios by age groups
Portugal27.0 58.9 80.0 82.5 84.5 80.7 77.2 67.1 53.2 38.0 21.2 9.0 55.7 41.7 81.0 35.2 59.2
31.2 65.2 88.4 91.9 94.3 93.4 91.5 82.8 68.9 51.3 29.3 13.9 66.2 46.8 91.9 47.7 71.5
22.8 52.7 72.3 73.8 75.8 69.6 64.4 52.4 39.9 26.7 14.6 5.6 46.4 36.7 71.1 25.1 48.7
United Kingdom
39.6 66.4 73.6 74.7 77.2 80.6 79.5 72.5 58.7 33.9 9.8 2.7 55.5 54.5 76.9 30.5 55.7
39.2 69.0 81.3 84.8 85.1 86.2 84.8 78.9 66.4 44.8 12.3 4.4 63.0 55.7 84.3 38.4 64.5
39.9 63.8 65.6 64.4 69.2 75.0 74.3 66.2 51.2 23.8 7.5 1.7 48.4 53.2 69.4 24.0 47.5
Labour Force Survey 1993
15-19 years 20-24 years 25 - 29 years 30-34 years 35 - 39 years 40-44 years 45 - 49 years 50 - 54 years 55 - 59 years 60 - 64 years 65-69 years 70 & + years Total
15-24 years 25 - 49 years 50 & + years 25 & + years
15 -19 years 20-24 years 25-29 years 30-34 years 35-39 years 40-44 years 45 - 49 years 50-54 years 55 - 59 years 60-64 years 65-69 years 70 & + years Total
15-24 years 25 -49 years 50 & + years 25 & + years
15-19 years 20-24 years 25-29 years 30-34 years 35-39 years 40 - 44 years 45 - 49 years 50-54 years 55 - 59 years 60-64 years 65-69 years 70 & + years Total