This is a repository copy of Characterisation of strain-induced precipitation behaviour in microalloyed steels during thermomechanical controlled processing.
White Rose Research Online URL for this paper: http://eprints.whiterose.ac.uk/119770/
Version: Accepted Version
Article:
Gong, P., Palmiere, E.J. orcid.org/0000-0002-4048-8536 and Rainforth, W.M.
orcid.org/0000-0003-3898-0318 (2017) Characterisation of strain-induced precipitation behaviour in microalloyed steels during thermomechanical controlled processing. Materials Characterization, 124. pp. 83-89. ISSN 1044-5803
https://doi.org/10.1016/j.matchar.2016.12.009
[email protected] https://eprints.whiterose.ac.uk/
Reuse
This article is distributed under the terms of the Creative Commons Attribution-NonCommercial-NoDerivs (CC BY-NC-ND) licence. This licence only allows you to download this work and share it with others as long as you credit the authors, but you can’t change the article in any way or use it commercially. More
information and the full terms of the licence here: https://creativecommons.org/licenses/
Takedown
If you consider content in White Rose Research Online to be in breach of UK law, please notify us by
1
Characterisation of strain-induced precipitation behaviour in microalloyed steels
during thermomechanical controlled processing
P. Gong, E.J. Palmiere, W.M. Rainforth*
Department of Materials Science and Engineering, The University of Sheffield, Sir Robert
Hadfield Building, Mappin Street, Sheffield, S1 3JD, UK
Abstract
The temperature at which thermomechanical controlled processing is undertaken strongly
influences strain-induced precipitation (SIP) in microalloyed steels. In this study, the
recrystallisation-precipitation-time-temperature curve was simulated to determine the full
recrystallisation temperature, recrystallisation-stop temperature and the temperature where
precipitation would occur at the shortest time. The calculated temperatures were verified by
experimental testing for rolling between 1100¡C and 850¡C. On the basis of this a finishing
deformation of 850¡C was chosen in order to maximise the precipitate number density
formed in a fully unrecrystallised austenite. The orientation relationship between the SIP in
austenite, and subsequent transformation to ferrite was identified by calculation from the
coordinate transformation matrix, and by electron diffraction in the transmission electron
microscope. The NbC formed as coherent/semi-coherent precipitates in the austenite, and
remained coherent/semi-coherent in the ferrite, indicating a Kurdjumov-Sachs orientation
relationship between the austenite and ferrite on transformation.
Keywords: Microalloyed steel; recrystallisation-precipitation-time-temperature curve;
strain-induced precipitates; orientation relationship.
2 1.! Introduction
Microalloyed steels represent an important class of steel used in the automotive, construction,
transportation and energy sectors. They are relatively easy to fabricate, and have good
strength and toughness with low carbon content and a corresponding increase in the
microalloying elements such as Nb, Ti & V [1Ð7]. Commercial processing of flat product
lines usually consists of thermomechanical controlled processing, where the finishing
deformation passes take place in the fully unrecrystallised ferrite. However, due to these
lower final deformation temperatures, problems may arise during production including high
mill loads and a corresponding high energy consumption [5]. The aim of the process is to roll
in the softer austenite region with the temperature lower than the recrystallisation stop
temperature, which gives a high accumulated strain and results in a high nucleation rate of
strain induced precipitation (SIP), refining the final grain size [6,7].It is expected that the SIP
in the austenite exhibits an orientation relationship between the precipitate and the matrix,
which are coherent/semi-coherent with austenite. Following transformation to ferrite, an
orientation relationship should be preserved, but this has not been examined in detail in the
literature. The aim of this work was to determine the orientation relationship (OR) between
precipitates and austenite transformed to ferrite.
2.! Experimental procedure
The material used in the research was a microalloyed steel containing Nb (designated ÒNb
steelÓ) that was made by vacuum induction melting and casting to 220mm×65mm×28mm
square laboratory ingots at ArcelorMittal. The chemical composition was analysed by
Sheffield Testing Laboratories as FeÐ0.067CÐ0.11SiÐ0.77MnÐ0.03NbÐ0.02Ni (wt.%). The
ingots were soaked at 1300¡C for 2 hr and were then hot-rolled into 12 mm thick plates in a
3
quenched in ice water, and then machined into plane strain compression (PSC) specimens
with dimensions of 60mm×30mm×10 mm. Prior to deformation via PSC, samples were
preheated at 1100¡C for 30s, and then air cooled to the deformation temperature at 850¡C.
Isothermal deformation of an equivalent strain of 0.3 was carried out at a constant true strain
rate of 10s-1 followed by water quench.
Optical microscopy and transmission electron microscopy (TEM) were used to investigate
the microstructures, the morphology and composition of precipitates as well as the orientation
relationship between precipitates and matrix. After cutting samples from the central areas of
PSC specimens, samples were prepared for optical microscopy in the standard way. Samples
were etched in picric acid to reveal the prior austenite grain boundaries. The average prior
austenite grain size was measured at different rolling temperatures using the linear intercept
method (ASTM E-112). To compute the prior austenite grain size in the Rolling Direction, 8
images at each deformation temperature were measured and the mean value of grain size was
determined. To identify the composition and microstructure of the precipitates, carbon
extraction replicas were prepared. Samples to produce TEM thin foil specimens were
prepared by electropolishing. TEM was performed on a JEOL 2010, operating at 200 kV, to
analyse the morphology and composition of nanometer sized precipitates as well as the OR
between SIP in the parent austenite and ferrite matrix. Chemical analysis was conducted
using an Oxford instruments energy dispersive X-ray spectroscopy (EDS) detector. The
structures of precipitates have been observed by HRTEM. The OR between SIP and ferrite
4 3.! Results
3.1!Recrystallisation-precipitation-time-temperature (RPTT) curve
The suppression of recrystallisation is important, because the extent of strain accumulation
will determine the volume fraction of the SIP and the final grain size, which are key to the
mechanical properties. It is well known that the recrystallisation behaviour for Nb steel can
be influenced by the microalloy elements, because the recrystallisation is inhibited when the
precipitates pinning force (Fpin) exceeds the driving force (FR) for recrystallisation [8], [9].
In the current work, the initial Dutta and SellarsÕs precipitation model [10] and the later Dutta,
Palmiere and SellarÕs model [11] were used to predict the precipitation behaviour by
calculating the precipitation start temperature-time diagrams (Eq. 1).
�∀.∀∃=3×10)∗[��])/�)/�)∀.∃×��� 56∀∀∀∀
78 ���
5.∃×/∀9:
8;(=>?≅)Β (1)
where �∀.∀∃ is time for 5% precipitation; [Nb] is the niobium in solution; Z is the
Zener-Hollomon parameter; �Ε is the solute supersaturation ratio expressed by considering the Nb
solution model by Palmiere et al.[12] [13]:
�Ε =
ΓΗΙ ϑΚ [Λ]
5.∀∗)ΜΝ::
Ο
(2)
The [Nb] was calculated using carbon replica specimens after reheating to 1100¡C for 30 s
followed by water quenching. Using the experimental data from the Nb microalloyed steel,
the typical ÒCÓ shaped curves were obtained and shown in Fig. 1. The nose of the
precipitation start temperature diagram for the SIP is located at 0.3 s and 840 ¡C for this steel.
There are various definitions of the recrystallisation-stop and recrystallisation-complete
temperatures. In this study, the recrystallisation-stop temperature is defined as having no
5
having at least 95% recrystallisation [14-16]. Then, considering the effect of niobium in solid
solution on the recrystallisation kinetics of austenite, Dutta and Sellars [10] provided another
model to calculate the 5% recrystallisation curves for the Nb steel using Eq. (3).
�∀.∀∃Π = 6.75×10)5∀�∀5�)Υ×��� ς∀∀∀∀∀
78 exp {(
5.6∃×/∀[
8 − 185)[��]} (3)
where �∀.∀∃Π is time for 5% recrystallisation, �∀is original grain size in µm, and ε is strain.
Finally, the full recrystallisation time expressed as a function of the recrystallized volume
fraction (X) was calculated using the Johnson et al. model [17-19] and is given by Eq. (4).
� = 1 − exp (−ln (0.95)( χ
χ:.:[δ)
5) (4)
Full recrystallisation is defined as the volume fraction of recrystallisation of at least 95%.
Then, with 95% substituted into Eq. (4), the recrystallisation finish time (�ε) can be estimated
as:
tγ = 7.66×�∀.∀∃Π (5)
Using Equations (1), (3) and (5), the interaction of precipitation and recrystallisation with
different rolling temperatures was carried out and is shown in Fig. 1. Then, the full
recrystallisation (Tl) and the recrystallisation-stop (Ts) temperatures were calculated using the
respective times for 5% and 95% recrystallisation equalling to the time for 5% SIP. Therefore,
the recrystallisation behaviour for Nb steel could be determined with the T5% at 917¡C and
T95% at 957¡C from the RPTT curve.
Fletcher predicted the recrystallization stop temperature, taking account of the strain [20]:
T5%=203-310C+657 (��)+683�)∀.ς∗η (6)
where ε is the pass strain. The predicted T5% value in this study is at 909¡C, which is as close
6
Thus, the stop temperature is approximately 917¡C, and the
recrystallisation-complete temperature is approximately 957¡C. Therefore, any deformation taking place
between these temperatures will result in a partially recrystallised microstructure. As the nose
temperature for the SIP of this steel composition is at 840¡C, the final deformation
temperature of 850¡C was selected in order to obtain the highest volume fraction of
precipitates while enabling for the deformation of fully unrecrystallised austenite.
3.2!Ae3 and Ar3 for Nb steel
The upper equilibrium temperature between ferrite and austenite, Ae3, and the ferrite start
temperature, Ar3, can be calculated using different models considering the weight percentage
of alloying elements. In this study, the equilibrium phase transformation temperature of Ae3
was calculated by Eq. (7) for low carbon steels [21]. The Blas et al. [22] model was
considered for the simulation of the γ → α start transformation temperature (Ar3), which was
derived for a low carbon content between 0.024-0.068 %wt and is expressed as Eq. (8):
�mς = 871 − 254.4 %� − 14.2%�� + 51.7%�� (7)
�υς = 903 − 328 %� − 102 %�� + 116 %�� − 0.909� (8)
where � is cooling rate with ¡C/s. In the present study, the carbon content was 0.065 %wt for
the Nb steel, which satisfied the condition of the Eqs. (7) and (8). The Ae3 was 870¡C derived
from Eq. (7). The Ar3 temperature was calculated from Eq. (8) as 796¡C, which is lower than
the rolling temperature of 850¡C. Therefore, the SIP formed in the austenite region for the
7
3.3!Prior austenite grain structure and recrystallization behaviour at different hot rolling temperatures
Fig. 2 shows representative optical images of prior austenite grains at six deformation
temperatures viz. (a) 850 ¡C, (b) 900 ¡C, (c) 950 ¡C, (d) 1000 ¡C, (e) 1050 ¡C and (f)
1100 ¡C for Nb steel. The equiaxed prior-austenite grain size was stable with the hot rolling
temperatures in the range of 1000 ¡C and 1100 ¡C for Nb steel. Fig. 3 gives the grain size as a
function of temperature. With the hot rolling temperature being reduced to 950 ¡C, the prior
austenite grains became slightly elongated in the rolling direction (RD). Decreasing the hot
rolling temperature from 900 ¡C down to 850 ¡C, the prior austenite grains became fully
elongated with size coarsening in RD.
The optical images in Figs. 2 and 3 indicate that the recrystallization stop temperature is
higher than 900 ¡C. Partial recrystallization takes place at 950 ¡C, which is the temperature
between the recrystallization limit temperature and recrystallization stop temperature. The
prior austenite grains plateau at 1000-1100 ¡C, which further illustrates that full
recrystallization occurs.
3.4!Strain induced precipitation
3.4.1! The volume fraction and composition of the strain induced precipitates
The precipitates at each rolling temperature were separated into two groups by the size
precipitate size; one group had dimensions larger than 20nm, believed to precipitates that had
not dissolved on heating, while the other group was strain induced precipitates with a size
less than 20nm. In this study, it is only focused on the strain-induced precipitates. In order to
identify the effect of the hot rolling temperatures on the strain-induced precipitation
8
Figs. 4. Then, using the amount of Nb in the precipitates, the volume fraction of precipitates
can be also expressed using Eq. (9) [5], [19], [20] and the results are shown in Fig. 5.
f(t)=[(ρr/ρprecipitate×((Z+1)/Z))/100]×{Nb} (9)
where f(t) is volume fraction of precipitates as a function of holding time; ρr and ρprecipitate are
the densities of austenite and precipitates, respectively; Z is the stoichiometric ratio of the
precipitates; {Nb} is the Nb concentration in the precipitates. From Fig. 5, the volume
fraction of precipitates as a function of rolling temperatures appears to be logical in the Nb
steel. It can be seen that the volume fraction of precipitates increased as the deformation
temperature decreased for Nb steel.
After being deformed at 850¡C to an equivalent strain of 0.3 followed by water quenching,
the morphology of the SIP was investigated by HRTEM and EDS spectrum. The HRTEM
presented in Fig. 6 (a) and (b) was taken from the same sample shown in Fig. 4 (f). The
nano-sized particle in Fig. 6 (a) and (b) has d(111) equal to 0.257nm. The EDS spectrum further
demonstrated that the particle in Fig. 6 (b) contains Nb (Fig. 6 (c)). The combined HRTEM
and EDS spectrum strongly suggest that the finer precipitate shown in Fig. 6 (a) is consistent
with NbC.
3.4.2! The observation of OR of SIP using TEM and HRTEM
The location and the OR of precipitated carbides with respect to the ferrite matrix have been
analysed following the deformation at 850 ¡C followed by water quenching, shown in Fig. 7.
The carbides in ferrite could be clearly identified by bright and dark-field imaging and the
dark-field image taken from the (111)NbC reflection from thin foil samples. Fig. 7 (a) and (b)
show that the SIP is mainly located on the dislocations. The SADPs have been used to
9
which are NbC, obey the orientation relationship with ferrite as [110]NbC//[111]Ferrite and
(111)NbC//(101)Ferrite.
High-resolution TEM (HRTEM) was used to investigate the nanometer-sized carbides. A
lattice image of the ferrite matrix containing carbides is shown in Fig. 8 which was taken
from the steel after deformation at 850¡C. The inverse fast Fourier transformation (IFFT) was
used for the carbide shown in Fig. 8 (b). The zone axis of the ferrite matrix and carbides was
identified as [111]ferrite direction in Fig. 8 (b) parallel with the [110] zone axis of carbides, i.e.:
[110]NbC//[111]ferrite. Under this condition, the lattice image of the carbide has been identified
with the d(111) spacing equal to 0.251nm. There are two carbides, shown in Fig. 8 (b), which
have the cube-cube OR with two different growing along directions of g(111) and g(111).
The OR has been identified by the fast Fourier transformed (FFT) diffractogram shown in Fig.
8 (c). The NbC precipitates obey the orientation relationship with ferrite matrix as shown by
[110]NbC//[111]Ferrite and (111)NbC//(101)Ferrite.
4! Discussion
4.1!Deformation temperature
The microstructure after deformation at different temperatures has been observed using OM
and shown in Figs. 2 and 3. There were fully equiaxed prior-austenite grains for the rolling
temperatures between 1100 ¡C and 1000 ¡C for Nb steel, which indicated that full
recrystallization had occurred (Fig. 1). The partial recrystallization structure was obtained
with the deformation temperature at 950 ¡C. With the deformation temperatures at 900 ¡C
and 850 ¡C, the prior-austenite grains were fully elongated. The observed microstructures at
different deformation temperatures fit well with the simulated full recrystallisation and
10
There was no strain-induced precipitation (assuming precipitate diameter less than 20nm)
after deformation at 1100 ¡C in the Nb steel. At 1000 ¡C, the percentage of strain-induced
precipitates was 4.8 %, which was too little to result in a sufficient Zener pinning force to halt
the recrystallization. Down to 950 ¡C, more than 50% of precipitates were smaller than 20nm
in the Nb steel. The mixed microstructures observed at 950 ¡C in the Nb steels (Fig. 2)
indicated that recrystallization occurred at the beginning and was then halted by the rapid
increase in fine precipitate numbers. As the volume fraction of strain-induced precipitates
increased with reducing the rolling temperatures to 850 ¡C, the recrystallization was fully
prevented. The highest volume fraction of strain-induced precipitates was at 850 ¡C for Nb
steel, which fits well to the calculation of the nose precipitated temperature at 840 ¡C by Eqs.
(1) and (2) (Fig. 1).
Normally, the final step of thermomechanical processing (TMP) occurs in the fully austenite
non-recrystallisation region to avoid the partial recrystallization structures and refine the final
grain size. In this study, the deformation temperature at 850 ¡C for Nb steel resulted in
non-recrystallized prior austenite microstructures. Moreover, depending on the simulated PTT
curve (Fig. 1), specimens deformed at 850 ¡C exhibited more rapid precipitation kinetics than
at other rolling temperatures. Therefore, the deformation temperature for Nb steel was
optimised at 850 ¡C.
4.2!Calculation of the OR between SIP and austenite, subsequently transformed to ferrite
The SIP formed in austenite can be related to the ferrite by the OR between austenite and
ferrite when observed at room temperature. There would be no OR between the SIP and the
ferrite matrix if recrystallisation had occurred in the austenite grains prior to any subsequent
11
ferrite, the final deformation temperature should be lower than the T5% but higher than the Ar3.
In this study, the final deformation temperature of 850¡C satisfied this requirement.
The OR between the SIP, austenite and ferrite will be discussed using the corresponding
coordinate transformation matrix and Kurdjumov-Sachs (K-S) OR. Davenport et al. [24]
indicated that the SIP and austenite have a cube-cube relationship, i.e.:
[010]precipitate//[010]austenite, (100)precipitate//(100)austenite. From the above OR of SIP (determined
as NbC) and austenite, the corresponding coordinate transformation matrix, �ψζ can be
readily determined as
�ψζ=
1.25 0 0
0 1.25 0
0 0 1.25
(10)
Then, an arbitrary pair of parallel directions, rp and �ψ, will be related by
�ζ = �ψζ�ψ (11)
With the OR matrix, the pair of conjugate planes and direction of NbC parallel with the pair
of [110]and (111) of austenite can be deduced as [110]NbC//[110]austenite, (111)NbC//(111)austenite.
It is well known that the austenite transforms to ferrite and obeys the Kurdjumov-Sachs (K-S)
OR [25]: [110]austenite//[111]ferrite, (111)austenite//(110)ferrite. The OR between SIP of NbC and
austenite transformation to ferrite can be further indicated as [110]NbC//[110]austenite//[111]ferrite,
(111)NbC//(111)austenite//(110)ferrite.
The coordinate transformation matrix of NbC and ferrite is shown in Eq. (11), which
indicates that the precipitates cannot have the same characteristics as the N-W OR (fcc/bcc
system) [26].
�εϑΚΛ=
0.479 −0.431 −0.049
0.42 −0.479 −0.108
0.108 0.049 0.636
12
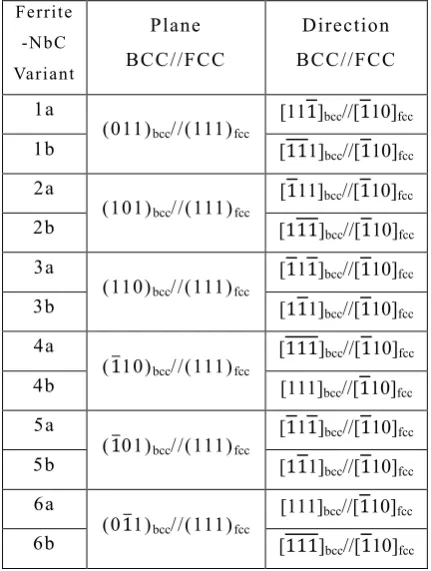
Face-centered cubic (fcc) precipitates in a body-centered cubic (bcc) ferrite can be indicated
by {111}fcc//{110}bcc and <110>fcc//<111>bcc. On a given (011) bcc plane (two-fold rotation
axis), there are two <111> directions: [111]bcc and [111]bcc, which are perpendicular. As there
are six two-fold rotation axes of {110} in bcc matrix, six variants of SIP and ferrite matrix
OR can be derived, which are listed in Table 1. The OR between the precipitates and the
matrix shown Figs. 7 and 8 are the same with the calculated OR from the corresponding
transformation matrix shown in Table 1.
Thus, the calculated cubic-cubic OR between precipitate and austenite shows that the NbC
precipitates were coherent or semi-coherent with the austenite matrix when formed by
strain-induced precipitation. The OR between NbC and the matrix was retained in the ferrite
following phase transformation on cooling, and this shows that there was a K-S OR between
austenite and ferrite. Thus, these precipitates maintained their coherency/semi-coherency
with the ferrite following transformation. This coherency/semi-coherency was only observed
in the finer (<10nm) NbC precipitates, while the coarser (much greater than 10nm)
precipitates were incoherent with the ferrite. Therefore, this shows that the NbC that forms in
the austenite with a cubic-cubic OR are expected to be finer and more likely to contribute to
the Zener pinning effect, and therefore strength enhancement.
5! Conclusions
1)! The deformation temperature of 850¡C is between the recrystallisation-stop
temperature and the Ar3, indicative of deformation taking place in fully unrecrystallised
austenite as well as obtaining the maximum volume fraction of SIP. The deformation
13 austenitic region.
2)! The SIP has been examined via analyses of HRTEM and EDS. The results strongly
suggest that these carbides are NbC which have a NaCl-type crystal structure and lattice
parameters of 0.447 nm.
3)! Finer (<10nm) NbC observed in the ferrite was coherent or semi-coherent with the
matrix. Assuming a Kurdjumov-Sachs orientation relationship between the austenite and
ferrite on transformation, this indicates that the NbC formed in the austenite as coherent or
semi-coherent precipitates with a cube on cube orientation relationship between the NbC and
the austenite. Given that the larger NbC observed was incoherent with the matrix, this
suggests that the NbC that forms coherently or semi-coherently in the austenite with a cube
on cube relationship will contribute more greatly to Zener pinning.
Acknowledgements
The authors would like to thank both ArcelorMittal Maizi•res and Companhia Brasileira de
Metalurgia e Minera•‹o (CBMM) for the financial support of this research programme.
Reference
[1] H. Meuser, F.Grimpe, S. Meimeth, C.J. Heckmann, C. Trager, Development of NbTiB Microalloyed HSLA Steels for High-Strength Heavy Plate, Microalloying for New Steel Processes and Applications Int. September 7-9 (2005) 1-8.
[2] P.C.M. Rodrigues, E.V. Pereloma, D.B. Santos, Mechanical properities of an HSLA bainitic steel subjected to controlled rolling with accelerated cooling, Mater. Sci. Eng. A 283 (1-2) (2000) 283 136-143.
[3] A. Ghosh, S. Sahoo, M. Ghosh, R.N. Ghosh, D. Chakrabarti, Effect of microstructural parameters, microtexture and matrix strain on the Charpy impact properties of low carbon HSLA steel containing MnS inclusions, Mater. Sci. Eng. A 613 (2014) 37-47.
14
[5] N. Egorov, Thermomechanical treatment of steel plates with using of cyclic bending defromation, Metal, 5 (2005) 1-6.
[6] A. Ghosh, B. Mishra, S. Das, S, Chatterjee, An ultra low carbon Cu bearing steel: influence of thermomechanical processing and aging heat treatment on structure and properties, Mater. Sci. Eng. A 374 (2004) 43-55.
[7] M. Gomez, P. Valles, S.F. Medina, Evolution of microstructure and precipitation state during thermomechanical processing of a X80 microalloyed steel, Mater. Sci. Eng. A 528 (2011) 4761-4773.
[8] W.M. Rainforth, M.P. Black, R.L. Higginson, E.J. Palmiere, C.M. Sellars, I. Prabst, P, Warbichler, F, Hofer, Precipitation of NbC in a model austenitic steel, Acta Mater. 50 (2002) 735-747.
[9] H.S. Zurob, C.R. Hutchinson, Y. Brechet, G. Purdy, Modeling recrystallization of microalloyed austenite: effect of coupling recovery, precipitation and recrystallization, Acta Mater. 50 (2002) 3077-3094.
[10] B. Dutta, C. Sellars, Effect of composition and process variables on Nb (C, N)
precipitation in niobium microalloyed austenite, Mater. Sci. Technol. 3 (1987) 197-206.
[11] B. Dutta, E.J. Palmiere, C.M. Sellars, Modelling the kinetics of strain induced precipitation in Nb microalloyed steels, Acta Mater. 49 (2001) 785-794.
[12] E.J. Palmiere, C.I. Garcia, A.J. DeArdo, Compositional and microstructural changes which attend reheating and grain coarsening in steels containing niobium, Metall. Mater. Trans. A 25 (1994) 277-286.
[13] P. Gong, E.J. Palmiere, W.M. Rainforth, Dissolution and precipitation behaviour in steels microalloyed with niobium during thermomechanical processing, Acta Mater 97 (2015) 392-403.
[14] H.K. Khaira, A.K. Jena, recrystallization/precipitation behaviour in microalloyed steels, Journal of Mater. Process. Technol. 60 (1996) 597-602.
[15] W.A. Johnson, R.F. Mehl, Reaction kinetics in processes of nucleation and growth, Trans. Am. Inst. Min. Eng. 135 (1939) 416-430.
[16] M. Tarafder, P. Sinha, A. Kundu, M. Strangwood, C. L. Davis, Fractal based correlations for Nb microalloyed steel undergoing static recrystallization, Mater. Charact. 85 (2013) 92-99.
[17] M.P. Phaniraj, B.B. Behera, A.K. Lahiri, J. Mater. Process Technol. 170 (2005) 323-335.
15
[19] C.H.P. Lupis, J.F. Elliott, Generalized interaction coefficients, Acta Metall. 14 (1966) 529-538.
[20] F. Fletcher, Meta-analysis of Tnr measurements: Determining new empirical models based on composition and strain, in Austenite Processing Symposium (Internal company presentation), 2008, pp. 1-14.
[21] S. Park, Modelling and measurement of continuous-cooling precipitation kinetics of Nb(CN) in HSLA steels, PhD Thesis in McGill University 1991.
[22] A.T. Davenport, L.C. Brossard, R.E. Miner, Precipitation in microalloyed HSLA steels, J Met. 27 (1975) 21Ð27.
[23] G. Sacks, G. Kurdjumov, Uber den MechaniBmus der Stahlhur-tung, Z. Phys. 64 (1930) 325.
[24] H.W. Yen, C.Y. Huang, J.R. Yang, Characterization of interphase-precipitated nanometer-sized carbides in a Ti-Mo-bearing steel, Scr. Mater. 61 (2009) 616-619.
[25] R.G. Baker, J. Nutting, Precipitation Processes in Steels, J. Iron and Steel Institute, 192 (1959), 257.
[26] T.N. Baker, Processes, microstructure and properies of vanadium microalloyed steels. Mater. Sci. Tech. 25 (9) (2009) 1083-1107.
16 ! ! ! ! ! ! ! ! ! ! ! ! Table 1
Six variants of NbC and Ferrite ORs in FCC/BCC system
F errite
-N b C
Varian t Plane BCC//FCC Direction BCC//FCC 1a
(011)bcc//(111)fcc [111]bcc//[110]fcc
1b [111]bcc//[110]fcc
2a
(101)bcc//(111)fcc
[111]bcc//[110]fcc
2b [111]bcc//[110]fcc
3a
(110)bcc//(111)fcc
[111]bcc//[110]fcc
3b [111]bcc//[110]fcc
4a
(110)bcc//(111)fcc
[111]bcc//[110]fcc
4b [111]bcc//[110]fcc
5a
(101)bcc//(111)fcc [111]bcc//[110]fcc
5b [111]bcc//[110]fcc
6a
(011)bcc//(111)fcc
[111]bcc//[110]fcc
6b [111]bcc//[110]fcc