This is a repository copy of
The identification of poultry processing in archaeological
ceramic vessels using in situ isotope references for organic residue analysis
.
White Rose Research Online URL for this paper:
http://eprints.whiterose.ac.uk/110715/
Version: Published Version
Article:
Colonese, Andre Carlo orcid.org/0000-0002-0279-6634, Lucquin, Alexandre Jules Andre,
Craig, Oliver Edward orcid.org/0000-0002-4296-8402 et al. (10 more authors) (2017) The
identification of poultry processing in archaeological ceramic vessels using in situ isotope
references for organic residue analysis. Journal of archaeological science. pp. 179-192.
ISSN 0305-4403
https://doi.org/10.1016/j.jas.2016.12.006
[email protected]
https://eprints.whiterose.ac.uk/
Reuse
This article is distributed under the terms of the Creative Commons Attribution (CC BY) licence. This licence
allows you to distribute, remix, tweak, and build upon the work, even commercially, as long as you credit the
authors for the original work. More information and the full terms of the licence here:
https://creativecommons.org/licenses/
Takedown
If you consider content in White Rose Research Online to be in breach of UK law, please notify us by
The identi
fi
cation of poultry processing in archaeological ceramic
vessels using
in-situ
isotope references for organic residue analysis
A.C. Colonese
a,*, A. Lucquin
a, E.P. Guedes
b, R. Thomas
c, J. Best
d, B.T. Fothergill
c,
N. Sykes
e, A. Foster
c, H. Miller
e, K. Poole
f, M. Maltby
d, M. Von Tersch
a, O.E. Craig
aaBioArCh, Department of Archaeology, University of York, York, YO10 5DD, United Kingdom b
Instituto de Bioci^encias, Universidade Federal do Rio Grande do Sul, Av. Bento Gonçalves 9500, 91501-970, Porto Alegre, RS, Brazil
cSchool of Archaeology and Ancient History, University of Leicester, University Road, Leicester, LE1 7RH, United Kingdom
dDepartment of Archaeology, Anthropology&Forensic Science, Bournemouth University, Fern Barrow, Poole, Dorset BH12 5BB, United Kingdom eDepartment of Archaeology, School of Humanities, University of Nottingham, NG7 2RD, United Kingdom
fDepartment of Archaeology, University of Sheffield, Northgate House, West Street, Sheffield, S1 4ET, United Kingdom
a r t i c l e
i n f o
Article history:
Received 14 February 2016 Received in revised form 4 November 2016 Accepted 1 December 2016 Available online 13 January 2017
Keywords:
Poultry Lipid Stable isotopes Organic residue analysis Anglo-Saxon
Pottery GC-MS GC-c-IRMS
a b s t r a c t
Poultry products are rarely considered when reconstructing pottery use through organic residue analysis, impinging upon our understanding of the changing role of these animals in the past. Here we evaluate an isotopic approach for distinguishing chicken fats from other animal products. We compare the carbon isotopes of fatty acids extracted from modern tissues and archaeological bones and demonstrate that archaeological bones from contexts associated with pottery provide suitable reference ranges for dis-tinguishing omnivorous animal products (e.g. pigs vs. chickens) in pots. When applied to pottery from the Anglo-Saxon site of Flixborough, England, we succeeded in identifying residues derived from chicken fats that otherwise could not be distinguished from other monogastric and ruminant animals using modern reference values only. This provides thefirst direct evidence for the processing of poultry or their products in pottery. The results highlight the utility of‘in-situ’archaeological bone lipids to identify omnivorous animal-derived lipids in archaeological ceramic vessels.
©2016 The Author(s). Published by Elsevier Ltd. This is an open access article under the CC BY license (http://creativecommons.org/licenses/by/4.0/).
1. Introduction
Products from omnivorous animals, such as pigs and poultry, dominate global meat production and are important for fuelling the next ‘Livestock Revolution’ (Delgado et al., 1999). Undoubtedly, these were also important commodities in many past contexts, as attested by the frequent occurrence of their skeletal remains on a wide range of archaeological sites (Maltby, 2014; O’Connor, 2014; Redding, 2015; Sykes, 2012). Whilst it is generally accepted that pig bones on archaeological sites provide evidence for the con-sumption of pork products, the use of poultry in the past is complicated by other historically and ethnographically docu-mented uses, from recreation to ritual (Sykes, 2012). Even as a foodstuff, poultry have been overlooked and underinvestigated in
the past despite their undisputed importance today as a major global resource. Therefore, whilst there is clear faunal evidence attesting to the presence of domestic chicken on European archaeological sites since later prehistory (Peters et al., 2015;
Serjeantson, 2009), it is unclear when, where and why poultry
became routinely raised for their meat and eggs and viewed pri-marily as a foodstuff. One way to unequivocally demonstrate this link is by directly detecting poultry products in domestic cooking vessels.
Archaeological ceramic vessels provide a wealth of information on resource use, offering a window into past production, storage, transport and processing of food and other commodities. Lipids (fats, oils and waxes) can be readily absorbed in unglazed, porous ceramic vessels (Evershed et al., 1999), and preserved for hundreds to thousands of years (Craig et al., 2013). Analytical techniques, involving gas chromatography (GC) and GC-mass spectrometry (GC-MS), provide a means of associating broad classes of com-pounds to their biological precursors (Evershed et al., 1999;
*Corresponding author.
E-mail addresses:[email protected],[email protected](A.C. Colonese).
Contents lists available atScienceDirect
Journal of Archaeological Science
j o u r n a l h o m e p a g e : h t t p : / / w w w . e l s e v i e r . c o m / l o c a t e / j a s
http://dx.doi.org/10.1016/j.jas.2016.12.006
Evershed, 2008). Stable carbon isotope analysis of palmitic (C16:0)
and stearic (C18:0) acids by GC-combustionestable isotope ratio MS (GC-c-IRMS) provides a complementary method for animal fat identification in archaeological ceramic vessels (Copley et al., 2003; Craig et al., 2013; Evershed et al., 2002b; Mukherjee et al., 2008; Salque et al., 2013). This latter approach is routinely used to iden-tify ruminant products (Craig et al., 2012), and dairying activities in the archaeological record. However, relatively few studies have considered using this approach to identify poultry products or to distinguish these from other omnivorous animals, such as pigs (Evershed et al., 2002b).
In a first attempt to determine the processing of poultry in ceramic vessels, we investigate a pottery assemblage from the Anglo-Saxon site of Flixborough in North Lincolnshire (England). The site was chosen as its faunal assemblage shows clear evidence of mixed monogastric and omnivorous animal exploitation, i.e. geese, chickens, pigs. To distinguish these, we measured carbon isotope values of fatty acids obtained from archaeological bones of monogastric-omnivorous animals associated with the pottery to providein-situreference values. Our aim was to determine whether different monogastric commodities were processed in ceramic vessels.
1.1. Isotopic variability in monogastric-omnivorous animal fats
The stable carbon isotopic ratios of monogastric and ruminant adipose fatty acids differ due to fundamental variations in digestive physiology and metabolic processes (Copley et al., 2003; Howland et al., 2003; Jim et al., 2004; Stott et al., 1997a). Notably, rumi-nants incorporate specific saturated compounds (e.g. C18:0) directly
from their diet into their tissues, following biohydrogenation of the unsaturated precursors in the rumen (Harrison and Leat, 1975; Krogdahl, 1985). This process leads to measurable 13C depletion compared tode novosynthesized components (e.g. C16:0). However,
distinguishing fat from economically important monogastric and omnivorous animals (e.g. pigs and poultry) is less straightforward using this approach. Omnivorous animals consume a broader range of food sources compared to herbivores and consequently the carbon in fatty acids can be derived from a wider range of macro-nutrient sources, including lipids, carbohydrates and proteins from both animals and plants (Budge et al., 2011; Howland et al., 2003; Stott et al., 1997a; Trust Hammer et al., 1998). Therefore, fatty acids from omnivores exhibit considerably larger isotopic vari-ability (e.g. Delgado-Chavero et al., 2013; Recio et al., 2013) compared to ruminant and monogastric herbivores, depending on the animal's diet and therefore husbandry practices. As these are variable in the past and most likely different from the present, modern references for omnivores may be inappropriate and ideally site specific“in-situ”baselines need to be constructed.
1.2. Archaeological bone as an in-situ baseline for organic residue analysis
All previous attempts to interpret fatty acids from archaeolog-ical pottery rely on comparison with reference fats from modern animals raised on known diets and preferably sourced close to the archaeological sites under investigation (Copley et al., 2003; Dudd and Evershed, 1998; Dunne et al., 2012; Evershed et al., 2002b; Gregg et al., 2009; Salque et al., 2013; Spangenberg et al., 2006). In Northern Europe, for example, comparative reference fats are typically derived from animals raised on C3 vegetation with the
assumption that they represent the variety of environmental/di-etary conditions experienced by past animals (Dudd and Evershed, 1998). While this is entirely reasonable for herbivore ruminants, it does not account for the greater variability in the diet of omnivores.
Furthermore modern omnivore references may not be suitable analogues for animals raised in areas that have undergone sub-stantial changes in vegetation composition during the Holocene (e.g. Near East, (Goodfriend, 1990); North Africa, (Castaneda et al.,~
2009)) or in cultural contexts where foddering strategies are known to have changed in the past (Hamilton and Thomas, 2012; Madgwick et al., 2012). Both geographic and temporal variability must be considered when deriving suitable isotopic reference ranges in order to capture environmental and cultural effects. Moreover, the use of modern reference fat inherently implies that animal fat preserved in ceramic vessels originate predominantly, or exclusively, from adipose tissue. Nevertheless, other animal tissues are similarly lipid rich (e.g. bone marrow) and thus are potential sources of animal fat preserved in ceramic vessels. The boiling of bone to release nutrients, for example in soups and broths, may provide another mechanism for transferring bone lipids to archaeological ceramics.
As soft tissues are very rarely preserved in archaeological con-texts, animal bone may provide an alternative or complementary source of fatty acids for comparison. Animal bones are often found directly associated with pottery (i.e. in the same contexts, strati-graphic units or site areas, and in rare instances within the pots themselves) and are therefore chronologically coherent with cul-tural and environmental contexts. The lipid composition in adipose tissues and cortical bone are similar in nature (Kagawa et al., 1996; Ren et al., 2008) and studies have shown that lipids are preserved in archaeological bone (Evershed et al., 1995b; Spangenberg et al., 2014; Stott and Evershed, 1996). Recently Colonese et al. (2015)
have demonstrated that endogenous palmitic (C16:0) and stearic
(C18:0) fatty acids can be recovered in sufficient quantity from
archaeological bones from a range of environments to permit stable isotope analysis by GC-C-IRMS. In agreement with earlier studies (Stott et al., 1997a, 1999) it has been shown that stable carbon isotope composition of bone lipid covaries with bone collagen (Colonese et al., 2015), supporting the endogenous origin of fatty acids and their potential for paleodietary reconstruction.
2. Flixborough
2.1. The site and economy
Excavations at Flixborough, North Lincolnshire, exposed a high-status Anglo-Saxon site with an occupation sequence stretching from the 7th to 11th centuries AD (with subsequent use in the 12the15thcenturies) (Loveluck and Gaunt, 2007; Loveluck, 1998). Over 200,000 fragments of animal bone were recovered from Flixborough, making it one of the largest assemblages of Middle to Late Anglo-Saxon date in England (Jaques et al., 2007). A hand-collected and coarse-sieved assemblage of over 41,000 mammal and bird bone fragments dating from the early 7th to late 10th century was identified to taxon. The most numerous domesticates (average %NISP) were cattle (Bos taurus,29.4%), followed by sheep/ goat (Ovies aries/Capra hircus, 27%), pig (Sus scrofa domesticus, 19.4%), chicken (Gallus gallus domesticus, 15%), and goose (Ansersp., 9.2%) respectively, although the relative proportions of these changed through time (Jaques et al., 2007).
material culture associated with their processing.
3. Material and methods
3.1. Modern samples
In order to confirm the utility of bone lipids as reference sam-ples, differences in
d
13C values of C16:0and C18:0between adipose(subcutaneous and skin fat) and bone lipid was investigated in three distinct groups of modern chickens raised in Britain. Speci-mens were slaughtered for commercial purposes or died of natural causes before the experiment. Group 1 includes 10-week old, free range specimens acquired from an organic farm in Yorkshire (CH-FR, n¼10). These specimens were fed on organic, C3-plant derived
pellets and grass; Group 2 includes 4-week old, commercial non-free range broilers (fresh class A), from a big-chain supermarket (CH-SP, n¼5); Group 3 includes>28-week old, non-commercial free-range specimens, fedad libitumwith occasional supplements of mealworms (CH-D, n¼8). Unfortunately the adipose tissue for the Group 3 was not available and could not be sampled. However the bone isotope data was included to explore variability between the populations. Bone lipid
d
13C values are also compared with previously reported values from chicken adipose tissues (Dudd and Evershed, 1998; Evershed et al., 2002b), which were 3-week old broilers fed with pellets. In chickens,de novosynthesis of fatty acids occurs mainly in the liver and it is transferred by lipoproteins to the site of deposition, whereas in pig it takes place mainly in the adi-pose tissue, similar to ruminants (Laliotis et al., 2010). In order to investigate any isotopic differences in fatty acids associated with biosynthesis, subcutaneous adipose and bone lipids were also investigated in commercial non-free range pigs from several su-permarkets and a local butcher in York (Pig-SP, n¼5). The stable carbon and nitrogen isotope composition of bone collagen was also analyzed from the modern specimens and compared with bone lipidd
13C values.3.2. Archaeological samples
Animal bones retrieved from external refuse contexts at Flix-borough (5983, 5653), dated to mid-8th to early-9th century (phase 3biv), were selected for collagen and bone lipid stable isotopic analysis. These included chicken (Chk, n¼10), goose (Gos, n¼10) and pig (Pig, n¼5). Whenever possible, samples were selected to represent individual animals by sampling the same-side of a spe-cific element. Ceramic vessels (n¼60) from 25 Anglo-Saxon con-texts were selected for molecular and isotopic analysis of extracted lipids (Table 5). These contexts were selected for their high relative abundance of chicken remains (i.e. phase 3i) and good preservation of ceramic fragments, that allowed comparison of organic residues against pottery size, shape and form. Where possible potsherds were assigned to small, medium and large sized jars and bowls (Maxey type fabric B, E, U;Table 5;Young and Vince, 2009).
3.3. Collagen extraction of modern and archaeological bones
After manually removing the adipose tissue and the bone marrow, modern chicken (ulnae and femora) and pig (ribs) bones were defatted. Lipids were removed with repeated rinses (3) of a 2:1 dichloromethane:methanol solvent solution (DCM:MeOH; 32 mL), ultrasonicated for 15 min and centrifuged (850 g) for 10 min. Samples were then rinsed with deionized water and dried at room temperature. Collagen extraction of archaeological and modern bone followed a modified Longin method (Brown et al., 1988) and details can be found in previous studies (e.g. Craig et al., 2010). Briefly, fragments of modern (100e186 mg) and
archaeological bones (245e630 mg) were demineralised using 0.6 M HCl, at 4C for several days. Samples were then rinsed with distilled water and gelatinised with 0.001 M HCl at 80C for 48 h. Initially, the supernatant containing the collagen of modern bones were ultrafiltered (30 kDa, Amicon®
Ultra-4 centrifugalfilter units; Millipore, MA, USA). Given that the bones were modern, or very well-preserved, the remaining samples were filtered using Poly-ethylene Ezee filters (Elkay Laboratories Ltd., 9 mL, pore size 60e90
m
m). There were no isotopic differences betweenultra-filtered and non-ultrafiltered samples (t-test, t¼ 1.44; p¼0.223; t¼ 1.78; p¼0.148), in agreement with previous studies (Sealy
et al., 2014). Samples were then frozen and lyophilised.
3.4. Lipid extraction: bone, adipose tissue and potsherds
Lipids were extracted from archaeological (~160e580 mg) and modern bones free of marrow (~20e250 mg) following a two-step method (Colonese et al., 2015). Archaeological and modern bones were rinsed several times in distilled water. Archaeological bones were dried at room temperature while modern bones were frozen and subsequently freeze-dried. Mechanically cleaned chunks or coarsely ground bones were lipid-extracted using the same pro-cedure as for defatting modern bones (see above). Exogenous lipids werefirst removed with 2:1 DCM:MeOH (32 mL) from each bone sample. The supernatant was removed, discarded and the bone powder was dried completely under a gentle stream of N2. The
remaining bone samples were lipid-extracted using acidified methanol (e.g. Correa-Ascencio and Evershed, 2014; Craig et al., 2013). After adding 2 mL of methanol, the samples were ultra-sonicated for 15 min. Subsequently, 400
m
L of H2SO4was added andthe samples were heated at 70C for 4 h. The samples were then centrifuged (850g) for 5 min. The supernatant was extracted with hexane (32 mL) and neutralised with K2CO3. The extracts were
then dried under a gentle stream of N2and an internal standard
(10
m
g hexatriacontane) added to each sample before further analysis by GC/MS and GC/C/IRMS. The same method (acidified methanol) was applied for the subcutaneous adipose tissue (5 and 100 mg), after tissues were rinsed repeatedly with deionized water, frozen and lyophilised.Ceramic powder drilled (d. 2 mme5 mm) from the internal sherd surface (~1 g) was lipid-extracted using the methanol (4 mL) and H2SO4(800
m
L) procedure as for bone lipids. A selection ofsamples (n¼10) were solvent extracted (DCM:MeOH; 2:1 vol/vol, 32 mL, 15 min) using established protocols (e.g.Dunne et al.,
2012). These were silylated N,O-bis(trimethylsilyl)
trifluoroacetamide at 70C for 1 h and analyzed by high temper-ature GC (HT-GC) to determine the presence of any acyl lipids (mono-, di- and triglycerides).
Bone, adipose tissue and potsherd samples were screened by GC using an Agilent 7890A gas chromatograph (Agilent Technologies, Cheadle, Cheshire, UK). The injector was splitless and maintained at 300C and injected 1
m
L of sample into the GC. The column used was a 100% Dimethylpolysiloxane DB-1 (15 m320m
m0.1m
m; J&W Scientific, Folsom, CA, USA). The carrier gas was hydrogen with a constantflow rate of 2 ml/min. The temperature program was set at 100C for 2 min, rising by 20C/min until 325 C. This tem-perature was maintained for 3 min. The total run time was 16.25 min. The lipids were quantified according to the internal standard and diluted appropriately prior to GC-MS and GC-c-IRMS as described below. To avoid co-elution, samples with a higher concentration of C18:1were also treated with AgNO3to isolate the3.5. Carbon and nitrogen stable isotope analysis of bulk collagen
Collagen samples (1 mg) were analyzed in duplicate or triplicate by EA-IRMS in a GSL analyser coupled to a 20e22 mass spec-trometer (Sercon, Crewe, UK) at the University of York. The analytical error for both
d
13C andd
15N values, calculated from repeated measurements of each sample and measurements of the bovine control from multiple extracts, was <0.2‰
(1s
).d
13C,d
15N¼[(Rsample/Rstandard 1)]1,000, where R¼13C/12C and15N/14N. The standard for
d
13C is Vienna PeeDee Belemnite (V-PDB),the standard for
d
15N is air N2. In-house collagen standards (bovinecontrol) were exchanged between laboratories (University of Bradford) to ensure accuracy.
3.6. Gas chromatography-mass spectrometry (GC-MS)
GC-MS was carried out on all samples using a 7890A Series chromatograph attached to a 5975C Inert XL mass-selective de-tector with a quadrupole mass analyser (Agilent Technologies, Cheadle, UK). The carrier gas used was helium, and the inlet/col-umn head-pressure was constant. A splitless injector was used and maintained at 300C. The GC column was inserted directly into the ion source of the mass spectrometer. The ionisation energy of the mass spectrometer was 70 eV and spectra were obtained by scan-ning between m/z 50 and 800. Three different analytical columns were used.
General screening was performed using a DB-5ms (5%-phenyl)-methylpolysiloxane column (30 m0.250 mm0.25
m
m; J&W Scientific, Folsom, CA, USA). The temperature for this column was set at 50C for 2 min, then raised by 10C min 1to 325C, where it was held for 15 min. This column was also used with the MS in Single Ion Monitoring (SIM) mode to selectively detect ions char-acteristics of alkylphenyl alkanoic acids (APAAs;m/z105,m/z262, m/z 290, m/z 318) in order to increase the sensitivity for the detection of lipids derived from aquatic products (Evershed et al., 2008a,b; Hansel et al., 2004). For this purpose, the temperature was set at 120C for 2 min, raised by 6C min 1to 260C, and then raised by 20C min 1to 325C where it was held for 10 min.A second, more polar column (DB-23, 50%-cyanopropyl-meth-ylpolysiloxane, 60 m0.25 mm0.25
m
m; J&W Scientific) was used to provide better resolution of isoprenoid fatty acids. The temperature was set at 50C for 2 min, raised by 10C min 1to 100C, then raised at 4C min 1to 250C, where it was held for 20 min. This column was also used with the MS in Single Ion Monitoring (SIM) mode to selectively detect ions characteristics of APAA (m/z105,m/z262,m/z290,m/z318).Solvent extracted samples were analyzed with a HT-DB1, 100% Dimethylpolysiloxane (15 m0.320 mm0.1
m
m) (J&W Scientific, Folsom, CA, USA). The injector was maintained at 350 C. The temperature of the oven was set at 50C for 2 min, and then raised by 10C min 1to 350C, where it was held for 15 min.3.7. Gas chromatography-combustion-isotope ratio mass spectrometry (GC-c-IRMS)
Carbon stable isotopes were determined on two fatty acid methyl esters; methyl palmitate (C16:0) and methyl stearate (C18:0)
in each extract using an Isoprime 100 (Isoprime, Cheadle, UK) linked to a Hewlett Packard 7890B series gas chromatograph (Agilent Technologies, Santa Clara, CA, USA) with an Isoprime GC5 interface (Isoprime, Cheadle, UK). The gases eluting from the chromatographic column were split into two streams. One of these was directed into an Agilent 5975C inert mass spectrometer de-tector (MSD), for sample identification and quantification, while the other was directed through the GC5 furnace held at 850C to
oxidise all carbon species into CO2. All samples were diluted with
hexane and subsequently 1
m
L of each sample was injected into a DB-5MS fused-silica column. The temperature was set for 0.5 min at 50C, and raised by 10C min 1until 300C was reached, at which it stayed for 10 min. The carrier gas was ultra-high purity grade helium with aflow rate of 3 mL min 1. Eluted products were combusted to CO2and ionized in the mass spectrometer by electronimpact. Ion intensities of m/z 44, 45, and 46 were monitored in order to automatically compute the13C/12C ratio of each peak in the extracts. Computations were made with IonVantage Software (Isoprime, Cheadle, UK) and were based on comparisons with a standard reference gas (CO2) of known isotopic composition that
was repeatedly measured. The results from the analysis are re-ported in parts per mil (
‰
) relative to an international standard (V-PDB). Replicate measurements of each sample and a mixture of fames fatty acid methyl esters (FAMEs) withd
13C values traceable to international standards were used to determine instrument preci-sion (<0.3‰
) and accuracy (<0.5‰
). Values were also corrected subsequent to analysis to account for the methylation of the carboxyl group that occurs during acid extraction. Corrections were based on comparisons with a standard mixture of C16:0and C18:0fatty acids of known isotopic composition processed in each batch as a sample.
3.8. Statistical analysis
Fatty acid
d
13C values from bone and adipose tissue in modern chicken and pig samples were compared using a pairedt-test (after checking for equality of variance with a F test) in PAST 3.x (Hammer et al., 2001).Theoretical mixing curves were computed in order to estimate the effect of mixing of different animal fats on the fatty acid
d
13C values of ceramic sherds (e.g. Dudd, 1999; Evershed, 2008;Mukherjee et al., 2008). Four mixing curves were computed
be-tween chicken and pig, goose, ruminant adipose and milk fat. This approach takes into account the average
d
13C values and the rela-tive abundance of C16:0and C18:0fatty acids from each animal fat.Fatty acid
d
13C values for goose, pig, and chicken were taken from the archaeological bones, while fatty acidd
13C values for ruminant adipose and milk were sourced from the literature (Dudd and Evershed, 1998). The relative proportions of C16:0and C18:0 fattyacids (average % of free fatty acid distribution) were taken from
Dudd (1999).
4. Results and discussion
4.1. Molecular and stable isotope composition of modern bone and adipose tissue
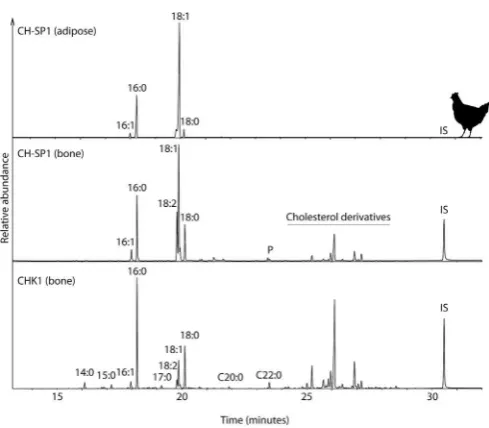
Derivatized fatty acids from bone and adipose tissues were similar for both chicken and pig samples (Fig. 1), except for a lower concentration of unsaturated and polyunsaturated fatty acids recovered in bone, which can be in part attributed to the solvent wash. Similar results were obtained for pig samples. In chicken and pig, the main lipids extracted were C18:1, C16:0, C18:0, C18:2, C20:4. In
chicken these were followed by other saturated (C12:0to C24:0),
monounsaturated (C14:1, C17:1), polyunsaturated fatty acids (C20:2,
C20:3, C20:5) and cholesterol derivatives (particularly in bone). The
fatty acid distribution is consistent with poultry fat reported in the literature (Givens et al., 2011; Koizumi et al., 1991) and some vari-ation in relative abundance between groups most likely reflects diversification in dietary components (Crespo and Esteve-Garcia, 2002). In pig samples, other extracted lipids also include satu-rated (C12:0 to C24:0), monounsaturated (C17:1 to C24:1),
cholesterol derivatives (particularly in bone).
The
d
13C values of C16:0and C18:0in bone and adipose tissues arereported inTable 1. Free range organic C3specimens (Group 1) have
average
d
13C values of C16:0 and C18:0 in subcutaneous fat of29.2±1.0
‰
and 28.9±1.2‰
respectively statistically indistin-guishable from bone ( 29.0±0.9‰
and 28.5±0.7‰
pairedt-test, t¼ 1.018, p¼0.335 and t¼ 1.659, p¼0.131 respectively). The mean pairwise differences ind
13C between adipose and bone lipidsis 0.2
‰
and 0.4‰
for C16:0and C18:0respectively. In commercial non-free range chickens (Group 2), the averaged
13C values of C16:0and C18:0are significantly lower in adipose tissue ( 29.2±0.6
‰
and 29.4 ± 0.4
‰
) compared to bone ( 28.5 ± 0.3and 28.3±0.3
‰
) by 0.8‰
(pairedt-test, t¼ 6, p¼0.003) and 1.1‰
(t¼ 7.78, p¼0.001) respectively. No significant differences were observed in the distribution ofd
13C values of C16:0and C18:0between adipose tissue ( 29.3±0.6
‰
and 28.4±0.6‰
) and bone ( 29.5±0.7‰
and 28.6±0.3‰
) from commercial pork samples (pairedt-test, t¼1.15, p¼0.327 and t¼ 1.17, p¼0.304 respec-tively). The small isotopic offset between adipose and bone lipid in chicken noticed in Group 2 might reflect differential turnover rate and isotopic fractionation duringde novosynthesis and assimila-tion from diet of fatty acid in liver, bone and adipose tissue (Nir et al., 1988). However, the magnitude of the adipose/bone pairs is small.Comparisons between bone fatty acid
d
13C values reveal no overall differences between specimens from Groups 1 and 2 (organic free range and battery) for both C16:0(t¼ 1.18, p¼0.256) and C18:0(t¼ 0.61, p¼0.549;Fig. 2). By contrast, non-commercial free-range specimens (Group 3) haved
13C values of C16:0and C18:0in bone ( 25.4±0.6
‰
and 25.8±0.9‰
) significantly higher than specimens from both Groups 1 and 2 (p<0.005 for both groups). Averaged
13C values of C16:0( 30.2‰
) and C18:0( 29.4‰
) inadi-pose chicken fat reported byDudd and Evershed (1998)also differ statistically from bone lipid from Groups 1, 2 and 3 (p<0.005 for all groups). The dietary regimes the animals were reared under have a clear effect on the isotopic composition of their fatty acid values.
In agreement with previous studies (Colonese et al., 2015; Stott et al., 1997b) both C16:0and C18:0are depleted in13C relative to bulk
[image:6.595.45.290.61.275.2]collagen from the same samples (Table 2). However, the range of the offset (ca. 3
‰
e7‰
) is greater than previously observed. The isotopic offset fundamentally reflects differences between the biosynthesis of collagen and fatty acids, and particularly the kinetic Fig. 1.Partial gas chromatograms of adipose and bone lipid extracts from modernchicken tissues (CH-SP1) and archaeological chicken bone (CHK1). Cn:xindicates fatty acid with n carbon atoms and x double bonds; P, phthalates. IS indicates internal standard.
Table 1
d13C values of C16:0and C18:0fatty acids of bone and adipose tissues from modern chicken (CH) and pig samples. Fatty acidd13C values are not corrected for the effect of modern atmosphericd13C values.
Group Sample Anat. portion Data of death Adipose Bone DC16:0 adipose-bone DC18:0 adipose-bone
d13CC16:0 d13CC18:0 D
C18-16:0 d13CC16:0 d13CC18:0 DC18-16:0
Group 1 CH-FR1 Femur 11/01/2013 30.2 30.3 0.1 29.9 29.2 0.7 0.3 1.1
CH-FR2 Femur 14/01/2014 30.3 30.3 0.0 29.4 28.7 0.7 0.9 1.6
CH-FR3 Femur 14/03/2014 28.1 27.8 0.3 27.6 27.6 0.0 0.5 0.2
CH-FR4 Femur 12/03/2014 27.7 26.9 0.8 28.0 27.4 0.6 0.3 0.5
CH-FR5 Femur 12/03/2014 30.3 30.4 0.1 29.5 28.8 0.7 0.8 1.6
CH-FR6 Femur 13/08/2014 28.6 28.3 0.3 28.7 28.6 0.1 0.1 0.3
CH-FR7 Femur 05/05/2014 28.7 28.2 0.5 29.7 28.5 1.2 1.0 0.3
CH-FR8 Femur 13/01/2016 28.9 28.7 0.2 29.4 29.3 0.1 0.5 0.6
CH-FR9 Femur 10/11/2014 30.4 30.0 0.4 29.6 29.3 0.3 0.8 0.7
CH-FR10 Femur 10/03/2016 28.4 28.4 0.0 27.7 27.4 0.3 0.7 1.0
Group 2 CH-SP1 Right wings 02/04/2015 28.9 29.1 0.2 28.4 28.2 0.2 0.5 0.9 CH-SP2 Right wings 02/04/2015 29.2 29.4 0.2 28.1 27.9 0.2 1.1 1.5 CH-SP3 Right wings 02/04/2015 29.2 29.3 0.1 28.2 28.2 0.0 1.0 1.1 CH-SP4 Right wings 02/04/2015 29.5 29.5 0.0 28.7 28.2 0.5 0.8 1.3 CH-SP5 Right wings 02/04/2015 29.3 29.5 0.2 28.9 28.8 0.1 0.4 0.7
Group 3 CH-D1 Femur 04/2012 e e e 24.4 24.1 0.3 e e
CH-D2 Femur 03/2013 e e e 24.9 26.1 1.2 e e
CH-D3 Femur 04/2012 e e e 26.2 26.2 0.0 e e
CH-D4 Femur 02/2011 e e e 25.1 25.0 0.1 e e
CH-D5 Femur 03/2013 e e e 25.4 26.6 1.2 e e
CH-D6 Femur 03/2013 e e e 25.8 26.6 0.8 e e
CH-D7 Femur 12/2010 e e e 25.9 26.1 0.2 e e
CH-D8 Femur 03/2013 e e e 25.3 25.3 0.0 e e
Pig-SP1 Rib 30/07/2015 28.4 27.4 1.0 28.4 27.3 1.1 0.0 0.1
Pig-SP2 Rib 01/08/2015 29.9 28.8 1.1 29.8 28.6 1.2 0.1 0.2
Pig-SP3 Rib 31/07/2015 29.1 28.2 0.9 29.1 28.1 1.0 0.0 0.1
Pig-SP4 Rib 29/07/2015 29.4 28.8 0.6 30.1 28.9 1.2 0.7 0.1
[image:6.595.44.561.469.743.2]isotopic fractionation associated to the oxidative decarboxylation of pyruvate to acetyl Co-A during lipid biosynthesis (DeNiro and Epstein, 1977). Strong positive correlations between bone lipid and collagen
d
13C andd
15N values confirm that the lipids are endogenous (Fig. 3).The results indicate that the
d
13C values of C16:0and C18:0in bonereflect the isotopic composition of adipose fat in chicken and pig samples. Therefore, we conclude that fatty acids from bone are a suitable reference for comparison with adipose derived fatty acids extracted from archaeological pottery.
4.2. Molecular and stable isotope composition of archaeological bone
The lipid extracts from archaeological bones (chicken, goose, pig) are in general dominated by saturated fatty acids (C12:0 to
C28:0), notably C16:0 and C18:0, and by lower concentrations of
monounsaturated fatty acids (particularly C18:1), along with some
products of cholesterol oxidation (cholesta-3,5-diene; Evershed et al., 1995b). Traces of linoleic acid (C18:2) were present in
chicken, pig and goose bones, while phytanic acid (3,7,11,15-tetramethylhexadecanoic acid) was recorded in all goose bones. These compounds are compelling evidence for the endogenous origin of lipids in the bone as they can only be incorporated through diet and are rare in the depositional environment. Phytanic acid in the goose samples is likely to be attributable to the direct ingestion of aquatic organisms (zooplanktons) (Lucquin et al., 2016; van den Brink et al., 2004; Wanders et al., 2011).
Archaeological bones yielded sufficient amounts of fatty acids for stable carbon isotopic analysis (Table 3). No significant corre-lations were observed between total fatty acid yield (
m
g g 1) and thed
13C values for both C16:0 (R2 ¼ 0.04, p ¼ 0.30) and C18:0(R2¼0.10, p¼0.11) respectively. Similarly, no significant correla-tion was observed between C16:0 yields and their
d
13C values(R2¼0.13, p¼0.06), while significant but a very weak correlation was found between C18:0yields and their
d
13C values (R2¼0.20, p¼0.02). The results confirm that degradation of fatty acids has no effect on their stable carbon isotope composition, as already demonstrated for fatty acids preserved in archaeological ceramics (e.g.Evershed et al., 1999). Furthermore moderate to high corre-lations between fatty acid and collagend
13C values (Fig. 4) support the preservation of lipids in the archaeological bone assemblages analysed, as observed in previous studies (Colonese et al., 2015). Thed
13C values of archaeological bone lipids are compared with modern authentic carcass fat and milk for the UK (Copley et al., [image:7.595.47.275.69.272.2]2003; Dudd and Evershed, 1998; Evershed et al., 2002a) from
Fig. 2. Plot ofd13C values of C16:0and C18:0fatty acids from modern chicken bones and adipose tissue. Fatty acidd13C values are not corrected for the effect of modern at-mosphericd13C values.
Table 2
Thed13C andd15N values of collagen extracted from modern chicken and pig bones and the offset with thed13C values of C16:0and C18:0fatty acids. *Samples extracted by Ultrafiltration.
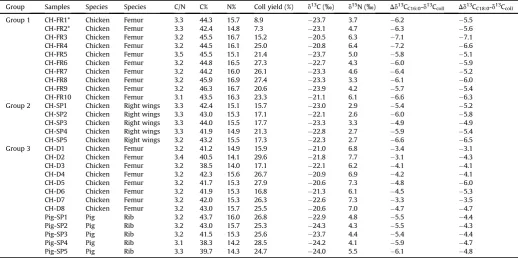
Group Samples Species Species C/N C% N% Coll yield (%) d13C (‰) d15N (‰) Dd13CC16:0-d13Ccoll Dd13CC18:0-d13Ccoll
Group 1 CH-FR1* Chicken Femur 3.3 44.3 15.7 8.9 23.7 3.7 6.2 5.5
CH-FR2* Chicken Femur 3.3 42.4 14.8 7.3 23.1 4.7 6.3 5.6
CH-FR3 Chicken Femur 3.2 45.5 16.7 15.2 20.5 6.3 7.1 7.1
CH-FR4 Chicken Femur 3.2 44.5 16.1 25.0 20.8 6.4 7.2 6.6
CH-FR5 Chicken Femur 3.5 45.5 15.1 21.4 23.7 5.0 5.8 5.1
CH-FR6 Chicken Femur 3.2 44.8 16.5 27.3 22.7 4.3 6.0 5.9
CH-FR7 Chicken Femur 3.2 44.2 16.0 26.1 23.3 4.6 6.4 5.2
CH-FR8 Chicken Femur 3.2 45.9 16.9 27.4 23.3 3.3 6.1 6.0
CH-FR9 Chicken Femur 3.2 46.3 16.7 20.6 23.9 4.2 5.7 5.4
CH-FR10 Chicken Femur 3.1 43.5 16.3 23.3 21.1 6.1 6.6 6.3
Group 2 CH-SP1 Chicken Right wings 3.3 42.4 15.1 15.7 23.0 2.9 5.4 5.2 CH-SP2 Chicken Right wings 3.3 43.0 15.3 17.1 22.1 2.6 6.0 5.8 CH-SP3 Chicken Right wings 3.3 44.0 15.5 17.7 23.3 3.3 4.9 4.9 CH-SP4 Chicken Right wings 3.3 41.9 14.9 21.3 22.8 2.7 5.9 5.4 CH-SP5 Chicken Right wings 3.2 43.2 15.5 17.3 22.3 2.7 6.6 6.5
Group 3 CH-D1 Chicken Femur 3.2 41.2 14.9 15.9 21.0 6.8 3.4 3.1
CH-D2 Chicken Femur 3.4 40.5 14.1 29.6 21.8 7.7 3.1 4.3
CH-D3 Chicken Femur 3.2 38.5 14.0 17.1 22.1 6.2 4.1 4.1
CH-D4 Chicken Femur 3.2 42.3 15.6 26.7 20.9 6.9 4.2 4.1
CH-D5 Chicken Femur 3.2 41.7 15.3 27.9 20.6 7.3 4.8 6.0
CH-D6 Chicken Femur 3.2 41.9 15.3 16.8 21.3 6.1 4.5 5.3
CH-D7 Chicken Femur 3.2 42.0 15.3 26.3 22.6 7.3 3.3 3.5
CH-D8 Chicken Femur 3.2 43.0 15.7 25.5 20.6 7.0 4.7 4.7
Pig-SP1 Pig Rib 3.2 43.7 16.0 26.8 22.9 4.8 5.5 4.4
Pig-SP2 Pig Rib 3.2 43.0 15.7 25.3 24.3 4.3 5.5 4.3
Pig-SP3 Pig Rib 3.2 41.5 15.3 25.6 23.7 4.4 5.4 4.4
Pig-SP4 Pig Rib 3.1 38.3 14.2 28.5 24.2 4.1 5.9 4.7
[image:7.595.33.552.484.742.2]ruminant and monogastric-omnivorous animals raised on C3plants
(Fig. 5). As the diet between ancient and modern herbivores is unlikely to be very different in this context, we consider these values to be a suitable proxy.
The
d
13C values of C16:0and C18:0in archaeological goose bonediffer from UK modern references. There is larger variability in archaeological samples, which probably reflects different man-agement strategies and environments, or potentially the presence of both wild and domestic geese in the archaeological sample (Budge et al., 2011; Trust Hammer et al., 1998). Finally, substantial isotopic differences are observed between omnivorous animals, notably chickens and pigs. Although pigs and chickens were being raised at elite settlements, historical documents indicate that pigs were often supplied by lower status people to elites as food rents,
with chickens also being provided in this manner (Hagen, 1995). Accordingly, the observed isotopic differences may in part reflect different management strategies by groups not resident at Flixborough.
Fatty acids from archaeological pig bones have C16:0and C18:0
consistently depleted in 13C by ~3
‰
compared to those from modern pigs originating from the UK, but are within the observed range ofd
13C values for Central Europe (Spangenberg et al., 2006). Archaeological pig bones also have narrower ranges ofd
13C values for both C16:0(0.4‰
) and C18:0(0.6‰
) compared to modernrefer-ence fat. By contrast, the
d
13C values of C16:0in chicken bones from [image:8.595.61.546.62.278.2]Flixborough are higher by ~2
‰
compared to the modern chicken sample. Differences between archaeological and modern samples may be related to differences in foddering practices and access to Fig. 3.Plot ofd13C values of C16:0and C18:0fatty acids from modern chicken bones against their respective collagend13C andd15N values.Table 3
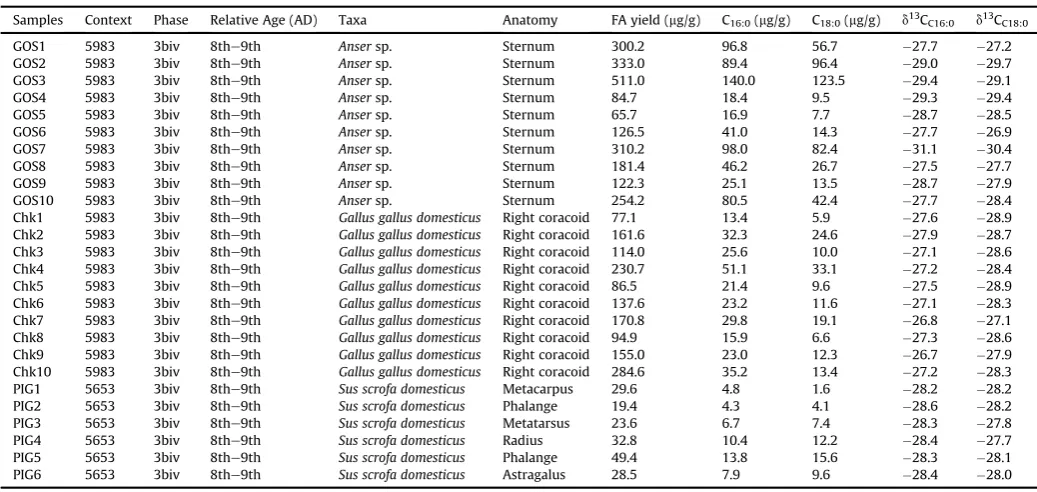
d13C values of C16:0and C18:0fatty acids of archaeological bones.
Samples Context Phase Relative Age (AD) Taxa Anatomy FA yield (mg/g) C16:0(mg/g) C18:0(mg/g) d13CC16:0 d13CC18:0
GOS1 5983 3biv 8the9th Ansersp. Sternum 300.2 96.8 56.7 27.7 27.2
GOS2 5983 3biv 8the9th Ansersp. Sternum 333.0 89.4 96.4 29.0 29.7
GOS3 5983 3biv 8the9th Ansersp. Sternum 511.0 140.0 123.5 29.4 29.1
GOS4 5983 3biv 8the9th Ansersp. Sternum 84.7 18.4 9.5 29.3 29.4
GOS5 5983 3biv 8the9th Ansersp. Sternum 65.7 16.9 7.7 28.7 28.5
GOS6 5983 3biv 8the9th Ansersp. Sternum 126.5 41.0 14.3 27.7 26.9
GOS7 5983 3biv 8the9th Ansersp. Sternum 310.2 98.0 82.4 31.1 30.4
GOS8 5983 3biv 8the9th Ansersp. Sternum 181.4 46.2 26.7 27.5 27.7
GOS9 5983 3biv 8the9th Ansersp. Sternum 122.3 25.1 13.5 28.7 27.9
GOS10 5983 3biv 8the9th Ansersp. Sternum 254.2 80.5 42.4 27.7 28.4
[image:8.595.42.561.333.579.2]food sources with variable lipid content and isotopic signatures. Most likely, Medieval pigs and chickens were raised on a mixture of plants and animal products, however measurable differences be-tween pigs and chickens also point toward species-specific hus-bandry practices. This is further supported by collagen
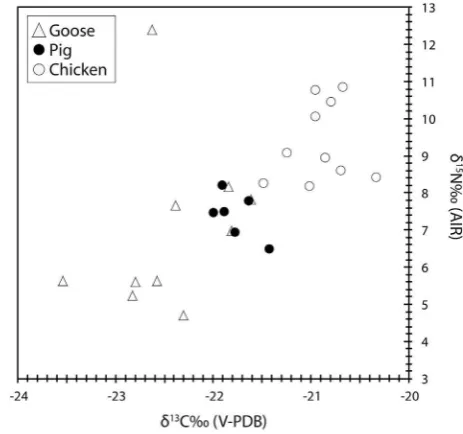
d
13C andd
15N values (Fig. 6;Table 4), which reveal that chickens had access to food sources at a higher trophic position than pigs or their diet contained a higher proportion of animal to plant products. Patho-logical data provide further information about how pigs were raised at Flixborough. Frequencies of linear enamel hypoplasia on pig teeth indicate the Flixborough pigs were kept in a semi-natural husbandry regime, including use of a woodland environment, which provided suitable foraging opportunities (Dobney et al., 2002). Interestingly,O'Connell and Hull's (2011) synthesis of ani-mal isotope data from the Anglo-Saxon period (predominantly Early and Middle-Saxon) indicated that the degree of omnivoryamong the pigs was not high, showing some overlap with sheep and cattle. This was consistent with the pigs being raised in a free-range system, including pannage. The chickens and geese in their samples also have elevated
d
15N values compared to other species. Data from Flixborough thus supports the view that chickens were generally raised in local/household settings, while pigs had greater access to woodland products and higher plant content in their diet. The contribution of animal products to chicken diet is further confirmed by the correlations betweend
13C of fatty acids and collagen (Fig. 4). The high correlation betweend
13C values of C16:0and collagen reveals that the C16:0fatty acid in pig, chicken and
goose bones was predominantly synthesizedde novofrom carbo-hydrates and protein precursors. By contrast the lower correlation observed between
d
13C values of C18:0and collagen, mainly due toan overall13C-depletion in the C18:0fatty acid of chickens is more
[image:9.595.51.535.71.269.2]difficult to explain. This could imply some degree of direct incor-poration of C18:0fatty acid in chicken bone from diet (Bai~ao and
[image:9.595.309.541.307.524.2]Fig. 4.Plot ofd13C values of C16:0and C18:0fatty acids from pig, chicken and geese bones against their respective collagend13C andd15N values.
Fig. 5.d13C values of C16:0and C18:0fatty acids from archaeological bones. Data are compared with ellipses (68% confidence) calculated for fatty acid d13C values of modern samples from the UK (Dudd and Evershed, 1998).
[image:9.595.46.278.309.523.2]Lara, 2005; Villaverde et al., 2006).
4.3. Molecular and stable isotope composition of organic residues in archaeological ceramics
Appreciable amounts of absorbed lipids were extracted from the majority of analyzed potsherds (90%, n¼54), demonstrating rela-tively good preservation, with concentrations up to ~2 mg g 1 (average 1.02 mg g 1) compared to other studies (Evershed, 2008; Evershed et al., 2008a,b). They revealed a range of saturated and unsaturated mid-chain lengthn-alkanoic acids (fatty acids) with even numbers of carbon atoms, particularly dominated by C16:0and
C18:0(Table 5;Fig. 7). Most of these samples contain trace amounts
of isoprenoid fatty acids (phytanic acid), short chain diacids, scarce amounts of cholesterol and long mid-chain ketones. These com-pounds demonstrate that the vessels were used for heating animal fat, possibly along with plant resources (Baeten et al., 2013; Evershed et al., 1995a; Raven et al., 1997). Traces of C16and C18
u
-(o-alkylphenyl) alkanoic acids (APAAs), likely formed from mono-di and tri-unsaturated fatty acid precursors (Hansel et al., 2004) were found in most of the sherds, along with short-chain alkanes. Significantly however, longer chain length APAAs typically formed from processing aquatic organisms (Evershed et al., 2008a,b) were absent, even when the MS was used to selectively monitor ions from these compounds thereby maximising the chance of detec-tion. Other lipids at high concentration in aquatic tissues, such as 4,8,12-TMTD (Hansel et al., 2004), were also absent. Therefore thereis no evidence that fish were processed in pottery from
Flixborough.
Triacylglycerols (TAGs) were recovered from only two sherds out of ten that were solvent extracted. The acyl carbon distribution of TAGs in these samples (C42-C50and C46-C54) is consistent with
dairy and ruminant adipose fat respectively, and this inference is supported by their
d
13C values of C16:0and C18:0. Apart from theseobservations, there were no other compounds that could be used to further resolve the source of the residue. Most likely, extensive
degradation has substantially altered the original lipid
distributions.
Identification of the degraded animal fats recovered from the pottery was assessed through the determination of the
d
13C values of C16:0and C18:0(Table 5). The results were compared with fattyacid
d
13C values from archaeological bones (pig, chicken, goose) and modern ruminant adipose and milk reference for the UK (Dudd and Evershed, 1998). Over half of the potsherds (62.9%) have fatty acidd
13C values broadly consistent with modern ruminant adipose fat (Fig. 8). However, as these values fall between the ellipses of modern ruminant adipose and dairy as well as archaeological monogastric-omnivore bone fats, mixing of these commodities would produce similar results. Such equifinality cannot be easily resolved. The remaining potsherds have fatty acidd
13C values that fall within the reference ranges for archaeological bone fat from pig and goose (16.6%), chicken (9.25%) and modern ruminant milk (7.4%). Notably, the three vessels that produced almost identical values to archaeological chicken bones are from the 8e9th century. These data are not as easily explained by mixing of different fats. From theoretical mixing curves, it is crudely estimated that these three ceramic sherds must contain at least 90% chicken fat if mixed with pig/goose or ruminant carcass fat (Fig. 8). Modelling mixtures of other fats (curves not shown) does not produce values that plot within the chicken ellipse.The results therefore represent thefirst direct identification of poultry lipids in archaeological ceramic vessels and implies that these three vessels, at least, were used largely for this purpose. However, further consideration of uncertainties associated with the reference ranges of different fatty acids in the source fats and their concentration is needed to discern the degree to which other commodities may have been mixed in these vessels. The decon-volution of multiple sources requires the development and appli-cation of more sophisticated mixing models.
[image:10.595.43.563.84.326.2]The vessel typology was only evident in approximately half of the vessels that produced interpretable lipid residues but some preliminary observations could still be made (Table 5). For example, residues from the omnivorous animals were only clearly distin-guishable in jars, which generally had a wider range of uses compared to bowls. Similar results were observed in the early medieval site of West Cotton, in Britain, where jars contained the Table 4
Thed13C andd15N values of archaeological bone collagen.
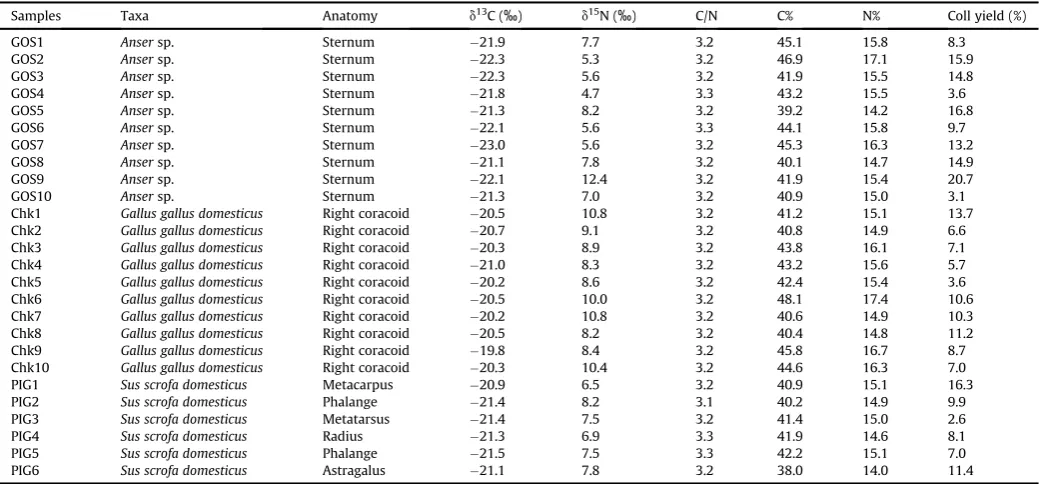
Samples Taxa Anatomy d13C (‰) d15N (‰) C/N C% N% Coll yield (%)
GOS1 Ansersp. Sternum 21.9 7.7 3.2 45.1 15.8 8.3
GOS2 Ansersp. Sternum 22.3 5.3 3.2 46.9 17.1 15.9
GOS3 Ansersp. Sternum 22.3 5.6 3.2 41.9 15.5 14.8
GOS4 Ansersp. Sternum 21.8 4.7 3.3 43.2 15.5 3.6
GOS5 Ansersp. Sternum 21.3 8.2 3.2 39.2 14.2 16.8
GOS6 Ansersp. Sternum 22.1 5.6 3.3 44.1 15.8 9.7
GOS7 Ansersp. Sternum 23.0 5.6 3.2 45.3 16.3 13.2
GOS8 Ansersp. Sternum 21.1 7.8 3.2 40.1 14.7 14.9
GOS9 Ansersp. Sternum 22.1 12.4 3.2 41.9 15.4 20.7
GOS10 Ansersp. Sternum 21.3 7.0 3.2 40.9 15.0 3.1
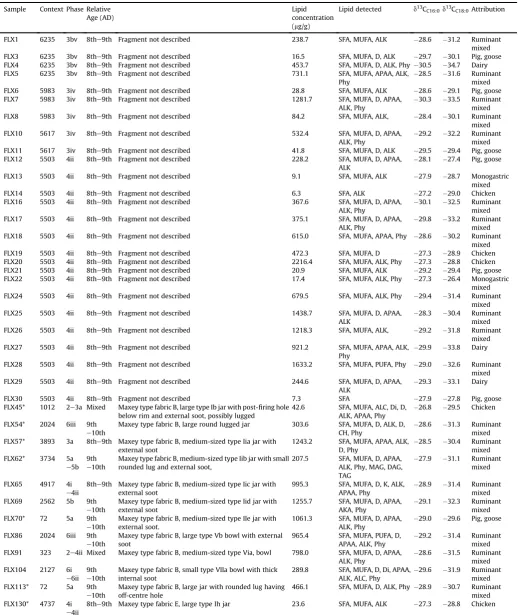
Table 5
The description of the pottery sherds submitted for analysis and details of the absorbed lipid residues detected. Composition of lipid extracts. Abbreviations: SFA, saturated fatty acid; MUFA, monounsaturated fatty acid; PUFA, polyunsaturated fatty acid; K, mid-chain ketones; ALK,n-alkanes; ALC,n-alcohols; Di, diols; D, diacids; CH, cholesterol, Phy, Phytanic acid; APAA, C16and C18-u-(o-alkylphenyl) alkanoic acids; MAG, monoacylglycerols; DAG, diacylglycerols; TAG, triacylglycerol. Phases, contexts and relative age (AD) fromYoung and Vince (2009). Samples trimethylsilylated*. Attributions have been made according to thed13CFAproximity to the reference ranges shown inFig. 8and therefore indicate only the most prominent source of animal fat contributing to the contents.
Sample Context Phase Relative Age (AD)
Lipid concentration (mg/g)
Lipid detected d13CC16:0d13CC18:0Attribution
FLX1 6235 3bv 8the9th Fragment not described 238.7 SFA, MUFA, ALK 28.6 31.2 Ruminant mixed FLX3 6235 3bv 8the9th Fragment not described 16.5 SFA, MUFA, D, ALK 29.7 30.1 Pig, goose FLX4 6235 3bv 8the9th Fragment not described 453.7 SFA, MUFA, D, ALK, Phy 30.5 34.7 Dairy FLX5 6235 3bv 8the9th Fragment not described 731.1 SFA, MUFA, APAA, ALK,
Phy
28.5 31.6 Ruminant mixed FLX6 5983 3iv 8the9th Fragment not described 28.8 SFA, MUFA, ALK 28.6 29.1 Pig, goose FLX7 5983 3iv 8the9th Fragment not described 1281.7 SFA, MUFA, D, APAA,
ALK, Phy
30.3 33.5 Ruminant mixed FLX8 5983 3iv 8the9th Fragment not described 84.2 SFA, MUFA, ALK, 28.4 30.1 Ruminant
mixed FLX10 5617 3iv 8the9th Fragment not described 532.4 SFA, MUFA, D, APAA,
ALK, Phy
29.2 32.2 Ruminant mixed FLX11 5617 3iv 8the9th Fragment not described 41.8 SFA, MUFA, D, ALK 29.5 29.4 Pig, goose FLX12 5503 4ii 8the9th Fragment not described 228.2 SFA, MUFA, D, APAA,
ALK
28.1 27.4 Pig, goose
FLX13 5503 4ii 8the9th Fragment not described 9.1 SFA, MUFA, ALK 27.9 28.7 Monogastric mixed FLX14 5503 4ii 8the9th Fragment not described 6.3 SFA, ALK 27.2 29.0 Chicken FLX16 5503 4ii 8the9th Fragment not described 367.6 SFA, MUFA, D, APAA,
ALK, Phy
30.1 32.5 Ruminant mixed FLX17 5503 4ii 8the9th Fragment not described 375.1 SFA, MUFA, D, APAA,
ALK, Phy
29.8 33.2 Ruminant mixed FLX18 5503 4ii 8the9th Fragment not described 615.0 SFA, MUFA, APAA, Phy 28.6 30.2 Ruminant
mixed FLX19 5503 4ii 8the9th Fragment not described 472.3 SFA, MUFA, D 27.3 28.9 Chicken FLX20 5503 4ii 8the9th Fragment not described 2216.4 SFA, MUFA, ALK, Phy 27.3 28.8 Chicken FLX21 5503 4ii 8the9th Fragment not described 20.9 SFA, MUFA, ALK 29.2 29.4 Pig, goose FLX22 5503 4ii 8the9th Fragment not described 17.4 SFA, MUFA, ALK, Phy 27.3 26.4 Monogastric
mixed FLX24 5503 4ii 8the9th Fragment not described 679.5 SFA, MUFA, ALK, Phy 29.4 31.4 Ruminant
mixed FLX25 5503 4ii 8the9th Fragment not described 1438.7 SFA, MUFA, D, APAA,
ALK
28.3 30.4 Ruminant mixed FLX26 5503 4ii 8the9th Fragment not described 1218.3 SFA, MUFA, ALK, 29.2 31.8 Ruminant
mixed FLX27 5503 4ii 8the9th Fragment not described 921.2 SFA, MUFA, APAA, ALK,
Phy
29.9 33.8 Dairy
FLX28 5503 4ii 8the9th Fragment not described 1633.2 SFA, MUFA, PUFA, Phy 29.0 32.6 Ruminant mixed FLX29 5503 4ii 8the9th Fragment not described 244.6 SFA, MUFA, D, APAA,
ALK
29.3 33.1 Dairy
FLX30 5503 4ii 8the9th Fragment not described 7.3 SFA 27.9 27.8 Pig, goose FLX45* 1012 2e3a Mixed Maxey type fabric B, large type Ib jar with post-firing hole
below rim and external soot, possibly lugged
42.6 SFA, MUFA, ALC, Di, D, ALK, APAA, Phy
26.8 29.5 Chicken
FLX54* 2024 6iii 9th e10th
Maxey type fabric B, large round lugged jar 303.6 SFA, MUFA, D, ALK, D, CH, Phy
28.6 31.3 Ruminant mixed FLX57* 3893 3a 8the9th Maxey type fabric B, medium-sized type Iia jar with
external soot
1243.2 SFA, MUFA, APAA, ALK, D, Phy
28.5 30.4 Ruminant mixed FLX62* 3734 5a
e5b 9th e10th
Maxey type fabric B, medium-sized type Iib jar with small rounded lug and external soot,
207.5 SFA, MUFA, D, APAA, ALK, Phy, MAG, DAG, TAG
27.9 31.1 Ruminant mixed
FLX65 4917 4i e4ii
8the9th Maxey type fabric B, medium-sized type Iic jar with external soot
995.3 SFA, MUFA, D, K, ALK, APAA, Phy
28.9 31.4 Ruminant mixed FLX69 2562 5b 9th
e10th
Maxey type fabric B, medium-sized type Iid jar with external soot
1255.7 SFA, MUFA, D, APAA, AKA, Phy
29.1 32.3 Ruminant mixed FLX70* 72 5a 9th
e10th
Maxey type fabric B, medium-sized type IIe jar with external soot.
1061.3 SFA, MUFA, D, APAA, ALK, Phy
29.0 29.6 Pig, goose
FLX86 2024 6iii 9th e10th
Maxey type fabric B, large type Vb bowl with external soot
965.4 SFA, MUFA, PUFA, D, APAA, ALK, Phy
29.2 31.4 Ruminant mixed FLX91 323 2e4ii Mixed Maxey type fabric B, medium-sized type Via, bowl 798.0 SFA, MUFA, D, APAA,
ALK, Phy
28.6 31.5 Ruminant mixed FLX104 2127 6i
e6ii 9th e10th
Maxey type fabric B, small type VIIa bowl with thick internal soot
289.8 SFA, MUFA, D, Di, APAA, ALK, ALC, Phy
29.6 31.9 Ruminant mixed FLX113* 72 5a 9th
e10th
Maxey type fabric B, large jar with rounded lug having off-centre hole
466.1 SFA, MUFA, D, ALK, Phy 28.9 30.7 Ruminant mixed FLX130* 4737 4i
e4ii
largest range of lipid compounds and may have had a more ver-satile function compared to other vessels (Charters et al., 1993). By contrast, pottery size and fabric did not influence lipid distribution and isotopic composition.
Study of the faunal bone assemblage from Flixborough has shown that animal exploitation was mainly focused on cattle and sheep, followed by pigs and poultry (chicken, geese) in the mid-8th to early 9thcentury. Organic residue analysis demonstrates that all these animals were processed in ceramic containers, as well as dairy products, as may have been expected. The pottery evidence that poultry were processed in the same way and probably mixed with multiple products from other livestock and perhaps perceived similarly, at least in terms of their culinary value. However, it is important to point out that using this isotopic approach we cannot differentiate lipids derived from chicken eggs or meat. Ruminant products (meat and/or dairy) appear to be the most frequently processed animal resource in ceramic containers at Flixborough, followed by dairy products and then omnivorous animals, including chickens, which show some similarities with the relative abundance of faunal remains (Jaques et al., 2007). However, further determination of the proportional contribution of poultry and other products to the pottery at Flixborough currently lacks accu-rate quantification using the approach we have described.
4.4. Archaeological implications
This study emphasises the value of conducting isotopic analyses of residues and integrating zooarchaeological remains and ceramic artefacts. Compared to larger mammals such as cattle, sheep and pig, bird bones are often overlooked during excavation because of their small size and are therefore potentially under-represented in many faunal assemblages. Similarly, avian products are rarely
considered in studies of pottery use or when reconstructing human diet using stable isotopes. These changes were not uniform across all of society however. Greater numbers of bones of chickens, and domestic birds more generally, are found at high status and ecclesiastical sites during the Middle and Late Anglo-Saxon periods (Poole and Lacey, 2014). Comparison of different sites thus has real potential to demonstrate differences in dietary intake and con-sumption practices between different parts of society. In earlier periods, residue analysis using the approach we describe is essen-tial to understand the culinary role of poultry and distinguish this from other uses of chickens, such as in ritual practices or for
fighting.
5. Conclusion
In this study we show that:
d
13C values of fatty acids (d
13CFA) and collagen (d
13Ccoll) frommodern omnivorous animal bone are correlated and reflect diet
d
13CFAvalues in bone is a good proxy for adipose fat in modernomnivorous animals. However, it is reasonable to expect that different animal tissues (e.g. adipose, bone and bone marrow) were processed in the past and should also be considered.
d
13CFA(C16:0fatty acid) andd
13Ccollvalues in archaeological boneare highly correlated. The former are therefore endogenous and both reflect diet.
There is substantial variation in
d
13CFAvalues betweenarchae-ological bone and modern adipose tissues for monogastric-omnivorous animals reflecting different husbandry practices between past and present. Therefore it is highly unlikely that any global
d
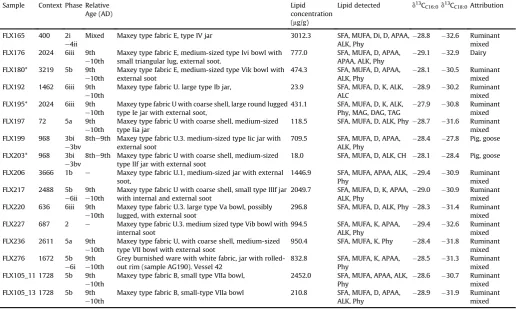
13CFA ranges can be derived for distinguishing [image:12.595.46.564.78.388.2]monogastric-omnivorous animal fats. Table 5(continued)
Sample Context Phase Relative Age (AD)
Lipid concentration (mg/g)
Lipid detected d13CC16:0d13CC18:0Attribution
FLX165 400 2i e4ii
Mixed Maxey type fabric E, type IV jar 3012.3 SFA, MUFA, Di, D, APAA, ALK, Phy
28.8 32.6 Ruminant mixed FLX176 2024 6iii 9th
e10th
Maxey type fabric E, medium-sized type Ivi bowl with small triangular lug, external soot.
777.0 SFA, MUFA, D, APAA, APAA, ALK, Phy
29.1 32.9 Dairy
FLX180* 3219 5b 9th e10th
Maxey type fabric E, medium-sized type Vik bowl with external soot
474.3 SFA, MUFA, D, APAA, ALK, Phy
28.1 30.5 Ruminant mixed FLX192 1462 6iii 9th
e10th
Maxey type fabric U. large type Ib jar, 23.9 SFA, MUFA, D, K, ALK, ALC
28.9 30.2 Ruminant mixed FLX195* 2024 6iii 9th
e10th
Maxey type fabric U with coarse shell, large round lugged type Ie jar with external soot,
431.1 SFA, MUFA, D, K, ALK, Phy, MAG, DAG, TAG
27.9 30.8 Ruminant mixed FLX197 72 5a 9th
e10th
Maxey type fabric U with coarse shell, medium-sized type Iia jar
118.5 SFA, MUFA, D, ALK, Phy 28.7 31.6 Ruminant mixed FLX199 968 3bi
e3bv
8the9th Maxey type fabric U.3. medium-sized type Iic jar with external soot
709.5 SFA, MUFA, D, APAA, ALK, Phy
28.4 27.8 Pig, goose
FLX203* 968 3bi e3bv
8the9th Maxey type fabric U with coarse shell, medium-sized type IIf jar with external soot
18.0 SFA, MUFA, D, ALK, CH 28.1 28.4 Pig, goose
FLX206 3666 1b e Maxey type fabric U.1, medium-sized jar with external soot,
1446.9 SFA, MUFA, APAA, ALK, Phy
29.4 30.9 Ruminant mixed FLX217 2488 5b
e6ii 9th e10th
Maxey type fabric U with coarse shell, small type IIIf jar with internal and external soot
2049.7 SFA, MUFA, D, K, APAA, ALK, Phy
29.0 30.9 Ruminant mixed FLX220 636 6iii 9th
e10th
Maxey type fabric U.3. large type Va bowl, possibly lugged, with external soot
296.8 SFA, MUFA, D, ALK, Phy 28.3 31.4 Ruminant mixed FLX227 687 2 e Maxey type fabric U.3. medium sized type Vib bowl with
internal soot
994.5 SFA, MUFA, K, APAA, ALK, Phy
29.4 32.6 Ruminant mixed FLX236 2611 5a 9th
e10th
Maxey type fabric U, with coarse shell, medium-sized type VII bowl with external soot
950.4 SFA, MUFA, K, Phy 28.4 31.8 Ruminant mixed FLX276 1672 5b
e6i 9th e10th
Grey burnished ware with white fabric, jar with rolled-out rim (sample AG190). Vessel 42
832.8 SFA, MUFA, K, APAA, Phy
28.5 31.3 Ruminant mixed FLX105_11 1728 5b 9th
e10th
Maxey type fabric B, small type VIIa bowl, 2452.0 SFA, MUFA, APAA, ALK, Phy
28.6 30.7 Ruminant mixed FLX105_13 1728 5b 9th
e10th
Maxey type fabric B, small-type VIIa bowl 210.8 SFA, MUFA, D, APAA, ALK, Phy
Archaeological bone
d
13CFA values from omnivorous animalstherefore complement or provide an alternative to modern reference fat for interpreting
d
13CFAvalues from archaeologicalceramics.
Fatty acids extracted from several vessels from the Anglo-Saxon site of Flixborough have similar
d
13C values as those fromchicken bones in the same deposits providing the first
compelling evidence of their processing.
Substantial mixing of different ruminant and monogastric-omnivore products needs to be resolved in order to determine the importance and nature of poultry processing in the past.
Acknowledgements
[image:13.595.55.536.64.400.2]This work was supported by the Arts and Humanities Research Council as part of the project“Cultural and Scientific Perspectives of Human-Chicken Interactions” (Grant No AH/L006979/1) and by Conselho Nacional de Desenvolvimento Científico e Tecnologico (CNPq) of Brazil. The funders had no role in study design, data collection and analysis, decision to publish, or preparation of the manuscript. The authors want to thank Deborah Jaques for providing information on the chicken remains. The authors are grateful to the comments of the two anonymous reviewers, which improved the quality of the manuscript.
Fig. 7.Partial gas chromatogram of main lipid extracts from Anglo-Saxon potsherds at Flixborough. Fatty acidd13C values are indicative of dairy (A), ruminant fat (B), possible chicken fat (C), and goose/pig fat (D). Partial HT chromatogram of a solvent extract (E). Cn:xindicates fatty acid with n carbon atoms and x double bonds. Phy. - phytanic acid, Alk -n -alkanes, K - mid-chain ketones, Ch - Cholesterol derivatives. MAGs are monoacylglycerols of carbon chain length x, DAGs are diacylglycerols and CxTAGs are triacylglycerols of carbon chain length x. IS indicates internal standard.
[image:13.595.44.275.460.676.2]