The impact of board gender composition on dividend payouts
☆
Jie Chen
⁎
, Woon Sau Leung, Marc Goergen
Cardiff Business School, Cardiff University, Cardiff CF10 3EU, United Kingdom
a r t i c l e i n f o
a b s t r a c t
Article history: Received 23 August 2016
Received in revised form 19 December 2016 Accepted 3 January 2017
Available online 5 January 2017
This paper investigates whether female independent directors are more likely to impose high dividend payouts. Wefind evidence thatfirms with a larger fraction of female directors on their board have greater dividend payouts. Thisfinding is robust to alternative econometric specifications, and alternative measures of dividend payouts and female board representation. The positive effect of board gender composition on dividends remains when we employ pro-pensity score matching, the instrumental variable approach, and difference-in-differences ap-proach to address potential endogeneity concerns. Furthermore, wefind that board gender composition significantly increases the dividend payout only forfirms with weak governance, suggesting that female directors use dividend payouts as a governance device.
© 2017 The Authors. Published by Elsevier B.V. This is an open access article under the CC BY license (http://creativecommons.org/licenses/by/4.0/).
JEL classification: G30,
G35, J16Keywords: Gender composition Board of directors Dividend payout Corporate governance
1. Introduction
Most of thefinance literature that studies gender issues focuses on the effects of female board directors onfirm value, perfor-mance (see e.g.Ahern and Dittmar, 2012; Dezso and Ross, 2012; Matsa and Miller, 2013) and risk taking (see e.g.Faccio et al., 2016). Nevertheless, there is an emerging literature which studies the impact of female directors and managers on specific cor-porate decisions. This literature tends to concur that female directors and managers have a significant impact on these decisions. For example,firms with female directors tend to focus more on corporate social responsibility (CSR) (Shaukat et al., 2016). They are also more likely to hire female top executives (Matsa and Miller, 2011) but less likely to downsize the workforce (Matsa and Miller, 2013). Further, they are less likely to make acquisition bids and tend to make acquisitions with lower bid premiums (Levi et al., 2014). Firms with female directors however spend more on research and development (R&D) (Miller and Triana, 2009). They also take out less debt and more generally make less riskyfinancing and investment choices (Faccio et al., 2016). Finally, firms with female directors also differ in terms of the incentives of insider directors as reflected by greater pay-performance sen-sitivity as well as greater CEO turnover-performance sensen-sitivity (Adams and Ferreira, 2009).
There is also evidence that female directors tend to change the boardroom dynamics. For example, female directors tend to be less conformist and they are also more vocal than their male counterparts (Carter et al., 2003; Adams and Ferreira, 2009; Adams et al., 2011). Further, the quality of boardroom discussions of complex decision problems is improved by the presence of female directors as the latter bring in different and sometimes conflicting points of view, thereby improving the information set available to the board (Miller and Triana, 2009; Gul et al., 2011). In other words, boards with female directors engage in more competitive interactions; and decision making is therefore less likely to suffer from groupthink (Chen et al., 2016; Janis, 1983). Importantly,
☆ We are grateful for helpful comments from participants at the 2016 Cardiff Empirical Finance Group Conference, the launch of the Cardiff Corporate Governance Research Group, as well as seminars at the University College Dublin, Swansea University, Surrey Business School, and Birmingham Business School.
⁎Corresponding author.
E-mail address:[email protected](J. Chen).
http://dx.doi.org/10.1016/j.jcorpfin.2017.01.001
0929-1199/© 2017 The Authors. Published by Elsevier B.V. This is an open access article under the CC BY license (http://creativecommons.org/licenses/by/4.0/). Contents lists available atScienceDirect
Journal of Corporate Finance
Adams and Ferreira (2009)find that female directors are more likely to engage in monitoring. Not only are they more likely to attend board meetings than their male counterparts,1but they are also more likely to sit on the auditing, nomination and corpo-rate governance committees, i.e., the monitoring-related board committees. Hence, there is mounting evidence that female direc-tors focus more on monitoring than their male counterparts.
In turn, dividend policy has been argued to be a corporate governance device, and more specifically a means to mitigate Jensen's (1986)free cashflow problem.Rozeff (1982)is thefirst attempt at formalizing the corporate governance role of divi-dends. He argues that dividends reduce the free cash within thefirm, thereby reducing the agency costs. However, dividends also increase transaction costs as they make thefirm more reliant on expensive, externalfinancing. Hence, there is an optimal dividend payout, which minimizes the sum of the agency costs and transaction costs. Similarly,Easterbrook (1984)argues that dividends fulfill a corporate governance role. In line withRozeff (1982), he argues that a high dividend payout reduces the free cashflow available to managers. It is then the ensuingfirm's reliance on externalfinancing, which acts as a corporate governance device. More precisely, each time thefirm returns to the capital markets to raise further funding, it subjects itself to the scrutiny of the market, includingfinancial analysts, the press and institutional investors.
Linking the emerging evidence on the greater focus of female directors on monitoring to the corporate governance role of divi-dends, we hypothesize ceteris paribus thatfirms with (more) female directors have greater dividend payouts and that high dividend payouts are used as a monitoring device. Wefind strong support for this hypothesis for a sample of 1691firms for the period of 1997– 2011, amounting to 12,050firm-year observations. Wefind a positive and statistically significant relationship between board gender composition and the level of dividend payout. Specifically, the coefficient estimate for our main variable of interest in the baseline model suggests that an increase of 10 percentage points in the fraction of female directors is associated with a 1.67 percentage point increase in thefirm's dividend payout (the average dividend payout for the sample is 22.9%). Thisfinding is robust to alternative econometric specifications, and measures of dividend payouts as well as an alternative measure of female board representation.
A methodological challenge for our study is the possibility that an omitted variable drives the effect of board gender composition on dividend payouts, thereby biasing our results. For instance, managers that are more responsive to investor demands for higher dividends may also be more responsive to calls for greater board diversity, rendering our results spurious. We use three identification strategies to address this concern and help establish causality. First, we apply propensity score matching to identify controlfirms without female directors, which are otherwise indistinguishable from our samplefirms with female directors. The results suggest that there is a significant difference in dividend payouts between the two groups. Firms with female directors have significantly higher dividend payouts than the matched control group without female directors. This confirms our baseline results.
Our second identification strategy is to employ the instrumental variable (IV) approach and to use two-stage least squares (2SLS) regression analysis. We use two instrumental variables as a source of exogenous variation in the fraction of female directors on the board. Ourfirst instrument, i.e.,Fraction of male directors linked to female directors, which is also used inAdams and Ferreira (2009) andLevi et al. (2014), is defined as the fraction of male directors on the board who sit on other boards with at least one female di-rector. The more connected afirm's male directors are to women, the more female directors should be expected on thefirm's board, suggesting a positive relation between this instrumental variable and the fraction of female directors (Adams and Ferreira, 2009).
Our second instrument isFemale-to-male participation ratio, which is constructed as the female labor force participation rate di-vided by the male labor force participation rate in a given state. The rationale behind this instrument is thatfirms in states where the female-to-male participation ratio is higher are more likely tofind good female candidates for their directorships as they are able to tap into broader talent pools. Thus, the greater the female-to-male participation ratio, the greater should be the fraction of female directors on the board. Yet little evidence, if any, suggests that afirm's dividend payouts are correlated with the female-to-male par-ticipation ratio of that state. As expected, wefind that both instruments are positively and significantly correlated with the fraction of female directors. The validity of the instruments is confirmed via the Cragg-Donald's WaldFweak-instrument test statistic. Impor-tantly, the 2SLS results confirm the positive impact of board gender composition on dividend payouts.
Finally, we employ a difference-in-differences analysis and examine the changes in the dividend payout around female director appointments (the treatment group), compared with the changes in a matched sample of male director appointments (the con-trol group). Matchedfirms are identified based on the propensity score method. Wefind thatfirms' dividend payouts are substan-tially higher for the year after a female director appointment than they are after a male director appointment. Overall, our identification tests suggest that female directors have a positive causal effect on dividend payouts.
In further analysis, we investigate whether afirm's governance affects the relationship between board gender composition and dividend payouts. We split the sample into strong and weak governancefirms according to theBebchuk et al. (2009)entrenchment index, CEO duality, CEO tenure, board independence, and product market competition. In addition, we splitfirms according to wheth-er they opwheth-erate in technology or non-technology industries. For the lattwheth-er we expect the corporate govwheth-ernance role of the board of directors to be more important whereas for the former we expect the advisory role to be more important.2We also expect insider directors of non-technologyfirms to be more entrenched than those of technologyfirms (Anderson et al., 2000; Ittner et al., 2003). Hence, the effect of female directors on the dividend payout should be greater for non-technologyfirms than for technologyfirms. The results show a positive effect of female directors on dividends and this effect is highly significant (at the 1% level) infirms with weak governance (high corporate governance needs), but insignificant infirms with strong governance (low corporate governance needs). Thesefindings provide support for our hypothesis that, compared to their male counterparts, female directors are more likely to use high dividend payouts as a monitoring device in weak governancefirms as well asfirms with high governance needs.
1Adams and Ferreira (2009)alsofind that the attendance of male directors improves infirms with female directors. 2
Ourfinal set of tests examines whetherfirms with female directors are more or less likely to initiate dividends or reinitiate dividends following their omission. To the extent that a dividend initiation/reinitiation reduces agency costs of managerial expro-priation or overinvestment (Rozeff, 1982; Easterbrook, 1984; Jensen, 1986), we expect thatfirms with more gender-diverse boards are more likely to initiate dividends as well as reinitiate dividends after an omission. Ourfindings using aCox (1972) pro-portional hazard model are consistent with this prediction.
This paper makes two major contributions. Its main contribution is to the literature on board gender diversity as we provide strong evidence of a positive effect of female directors on dividend payouts. Our paper also makes a major contribution to the relatively sparse but growing research that links gender diversity to monitoring intensity (Adams and Ferreira, 2009; Gul et al., 2011). Wefind that boards with female directors are tougher monitors than all-male boards as reflected by the use of high div-idend payouts as a monitoring device infirms with weak governance.
The remainder of the paper is organized as follows.Section 2describes the data sources, sample selection, model specification, and summary statistics.Section 3discusses the main results, robustness tests, and endogeneity issues.Section 4examines wheth-er the relationship between board gendwheth-er composition and dividend payout is affected by various govwheth-ernance mechanisms as well as a measure for governance needs.Section 5examines whetherfirms with female directors are more likely to initiate dividends and reinitiate dividends after an omission.Section 6concludes.
2. Data sources, sample selection and methodology
2.1. Data sources and sample selection
Our sample is compiled from several sources. Director-level data is obtained from RiskMetrics, which provides director profiles for S&P 1500 companies including director name, age, title, gender, the year when the director began service, and committee membership, among others. Our period of study is 1997–2011. Data on dividends and otherfirm characteristics is from Compustat. Data on CEO characteristics is sourced from ExecuComp. Financialfirms (SIC codes 6000–6999) are excluded. The final sample consists of 1691firms or 12,050firm-year observations for the period 1997–2011. All explanatory variables are lagged by one year to mitigate endogeneity concerns.
2.2. Empirical specification
To examine the impact of board gender composition on the dividend payout, we estimate the following baseline empirical model:
Dividend payouti;tþ1¼αþβFraction of female directorsi;tþγZi;tþIndustryiþYeartþεi;t ð1Þ
The dependent variable is the dividend payout ratio, defined as dividends over net income. Thefindings are robust to alternative measures of dividend payout, including dividends over total assets, dividends per share, dividends over sales, and the dividend yield, i.e. the ratio of dividends per share to thefiscal year-end stock price. The main variable of interest is the fraction of female directors on the board.Zis a vector of control variables that affect afirm's dividend payout as evidenced by the extant literature. We shall specifyZbelow.Industryirepresents industry-fixed effects based on the Fama and French 49-industry classification and
Yeartcaptures the year-fixed effects.
Zincludes controls that account for the impact offirm characteristics on the dividend payout, followingLeary and Michaely (2011)andHarford et al. (2008).Ln(TA) isfirm size as measured by the natural logarithm of deflated total assets in 2009 dollars.
Leverageis defined as the ratio of total debt (short- and long-term debt) to total assets.Tobin's q, a proxy for growth opportunities, is the ratio of book value of assets minus book value of equity plus market value of equity to the book value of assets.Cash/net assetsmeasures cash reserves and is defined as cash and marketable securities divided by net assets (total assets minus cash and marketable securities). ROA, return on assets, is a measure for profitability. It is computed as earnings before interest, taxes, depreciation, and amortization divided by total assets.Return volatility, a proxy for business conditions, is measured as the standard deviation of the return on assets over the pastfive years.PPE/TA, a proxy for asset tangibility, is the ratio of net prop-erty, plant and equipment to total assets.R&D/Sales, i.e., the ratio of R&D to sales, is used as a proxy forfinancial distress costs. To mitigate the potential effects of outliers, all the above variables are winsorized at the 1st and 99th percentiles.
Hu and Kumar (2004)show that managerial entrenchment matters for dividend payouts. Thus, we include a variety of CEO-specific and board-related variables to capture the CEO's power and the quality of corporate governance.Board sizeis the number of directors on the board.Fraction of independent directorsis measured as the number of independent directors divided by board size.CEO Chairmanis an indicator variable equal to one if the CEO is the chairman of the board, and zero otherwise.CEO tenureis defined as the number of years the CEO has been in position.E indexis the entrenchment index (E index) introduced byBebchuk et al. (2009).3In additional tests, we includeCEO ownershipas an explanatory variable.
The table inAppendix Alists all the variables used in this study as well as specifying their definitions and data sources.
3
2.3. Descriptive analysis
Table 1provides descriptive statistics on board gender composition and dividend payingfirms. In more detail, it shows the number and percentage offirm-year observations with female directors as well as the number and percentage offirm-year obser-vations with more than one female director. It also shows the number and percentage offirm-year observations with female in-dependent directors and those offirm-year observations with female insider directors. Finally, the table also reports the number and percentage offirm-year observations associated with a dividend payment.
Panel A, which reports the numbers and percentages by year, shows that about two thirds offirms have female directors and this proportion is remarkably stable over time. In contrast, the percentage offirms with more than one female director increases steadily over the period of study, from just above 24% offirms in 1997 to slightly below 35% offirms in 2011. While the percent-age offirms with female insider directors increases over time from about 5% in 1998 to 6% in 2011, it is important to highlight that the vast majority of female directors are independent directors and that the percentage offirms with female independent directors also increases over time from 62% in 1997 to 68% in 2011. This is in line withAdams and Ferreira (2009). Finally, similar to the trends reported byFama and French (2001)andBaker and Wurgler (2004)there is a steady decrease in the percentage of dividend payers until about 2008. In 1997 dividend payers made up 79% of the samplefirms whereas in 2008 this percentage had fallen to 54. In 2011, the percentage was up again with 63%.
Panel B shows the distribution of thefirm-year observations across the 11 Fama-French industries (financialfirms, forming the twelfth industry, are excluded).4There are marked differences across industries in terms of the percentage of
firm-year observa-tions with female directors. The percentage ranges from a low of 48.3% in Business Equipment to a high of 91% in Utilities. Busi-ness Equipment also has the lowest percentage offirm-year observations with more than one female director whereas Non Durables has the highest such percentage. There is also variation across industries in terms of the percentage offirm-year obser-vations with female independent directors (ranging from 45.3% for Business Equipment to 88.4% for Utilities). More interestingly, there are only two industries–Non Durables and Telecom–for which the percentage offirm-year observations with female in-sider directors exceeds 10% (i.e., 10.9% and 13.6%, respectively). Finally, the two industries with the lowest percentages offi rm-year observations with a dividend payment are Business Equipment (30.1%) and Healthcare (35.5%).
Table 2reports summary statistics for the dependent and explanatory variables used in this study. The left-hand side of the table presents a comparison offirm-year observations with female directors and those without. There are consistently significant differ-ences (all at the 1% level) between the two groups. In a nutshell,firm-year observations with female directors are associated with significantly higher dividend payouts. This is the case for allfive measures of dividend payout, i.e., dividends over total assets, the dividend yield, the dividends per share, dividends over net income, and dividends over sales. Firms with female directors tend to be more maturefirms as reflected by greater leverage, lower R&D over sales, lower return volatility and greater total assets value. In contrast, the picture is somewhat mixed when it comes to the corporate governance characteristics. Whilefirms with fe-male directors tend to have a greater fraction of independent directors (74% versus 66%), they are also more likely to have duality of the CEO and chairman (66% versus 54%) and a higher entrenchment index (2.690 versus 2.339). Firms with female directors also tend to have larger boards, with on average 10 members compared to roughly 8 forfirms without female directors. Converse-ly, they tend to have smaller cash reserves (as measured by cash over total assets).
A distinction is also made between dividend payers and non-payers on the right-hand side of the table. Overall,firms with dividend payments displayfirm and governance characteristics similar to those with female directors. For instance, analogous tofirms with female directors,firms that pay dividends also tend to be more maturefirms, and have higher leverage, lower R&D expenditures, less growth op-portunities, lower return volatility, and greater tangible and total assets. In terms of the governance variables, dividend-payingfirms have a greater fraction of independent directors, a higher entrenchment index, a larger board, and a higher incidence of CEO duality, but lower cash reserves relative to non-dividend-payingfirms. Importantly, dividend payers have a greater fraction of female directors (12% versus 7.6%), especially female independent directors (10.9% versus 6.7%). The difference in the fraction of male independent directors (i.e., the number of male independent directors divided by the total number of independent directors on the board), however, is insignificant.
3. Board gender composition and dividend payout
3.1. Gender and dividend payout
Table 3contains the results for the regressions explaining the dividend payout, as measured by dividends over net income. The six re-gressions not only vary in terms of how the fraction of female directors is measured, but also in terms of the control variables that are in-cluded. We start the analysis by regressing the dividend payout on the fraction of female directors, as well as industry and year dummies (regression (1)). In addition to the former variables, regressions (2) to (6) include various control variables. Regression (2) includes the firm characteristics as control variables. In addition to these, regression (3) includes the corporate governance variables (board size, the fraction of independent directors, the CEO Chairman indicator variable, CEO tenure, and the E index). Regression (6) also includes CEO ownership. Regressions (4) and (5) include the same control variables as regression (3), but use different measures for female represen-tation on the board of directors. More specifically, regression (4) uses the weighted fraction of female directors with the weights being the tenure of each female director relative to the total board tenure, whereas regression (5) distinguishes between the fraction of female
4
independent directors and the fraction of female insider directors. Regression (5) also includes the fraction of male independent directors as an additional control variable.
In all the above specifications, the coefficient onFraction of female directorsis positive and statistically significant at the 5% level or better. In terms of economic significance, the coefficient in regression (3) suggests that an increase of 10 percentage points in the frac-tion of female directors is associated with a 1.67 percentage-point increase in thefirm's dividend payout. Importantly as regression (5) suggests, the effect of female directors on the dividend payout is driven primarily by female independent directors, as opposed to in-sider directors, and female independent directors have a greater impact on the dividend payout than do male independent directors.5 As stated above, regression (4) uses the tenure weighted measure, which allows for the possibility that directors with longer tenure (whether male or female) have a greater impact on dividend policy than directors with shorter tenure (Schwartz-Ziv and Weisbach, 2013). It could also be the case that the longer-tenured male directors appoint the female directors, which would likely reduce the impact of the latter on the dividend payout. Nevertheless, the tenure weighted measure confirms our previous results: a greater fraction of female directors results in a higher dividend payout and this positive effect is due to female independent di-rectors rather than female insider didi-rectors (see regression (5)).6
Overall, there is strong and consistent evidence across all six regressions that the dividend payout increases with the fraction of female directors, independent of how the latter is measured. These results provide support for our main hypothesis that female directors are more likely to use high dividend payouts as a monitoring device than their male counterparts.
5
The difference between the two coefficients is significant at the 5% level.
6In an untabulated regression, we include the tenure weighted fractions of female independent directors and female insider directors but exclude the fraction of male independent directors. The results are virtually identical to those of regression (5). Again, the fraction of female independent directors is significant at the 5% level, whereas the fraction of female insider directors is not significant.
Table 1
Sample details by year and industry.
Ourfinal sample consists of an unbalanced panel of 12,050firm-year observations for 1691 non-financialfirms, which are in the intersection of the RiskMetrics, Compustat, and ExecuComp databases. This table describes the distribution of female directors and dividend policy across years (Panel A) and industries (Panel B). Panel A shows the number and proportion offirms which have at least one female director, more than one female director, at least one female independent director, at least one female insider director, and paying dividends in each year. Panel B describes the same information as Panel A but across the Fama-French 12 industries (financialfirms being excluded).
Panel A: By year
Year
No. of obs.
No. of
firm-year obs. with female
directors %
No. offirm-year obs. with more than
one female
directors %
No. offirm-year obs. with female independent
directors %
No. offirm-year obs. with female insider directors %
No. of
firm-year obs. with
dividends %
1997 541 372 68.8% 132 24.4% 334 61.7% 25 4.6% 426 78.7%
1998 761 413 54.3% 132 17.3% 375 49.3% 23 3.0% 476 62.5%
1999 713 441 61.9% 162 22.7% 401 56.2% 28 3.9% 445 62.4%
2000 751 469 62.5% 167 22.2% 423 56.3% 35 4.7% 442 58.9%
2001 701 452 64.5% 164 23.4% 417 59.5% 35 5.0% 420 59.9%
2002 815 508 62.3% 187 22.9% 465 57.1% 46 5.6% 438 53.7%
2003 799 518 64.8% 197 24.7% 491 61.5% 39 4.9% 482 60.3%
2004 832 552 66.3% 216 26.0% 525 63.1% 36 4.3% 492 59.1%
2005 793 562 70.9% 232 29.3% 534 67.3% 36 4.5% 486 61.3%
2006 682 464 68.0% 205 30.1% 438 64.2% 29 4.3% 410 60.1%
2007 835 562 67.3% 235 28.1% 537 64.3% 44 5.3% 475 56.9%
2008 937 646 68.9% 298 31.8% 622 66.4% 53 5.7% 502 53.6%
2009 948 651 68.7% 305 32.2% 621 65.5% 53 5.6% 533 56.2%
2010 939 650 69.2% 315 33.5% 624 66.5% 60 6.4% 550 58.6%
2011 1003 709 70.7% 349 34.8% 682 68.0% 59 5.9% 627 62.5%
Total 12,050 7969 66.1% 3296 27.4% 7489 62.1% 601 5.0% 7204 59.8%
Panel B: By Fama-French 12-industry
Industry
No. of obs.
No. of
firm-year obs. with female
directors %
No. offirm-year obs. with more than
one female
directors %
No. offirm-year obs. with female independent
directors %
No. offirm-year obs. with female insider directors %
No. of
firm-year obs. with
dividends %
Non Durables 877 702 80.0% 452 51.5% 660 75.3% 96 10.9% 676 77.1%
Durables 351 225 64.1% 66 18.8% 212 60.4% 6 1.7% 258 73.5%
Manufacturing 1912 1164 60.9% 345 18.0% 1099 57.5% 59 3.1% 1423 74.4%
Energy 654 347 53.1% 102 15.6% 324 49.5% 7 1.1% 436 66.7%
Chemicals 529 431 81.5% 212 40.1% 417 78.8% 24 4.5% 466 88.1%
Business Eq. 2323 1123 48.3% 316 13.6% 1052 45.3% 72 3.1% 700 30.1%
Telecom 191 153 80.1% 93 48.7% 140 73.3% 26 13.6% 133 69.6%
Utilities 992 903 91.0% 490 49.4% 877 88.4% 25 2.5% 941 94.9%
Shops 1615 1193 73.9% 579 35.9% 1124 69.6% 159 9.8% 934 57.8%
Healthcare 1072 730 68.1% 270 25.2% 667 62.2% 64 6.0% 381 35.5%
Other 1534 998 65.1% 371 24.2% 917 59.8% 63 4.1% 856 55.8%
Moving onto the control variables, wefind support forRozeff (1982)andEasterbrook (1984)that dividends are used to dis-gorge free cash to shareholders in the absence of other such devices. Indeed,Cash/net assetshas a positive and significant effect on the dividend payout in four of thefive regressions that include this control variable. In contrast, leverage has a significantly neg-ative effect on the dividend payout. Given that both debt and high dividend payouts are ways to mitigateJensen's (1986)free cashflow problem, the negative sign onLeveragemakes perfect sense (see alsoBenito and Young, 2003). The positive sign on
ROAand the negative sign onReturn volatilityare also in line with the existing literature (Jagannathan et al., 2000).
Importantly, the corporate governance variables are all significant.Board sizehas a positive effect on the dividend payout.7In line withHu and Kumar (2004), wefind a positive effect of board independence on the dividend payout.8Again, this is in line with dividends being a monitoring device. We alsofind that duality increases the dividend payout. This is in contrast toHu and Kumar (2004)who do notfind any effect of duality on the dividend payout.CEO tenurehas been argued to increase CEO power (see e.g.Finkelstein and Hambrick, 1989) and should therefore decrease the dividend payout. All four regressions, which includeCEO tenure(i.e., regressions (3) to (6)), suggest that this is the case. Conversely,Hu and Kumar (2004)do not find that CEO tenure affects the payout.9Similar to CEO tenure, the entrenchment index also decreases the dividend payout.
3.2. Robustness tests
The robustness test results shown inAppendix Cconfirm that the positive effect of the fraction of female directors on the div-idend payout persists when (i) a different measure is used for the divdiv-idend payout (i.e., divdiv-idends over total assets, divdiv-idend yield, dividends per share, and dividends over total sales); (ii) a different estimation technique is used (i.e., Tobit regressions, and Fama-MacBeth regressions); (iii)firm-year observations for Telecom, and Utilities are excluded; (iv) observations with female CEOs are
7
The correlation between board size andfirm size (total assets) is high with a value of 0.45 (see the correlation matrix reported inAppendix B). When we include just one of the two size variables at a time in thefirst four regressions fromTable 3(not tabulated), each of the two variables is positive and significant at the 1% level in all four regressions. In addition, we regress board size onfirm size and then include the residuals from this regression as well asfirm size in thefirst four regressions from Table 3(the results are not tabulated). Wefind that both board size andfirm size are now positive and significant at the 1% level across all four regressions. Since this strong correlation also concerns the robustness of our results, we revisit this issue in the robustness tests inSection 3.2.
8More precisely,Hu and Kumar (2004)find that board independence increases the dividend payout only if it exceeds 40%.
9Nevertheless,Hu and Kumar (2004)find that the CEO's length of service with thefirm (which also includes the years spent with thefirm before being appointed as the CEO) has a significant and positive effect on the dividend payout.
Table 2
Summary statistics.
This table reports the means and standard deviations of the variables used in this study for the entire sample and for the subsamples offirms with and without female directors as well as the subsamples offirms with and without dividends. For each variable, the differences between the two subsamples are reported along witht -sta-tistics based on the two-samplet-test.Appendix Acontains a detailed definition of all the variables.
Variable
Whole sample Firm-year obs. with female
directors
Firm-year obs. without female directors
Firm-year obs. with dividends
Firm-year obs. with no dividend
N= 12.050 N= 7969 N= 4081 N= 7214 N= 4837
Mean S.d. Mean S.d. Mean S.d. Diff t-stat Mean S.d. Mean S.d. Diff t-stat
Dividend/TA 0.014 0.021 0.016 0.021 0.008 0.019 0.008⁎⁎⁎ 19.7 0.023 0.022 0.000 0.000 0.023⁎⁎⁎ 70.011
DPS/Share price 0.014 0.019 0.017 0.019 0.007 0.015 0.010⁎⁎⁎ 28.2 0.023 0.019 0.000 0.000 0.023⁎⁎⁎ 83.975
Dividend per share (DPS) 0.450 0.598 0.582 0.642 0.194 0.387 0.388⁎⁎⁎ 35.5 0.752 0.608 0.000 0.000 0.752⁎⁎⁎ 85.999
Dividend/NI 0.229 0.459 0.280 0.486 0.128 0.384 0.152⁎⁎⁎ 17.4 0.382 0.542 0.000 0.000 0.382⁎⁎⁎ 49.021
Dividend/Sales 0.016 0.024 0.020 0.026 0.009 0.020 0.011⁎⁎⁎ 23.5 0.027 0.026 0.000 0.000 0.027⁎⁎⁎ 71.476
Fraction of female dirs 0.103 0.093 0.155 0.069 0.000 0.000 0.155⁎⁎⁎ 140.0 0.120 0.090 0.076 0.090 0.044⁎⁎⁎ 26.090 Fraction of female indep. dirs. 0.092 0.087 0.139 0.070 0.000 0.000 0.139⁎⁎⁎ 130.0 0.109 0.085 0.067 0.083 0.042⁎⁎⁎ 26.980 Fraction of female insider dirs. 0.006 0.027 0.009 0.033 0.000 0.000 0.009⁎⁎⁎ 17.2 0.005 0.026 0.006 0.029 −0.001⁎ −1.838 Fraction of male indep. dirs. 0.620 0.152 0.600 0.138 0.659 0.171 −0.059⁎⁎⁎ −20.6 0.619 0.146 0.621 0.161 −0.002 −0.635
Leverage 0.219 0.165 0.239 0.157 0.180 0.172 0.060⁎⁎⁎ 19.1 0.241 0.150 0.187 0.180 0.054⁎⁎⁎ 17.861
R&D/Sales 0.048 0.227 0.036 0.138 0.073 0.337 −0.038⁎⁎⁎ −8.7 0.019 0.041 0.092 0.350 −0.073⁎⁎⁎ −17.522
Tobin's q 1.942 1.314 1.903 1.307 2.016 1.325 −0.113⁎⁎⁎ −4.5 1.819 1.116 2.124 1.546 −0.304⁎⁎⁎ −12.544
ROA 0.146 0.089 0.150 0.081 0.138 0.102 0.012⁎⁎⁎ 6.9 0.156 0.074 0.131 0.105 0.024⁎⁎⁎ 14.926
Return volatility 0.041 0.039 0.035 0.033 0.053 0.047 −0.017⁎⁎⁎ −23.7 0.030 0.028 0.050 0.045 −0.020⁎⁎⁎ −29.524
Cash/net assets 0.234 0.504 0.183 0.418 0.334 0.627 −0.151⁎⁎⁎ −15.8 0.137 0.279 0.379 0.694 −0.242⁎⁎⁎ −26.590
PPE/TA 0.312 0.234 0.328 0.232 0.281 0.235 0.047⁎⁎⁎ 10.4 0.354 0.231 0.250 0.224 0.104⁎⁎⁎ 24.425
TA ($m) 5727 10,643 7730 12,340 1816 3738 5914⁎⁎⁎ 29.9 8011 12,675 2319 4818 5691⁎⁎⁎ 29.818
Ln (TA) 7.520 1.488 7.935 1.465 6.710 1.164 1.225⁎⁎⁎ 46.4 7.939 1.503 6.894 1.223 1.045⁎⁎⁎ 40.251
Board size 9.282 2.377 10.070 2.244 7.743 1.807 2.328⁎⁎⁎ 57.4 10.018 2.334 8.184 1.983 1.835⁎⁎⁎ 44.877
Fraction of independent dirs 0.712 0.159 0.739 0.146 0.659 0.171 0.080⁎⁎⁎ 26.8 0.728 0.155 0.687 0.162 0.040⁎⁎⁎ 13.783
CEO Chairman 0.617 0.486 0.655 0.475 0.541 0.498 0.115⁎⁎⁎ 12.3 0.680 0.467 0.522 0.500 0.158⁎⁎⁎ 17.677
CEO tenure 8.120 7.359 7.260 6.345 9.801 8.777 −2.541⁎⁎⁎ −18.2 7.685 7.018 8.770 7.795 −1.086⁎⁎⁎ −7.959
E index 2.571 1.295 2.690 1.281 2.339 1.292 0.351⁎⁎⁎ 14.2 2.648 1.307 2.457 1.269 0.191⁎⁎⁎ 7.965⁎⁎
excluded as the monitoring hypothesis is unlikely to apply to female insider directors; (v) observations with female chair-CEOs are excluded; (vi) the square of the fraction of female directors is also included, thereby allowing for a non-linear relationship between the dividend payout and female board representation10; (vii) controlling for CEO pay-performance sensitivity; (viii)
10 Note that the square of the fraction of female directors is only significant, and negative, when the dependent variable is the dividend yield. This regression suggests that the dividend yield increases with the fraction of female directors until the latter reaches 0.27, and then decreases.
Table 3
Board gender composition and dividend payouts.
This table reports the results of the OLS regressions for the relationship between board gender composition and dividend payouts. The dependent variable is dividends over net income. Independent variables include the following.Fraction of female dirs(Fraction of female dirs_tw) is the equally-weighted (tenure-weighted) measure of the fraction of female directors on the board.Fraction of female indep. dirs(Fraction of female insider dirs) is the fraction of independent (insider) directors on the board, computed as the number of female independent (inside) directors divided by the total number of independent (insider) directors on the board.Fraction of male indep. dirsis the number of male independent directors divided by the total number of independent directors on the board.Leverageis the sum of short- and long-term debts to total assets.R&D/Salesis the R&D expenditures divided by total net sales.Tobin's qis the market value of equity plus total assets minus the book value of equity, all di-vided by total assets.ROAis earnings before interest, taxes, depreciation, and amortization divided by total assets.Return volatilityis the volatility of ROA over the past
five years.Cash/net assetsis cash and marketable securities divided by net assets.PPE/TAis net property, plant and equipment divided by total assets.Ln(TA) is the nat-ural logarithm of the deflated total assets in 2009 dollars.Board sizeis the total number of directors on the board.Fraction of independent directorsis the number of in-dependent directors divided by the board size.CEO Chairmanis an indicator variable equal to one if the CEO is also the chairman of the board, and zero otherwise.CEO tenureis the number of years the CEO has been in position.E indexis the entrenchment index ofBebchuk et al. (2009).CEO ownershipis the percentage stock ownership of the CEO. Industry- and year-fixed effects are included in all the regressions. Industry effects are constructed based on the Fama-French 49-industry classification. Sta-tistical significance is based on heteroskedasticity robustfirm-clustered standard errors reported in parentheses.
Variable
OLS regressions Dependent variable: Dividend/NI
(1) (2) (3) (4) (5) (6)
Intercept 0.351⁎
(0.182) 0.196 (0.187) 0.149 (0.179) 0.164 (0.179) 0.147 (0.179) 0.139 (0.196) Fraction of female dirst−1 0.404⁎⁎⁎
(0.069)
0.277⁎⁎⁎ (0.071)
0.167⁎⁎ (0.069)
– – 0.166⁎⁎
(0.070)
Fraction of female dirs_twt−1 – – – 0.172⁎⁎
(0.067)
– –
Fraction of female indep. dirst−1 – – – – 0.253⁎⁎⁎
(0.080)
–
Fraction of female insider dirst−1 – – – – 0.221
(0.235)
–
Fraction of male indep. dirst−1 – – – – 0.108⁎⁎⁎
(0.038)
–
Leveraget−1 – −0.096⁎⁎
(0.044)
−0.090⁎⁎ (0.043)
−0.092⁎⁎ (0.042)
−0.090⁎⁎ (0.043)
−0.083⁎ (0.043)
R&D/Salest−1 – −0.008
(0.028) −0.015 (0.027) −0.016 (0.027) −0.015 (0.027) −0.015 (0.027)
Tobin's qt−1 – −0.003
(0.004) −0.002 (0.004) −0.002 (0.004) −0.002 (0.004) −0.001 (0.004)
ROAt−1 – 0.135⁎⁎
(0.064) 0.126⁎⁎ (0.063) 0.125⁎⁎ (0.063) 0.126⁎⁎ (0.063) 0.113⁎ (0.064)
Return volatilityt−1 – −0.693⁎⁎⁎
(0.137)
−0.680⁎⁎⁎ (0.133)
−0.678⁎⁎⁎ (0.133)
−0.684⁎⁎⁎ (0.133)
−0.685⁎⁎⁎ (0.135)
Cash/net assetst−1 – 0.023
(0.014) 0.029⁎ (0.015) 0.028⁎ (0.015) 0.029⁎ (0.015) 0.029⁎ (0.015)
PPE/TAt−1 – 0.061
(0.048) 0.066 (0.046) 0.067 (0.046) 0.067 (0.047) 0.057 (0.047)
Ln (TA)t−1 – 0.024⁎⁎⁎
(0.006) 0.005 (0.006) 0.005 (0.006) 0.005 (0.006) 0.005 (0.006)
Board sizet−1 – – 0.019⁎⁎⁎
(0.003) 0.019⁎⁎⁎ (0.003) 0.019⁎⁎⁎ (0.003) 0.019⁎⁎⁎ (0.003)
Fraction of independent directorst−1 – – 0.109⁎⁎⁎
(0.038)
0.107⁎⁎⁎ (0.037)
– 0.118⁎⁎⁎
(0.039)
CEO Chairmant−1 – – 0.027⁎⁎
(0.011) 0.026⁎⁎ (0.011) 0.027⁎⁎ (0.012) 0.024⁎⁎ (0.012)
CEO tenuret−1 – – −0.002⁎⁎
(0.001)
−0.002⁎⁎ (0.001)
−0.002⁎⁎ (0.001)
−0.002⁎⁎⁎ (0.001)
E indext−1 – – −0.011⁎⁎
(0.005)
−0.011⁎⁎ (0.005)
−0.010⁎⁎ (0.005)
−0.011⁎⁎ (0.005)
CEO ownershipt−1 – – – – – 0.206⁎
(0.115)
Industry effects Yes Yes Yes Yes Yes Yes
Year effects Yes Yes Yes Yes Yes Yes
N 12,050 12,050 12,050 12,050 12,050 11,739
Adjusted R2
0.115 0.124 0.132 0.132 0.132 0.131
controlling for other director characteristics, including average director age and tenure as well as director age and tenure diver-sity11; (ix) the board size andfirm size variables are included one at a time; and (x) regressing board size onfirm size and then including the residuals from this regression as well asfirm size in the baseline dividend payout regressions.12
3.3. Identification
The challenge we face when attempting to identify a causal effect of female board representation on the dividend payout is the possibility of omitted variable bias. For example, managers that are more responsive to investor demands for higher dividends may also be more responsive to calls for greater board diversity. This would suggest that the fraction of female directors is endogenous. This section addresses these endogeneity concerns in the following three different ways. First, we conduct propensity score matching wherebyfirm-years with female directors are matched withfirm-years without female directors, but with no significant differences in terms of all the other variables. Second, we employ an instrumental variable approach to adjust for the possible endogeneity of the fraction of female directors. Third, we also perform a difference-in-differences analysis that compares the chang-es in dividend payout around female director appointments to the changchang-es in a matched sample of male director appointments.
3.3.1. Propensity score matching estimates
Table 4compares the dividend payout (using various measures) and the dividend yield forfirms with female directors with those forfirms without female directors that have been matched via propensity score matching with the former. Wefirst estimate the probability that afirm hires female directors. This probability (i.e., the propensity score) is the predicted value from a logit regression using the same controls as those included in regression (3) ofTable 3. The logit regression results are reported in col-umn (1) of Panel A ofTable 4. Consistent withAdams and Ferreira (2009), wefind thatfirms with female directors are larger and have better performance as measured by ROA. The pseudo R-square for the regression is high with a value of 0.301.
Next, we adopt the nearest neighbor approach to ensure thatfirms with female directors (i.e., the treatment group) are suf-ficiently similar to the matchedfirms without female directors (i.e., the control group). Specifically, eachfirm with female direc-tors on its board is matched to afirm without female directors and with the closest propensity score. If afirm in the control group is matched to more than onefirm in the treatment group, we retain only the pair for which the difference between the propensity scores of the twofirms is the smallest.13We further require that the maximum difference between the propensity score of each firm with female directors and that of its matched peer does not exceed 0.1% in absolute value.14
To verify thatfirms in the treatment and control groups are indistinguishable in terms of observable characteristics, we conduct two diagnostic tests. Thefirst test consists of re-estimating the logit model for the post-match sample. The results are shown in column (2) of Panel A ofTable 4. None of the coefficient estimates is statistically significant, suggesting that there are no distinguishable trends in div-idend payouts between the two groups. Furthermore, the coefficients in column (2) are much smaller in magnitude than those in column (1), suggesting that the results in column (2) are not simply an artifact of a decline in degrees of freedom in the restricted sample. Finally, the pseudo R-square drops substantially from 0.301 for the pre-match sample to 0.003 for the post-match sample. This suggests that the propensity score matching removes all observable differences other than the difference in the presence of female directors.
The second test consists of examining the difference for each observable characteristic between the treatmentfirms and the matched controlfirms. The results are reported in Panel B ofTable 4. Again, none of the differences in observable characteristics between the treatment and controlfirms is statistically significant. Overall, the diagnostic test results suggest that the propensity score matching removes all observable differences other than the difference in the presence of female directors. Thus, this increases the likelihood that any difference in dividend payouts between the two groups is due to the presence of female directors on boards. Finally, Panel C ofTable 4reports the propensity score matching estimates.15The results indicate that there are significant dif-ferences (all at the 1% level) in dividend payouts–for allfive measures–betweenfirms with female directors and those without. In detail,firms with female directors have greater dividends per share, dividends over total assets, dividends over net income, div-idends over total sales, and greater dividend yields than the otherwise indistinguishablefirms without female directors.
3.3.2. Instrumental variable approach
To address the endogeneity concern, we employ the instrumental variable approach to extract the exogenous component from board gender composition and then use it to explain the dividend payout. We use separately as well as jointly two different in-strumental variables that capture afirm's likelihood of having female directors, but are uncorrelated with the dividend payout, except through the variables we control for. Ourfirst instrument is the fraction of afirm's male directors who sit on other boards with at least one female director. This instrument is also used byAdams and Ferreira (2009)andLevi et al. (2014). The more con-nected afirm's male directors are to women, the more female directors should be expected on thefirm's board (Adams and Ferreira, 2009). Thus, we expect this instrumental variable to be positively correlated with the fraction of female directors.
11
Director age (tenure) diversity is calculated as the standard deviation of director age (tenure) divided by the average age (tenure) of all the directors on the board. 12
See footnote 7 about the rationale behind (ix) and (x). 13
As a robustness test we allow for controlfirms to be matched to multiple treatmentfirms. The results do not change qualitatively.
Table 4
Propensity score matching estimator.
This table reports the propensity score matching estimation results. Panel A reports the parameter estimates from the logit model used to estimate the propensity scores. The dependent variable is an indicator variable set to one if there are female directors in thefirm in a given year, and zero otherwise. Independent variables in-clude the following.Leverageis the sum of short- and long-term debts to total assets.R&D/Salesis the R&D expenditures divided by total net sales.Tobin's qis the market value of equity plus total assets minus the book value of equity, all divided by total assets.ROAis earnings before interest, taxes, depreciation, and amortization divided by total assets.Return volatilitiesis the volatility of ROA over the pastfive years.Cash/net assetsis cash and marketable securities divided by net assets.PPE/TAis net prop-erty, plant and equipment divided by total assets.Ln (TA)is the natural logarithm of the deflated total assets in 2009 dollars.Board sizeis the total number of directors on the board.Fraction of independent directorsis the number of independent directors divided by the board size.CEO Chairmanis an indicator variable equal to one if the CEO is also the chairman of the board, and zero otherwise.CEO tenureis the number of years the CEO has been in position.E indexis the entrenchment index ofBebchuk et al. (2009)and it is constructed based on six provisions. Industry and yearfixed effects are included in all regressions. Industry effects are constructed based on the Fama-French 49-industry classification. Statistical significance is based on the heteroskedasticity robustfirm-clustered standard errors reported in parentheses. Panel A reports the pre-match propensity score regression and the post-match diagnostic regression. Panel B reports the univariate comparisons offirm characteristics between
firms with and without female directors and the correspondingt-statistics. Panel C reports estimates of the average treatment effects. The dependent variables include dividends per share, dividends to total assets, dividend yield, the dividend payout ratio and dividends to total sales.
Panel A: Pre-match propensity score regression and post-match diagnostic regression
Dependent variable:
Equals 1 if female directors are on the board and 0 otherwise
Pre-match Post-match
(1) (2)
Intercept −7.743⁎⁎⁎
(1.276)
0.341 (1.200)
Leveraget−1 −0.285
(0.351)
0.042 (0.361)
R&D/Salest−1 −0.134
(0.285)
0.006 (0.330)
Tobin's qt−1 0.038
(0.038)
−0.008 (0.045)
ROAt−1 1.237⁎⁎
(0.597)
−0.225 (0.619)
Return volatilityt−1 −2.379⁎
(1.327)
0.010 (1.315)
Cash/net assetst−1 0.104
(0.083)
−0.005 (0.085)
PPE/TAt−1 0.203
(0.393)
0.038 (0.429)
Ln (TA)t−1 0.399⁎⁎⁎
(0.052)
−0.024 (0.058)
Board sizet−1 0.428⁎⁎⁎
(0.032)
0.012 (0.032)
Fraction of independent directorst−1 2.314⁎⁎⁎
(0.340)
−0.115 (0.354)
CEO Chairmant−1 0.250⁎⁎
(0.099)
−0.058 (0.108)
CEO tenuret−1 −0.031⁎⁎⁎
(0.007)
0.002 (0.007)
E indext−1 0.082⁎
(0.044)
0.002 (0.048)
Industry effects Yes Yes
Year effects Yes Yes
N 12,017 4836
Pseudo R2
0.301 0.003
Panel B: Differences infirm characteristics
Firm-year obs. with female dirs. (N= 2418)
Firm-year obs. without female dirs.
(N= 2418) Difference t-stat
Leveraget−1 0.195 0.196 0.000 −0.039
R&D/Salest−1 0.055 0.054 0.001 0.275
Tobin's qt−1 1.930 1.955 −0.024 −0.672
ROAt−1 0.142 0.144 −0.002 −0.938
Return volatilityt−1 0.043 0.043 0.000 −0.066
Cash/net assetst−1 0.287 0.286 0.001 0.063
PPE/TAt−1 0.282 0.286 −0.004 −0.655
Ln (TA)t−1 6.938 6.948 −0.010 −0.302
Board sizet−1 8.388 8.343 0.045 0.869
Fraction of independent directorst−1 0.688 0.690 −0.002 −0.391
CEO Chairmant−1 0.551 0.564 −0.013 −0.926
CEO tenuret−1 8.866 8.868 −0.002 −0.011
Our second instrument is the female-to-male participation ratio, which is computed as the female participation ratio divided by the male participation ratio for the state where thefirm is headquartered. The female (male) participation ratio is measured as the percentage of the civilian non-institutional population of the female (male) group in the civilian labor force. The data comes from the US Census Bureau website and is updated annually. The rationale for using this instrument is thatfirms in states where the female-to-male participation ratio is higher are more likely tofind good female candidates for their board of directors, ceteris paribus, as they are able to tap into larger talent pools. Thus, we argue that the greater the female-to-male participation ratio, the greater should be the fraction of female directors on the board. Yet little evidence, if any, suggests that afirm's dividend policy is correlated with the female-to-male participation ratio of that state.
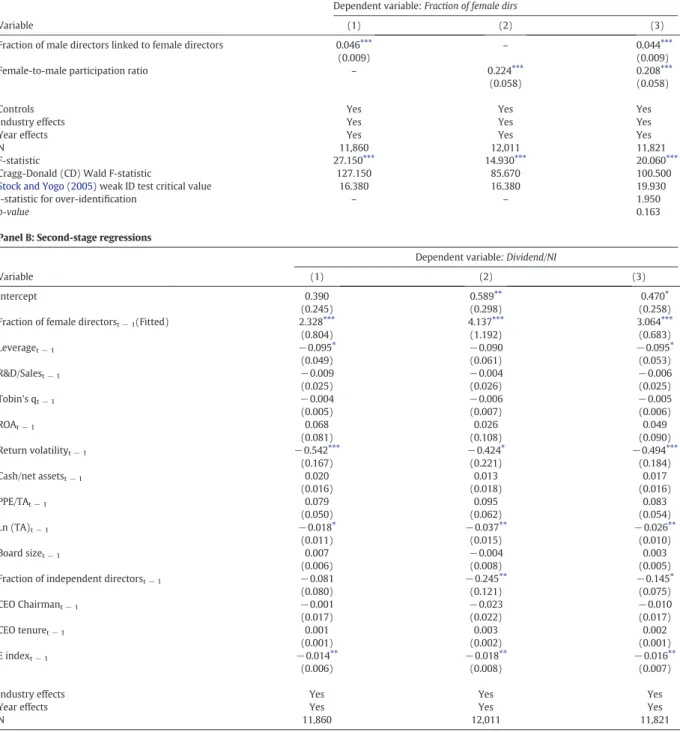
Panel A ofTable 5reports the results of thefirst-stage regressions where the dependent variable is the fraction of female di-rectors. The explanatory variables include the above mentioned instruments and the same control variables as in regression (3) of Table 3. For brevity, we report only the coefficient estimates for the main variables of interest. Regression (1) uses the fraction of male directors linked to female directors as an instrument, regression (2) uses the female-to-male participation ratio, and regres-sion (3) uses both instruments. Consistent with the rationale behind the instruments, the fraction of female directors is positively correlated to the fraction of male directors linked to female directors as well as to the female-to-male participation ratio. The co-efficient estimates for the instruments in regressions (1) and (2) are statistically significant at the 1% level suggesting that our instruments are valid. In regression (3), the coefficients on the two instruments remain positive and statistically significant at the 1% level. The reportedF-statisticsare very high for all three regressions suggesting that none of our instruments is weak. Fur-thermore, thep-valueof the Cragg-Donald's WaldFweak-instrument test statistic is 0.000 for all three regressions, again rejecting the null hypothesis that the instruments are weak (Cragg and Donald, 1993; Stock and Yogo, 2005).16The last test we conduct on the validity of our instruments is theHansen (1982)Jover-identification test in regression (3), which uses both instruments. The
p-valueindicates that the instruments are valid, i.e. uncorrelated with the error term.
Panel B ofTable 5reports the results for the second-stage regressions whose dependent variable is dividends over net income. The variable of interest is the variable with the predicted values of the fraction of female directors from thefirst-stage regressions. All three regressions confirm the significant (at the 1% level) and positive effect of the fraction of female directors on the dividend payout. This is consistent with our main hypothesis and suggests that our key result is not due to the endogeneity of the fraction of female directors. There is some concern that ourfirst instrument, the fraction of male directors linked to female directors, is a proxy for the connectedness of the board, which could be correlated withfirm performance, and in turn dividend payouts. To address this con-cern, we followAdams and Ferreira (2009)and use two more direct measures of board connectedness as additional controls: the total number of external board seats held by the directors and the total number of external board seats held by the male directors. The results are presented inAppendix D. The inclusion of these two more direct measures confirms our existing results.
Moreover, the fraction of male directors connected to female directors on other boards might be correlated withfirm dividend policy through industry effects. We address this possibility in the following three ways. First, we exclude observations with direc-tors sitting on the boards of their industry peerfirms from the sample for the IV analysis (not tabulated). The results continue to hold. Second, we control for the following two variables (one at a time) that measure board connectedness in the same industry: the fraction of directors who sit on other boards in the same industry and the fraction of male directors who sit on other boards with a female presence in the same industry. The results are qualitatively similar to those reported when these variables are in-cluded. Finally, we consider a variation of thefirst instrument. This alternative instrument is defined as the fraction of afirm's male directors who (i) sit on boards with a female presence in other industries, and (ii) do not sit on other boards with a female presence in the same industry. We confirm that our results are not sensitive to this alternative definition of the instrument.
3.3.3. Difference-in-differences matching estimates
Our third identification strategy is to employ a difference-in-differences (DID) analysis around female director appointments to identify the effect of female board representation on the dividend payout. The DID approach compares the outcomes for two sim-ilar groups with and without the treatment but that would otherwise be subject to simsim-ilar influence from the trending variables. Therefore, it increases the likelihood that any difference in the changes in outcomes before and after the treatment between the two groups is due to the impact of the treatment rather than the difference between the two groups prior to treatment.
16Panel A ofTable 5also shows theStock and Yogo (2005)weak ID test critical values, which are for the Cragg-Donald Wald F-statistics. In all regressions, the
F-sta-tisticsare much larger than theirStock and Yogo (2005)critical values based on 2SLS size. Therefore, we reject the null hypothesis that the instruments are weak.
Panel C: Propensity score matching estimator
Variable
Firm-year obs. with female dirs. (N= 2418)
Firm-year obs. without female dirs.
(N= 2418) Difference t-stat
Dividend per share (DPS) 0.309 0.228 0.081⁎⁎⁎ 6.390
Dividend/TA 0.011 0.009 0.002⁎⁎⁎ 3.720
DPS/Share price 0.185 0.141 0.044⁎⁎⁎ 3.520
Dividend/NI 0.011 0.008 0.003⁎⁎⁎ 5.520
Dividend/Sales 0.012 0.010 0.002⁎⁎⁎ 3.320
⁎ Denotes statistical significance at the 10% level. ⁎⁎ Denotes statistical significance at the 5% level. ⁎⁎⁎ Denotes statistical significance at the 1% level.
Table 5
IV estimator.
This table presents estimates using the instrumental variables method based on two-stage least square (2SLS) panel regressions. Panel A presents thefirst-stage regres-sion results where the dependent variable is the equally-weighted fraction of female directors. The instrumental variables are as follows.Fraction of male directors linked to female directorsis the fraction of male directors on the board who sit on other boards with at least one female director.Female-to-male participation ratiois the ratio of the female labor force participation rate to the male labor force participation rate in a state for a given year. The estimated parameters of the other controls are not re-ported for brevity. Panel B reports the second-stage regression results. The dependent variable is the dividend payout ratio, calculated as dividends divided by net in-come. The same set of control variables, industry and yearfixed effects as in our baseline models are included. Industry effects are constructed based on the Fama-French 49-industry classification. Statistical significance is based on the heteroskedasticity robustfirm-clustered standard errors reported in parentheses. TheStock and Yogo (2005)weak ID test critical values are for the Cragg-Donald Wald F-statistics. A higher Cragg-Donald Wald F-statistic than the corresponding critical value indicates a rejection of the null hypothesis that the instrument(s) are weak.
Panel A: First-stage regressions
Variable
Dependent variable:Fraction of female dirs
(1) (2) (3)
Fraction of male directors linked to female directors 0.046⁎⁎⁎
(0.009)
– 0.044⁎⁎⁎
(0.009)
Female-to-male participation ratio – 0.224⁎⁎⁎
(0.058)
0.208⁎⁎⁎ (0.058)
Controls Yes Yes Yes
Industry effects Yes Yes Yes
Year effects Yes Yes Yes
N 11,860 12,011 11,821
F-statistic 27.150⁎⁎⁎ 14.930⁎⁎⁎ 20.060⁎⁎⁎
Cragg-Donald (CD) Wald F-statistic 127.150 85.670 100.500
Stock and Yogo (2005)weak ID test critical value 16.380 16.380 19.930
J-statistic for over-identification – – 1.950
p-value 0.163
Panel B: Second-stage regressions
Variable
Dependent variable: Dividend/NI
(1) (2) (3)
Intercept 0.390
(0.245)
0.589⁎⁎ (0.298)
0.470⁎ (0.258)
Fraction of female directorst−1(Fitted) 2.328⁎⁎⁎
(0.804)
4.137⁎⁎⁎ (1.192)
3.064⁎⁎⁎ (0.683)
Leveraget−1 −0.095⁎
(0.049)
−0.090 (0.061)
−0.095⁎ (0.053)
R&D/Salest−1 −0.009
(0.025)
−0.004 (0.026)
−0.006 (0.025)
Tobin's qt−1 −0.004
(0.005)
−0.006 (0.007)
−0.005 (0.006)
ROAt−1 0.068
(0.081)
0.026 (0.108)
0.049 (0.090)
Return volatilityt−1 −0.542⁎⁎⁎
(0.167)
−0.424⁎ (0.221)
−0.494⁎⁎⁎ (0.184)
Cash/net assetst−1 0.020
(0.016)
0.013 (0.018)
0.017 (0.016)
PPE/TAt−1 0.079
(0.050)
0.095 (0.062)
0.083 (0.054)
Ln (TA)t−1 −0.018⁎
(0.011)
−0.037⁎⁎ (0.015)
−0.026⁎⁎ (0.010)
Board sizet−1 0.007
(0.006)
−0.004 (0.008)
0.003 (0.005)
Fraction of independent directorst−1 −0.081
(0.080)
−0.245⁎⁎ (0.121)
−0.145⁎ (0.075)
CEO Chairmant−1 −0.001
(0.017)
−0.023 (0.022)
−0.010 (0.017)
CEO tenuret−1 0.001
(0.001)
0.003 (0.002)
0.002 (0.001)
E indext−1 −0.014⁎⁎
(0.006)
−0.018⁎⁎ (0.008)
−0.016⁎⁎ (0.007)
Industry effects Yes Yes Yes
Year effects Yes Yes Yes
N 11,860 12,011 11,821
The sample for this analysis includesfirm-years one year before and one year after a director appointment, excluding the year of the appointment. To be included in the treatment group, afirm must appoint only one female director to replace a departing male director in the appointment year. We further require the departing male director to be older than 60 to ensure that the di-rector turnover is less likely driven by unobserved factors, such as changes in corporate strategy.17The application of these criteria results in 74 female director appointments for our treatment group. For the control group, we identify 474 observations where a departing male director aged above 60 is replaced with one newly appointed male director.
We then match treatment and control observations using propensity score matching to ensure that the DID estimator is not driven by differences in CEO,firm or industry characteristics. The matching procedure is analogous to that described inSection 3.3.1.18Eventually, we obtain 74 pairs of matchedfirms. In Panel A ofTable 6, we examine the differences in observable characteristics betweenfirm-years with female director appointments and their matched controls in the pre-treatment year. The univariate comparisons indicate that no statistically significant differences exist in observable characteristics between the two groups. Based on this closely matched sample, we estimate the following panel regression.
Dividend payouti;t¼αþβ1Female appointmenti;tþβ2Posti;t
þβ3Female appointmenti;tPosti;tþγZi;tþIndustryiþYeartþεi;t ð2Þ
17
As a robustness check, we require the departing director to be older than 65, resulting in a more restricted sample of 57 matched pairs. The results continue to hold. 18
We start the matching by estimating the probability, or propensity score, of afirm replacing a departing male director with a female director rather than a male director. We use the same explanatory variables as in the regressions in Panel A ofTable 4. We then match each observation in the treatment group with the observation in the control group with the closest propensity score. To ensure that the observations in the treatment and control groups are sufficiently similar, we require the dif-ference in propensity scores between the two groups to be less than 5% in absolute value.
Table 6
Difference-in-differences matching estimator.
This table reports the difference-in-differences matching estimation results. Panel A examines the differences in observable characteristics betweenfirm-years with fe-male director appointments and their matched controls in the pre-treatment year. Panel B reports the difference-in-differences estimates where the dependent variable is the dividend payout ratio, calculated as dividends divided by net income. The treatment group consists offirms that replace a departing male director aged above 60 with a female director and the control group consists offirms that replace a departing male director aged above 60 with another male director. We match treatment and control observations using propensity score matching.Female appointmentis an indicator variable that equals one if thefirm appoints a female director, and zero oth-erwise.Postis an indicator variable that equals one in the period after the appointment, and zero otherwise. The same set of control variables as in our baseline models is included. For the sake of brevity, we report only the coefficients on the main variables of interest. Industry effects are constructed based on the Fama-French 49-industry classification. Statistical significance is based on the heteroskedasticity robustfirm-clustered standard errors reported in parentheses.
Panel A: Post-match differences
Treatment Control Differences t-statistics
Leverage 0.218 0.230 −0.012 −0.454
R&D/Sales 0.036 0.026 0.010 0.878
Tobin's q 1.763 1.644 0.119 0.761
ROA 0.135 0.129 0.005 0.415
Return volatility 0.036 0.030 0.006 1.246
Cash/net assets 0.212 0.215 −0.003 −0.061
PPE/TA 0.298 0.284 0.014 0.392
Ln (TA) 7.867 7.856 0.011 0.047
Board size 9.770 9.784 −0.014 −0.040
Fraction of independent directors 0.736 0.736 0.000 0.001
CEO Chairman 0.608 0.500 0.108 1.322
CEO tenure 6.419 5.689 0.730 0.765
E index 2.973 3.027 −0.054 −0.252
Panel B: Difference-in-differences estimator
Dependent variable: Dividend/NI
(1) (2)
Female appointment −0.157⁎⁎
(0.063)
−0.132 (0.106)
Post −0.235⁎⁎⁎
(0.077)
−0.186⁎⁎ (0.071)
Female appointment × Post 0.220⁎⁎⁎
(0.084)
0.150⁎⁎ (0.067)
All controls Yes Yes
Industry effects Yes No
Firmfixed effects No Yes
Year effects Yes Yes
N 296 296
Adjusted R2
0.316 0.285
Table 7
Board gender diversity, dividend payouts and corporate governance.
This table presents the OLS regression results separately forfirms with different levels of managerial entrenchment. The six proxies for managerial entrenchment are as follows.E Indexis the entrenchment index ofBebchuk et al.
(2009).CEO Chairmanis an indicator variable equal to one if the CEO also assumes the title of Chairman, and zero otherwise.Techis an indicator variable equal to one for technologyfirms, and zero for non-technologyfirms.CEO
tenureis the number of years the CEO has been in position.Fraction of independent directorsis the number of independent directors divided by board size.Four-Firm Concentration Ratiois the fraction of a 5-digit NAICS industry's sales accounted for by its largest fourfirms and is a proxy for industry competition. Firms are split into high and low subsamples based on the sample median for a given variable. For example, afirm is included in the highProduct market competitionsubsample if its value forFour-firm concentration ratiois below the sample median, and is included in the low competition subsample otherwise. In addition, afirm is in the highE index,CEO tenureandBoard indepen-dencesubsample if itsE index,CEO tenureorFraction of independent directorsis above the sample median, and vice versa. Managers are considered to be more entrenched if thefirm is a non-technologyfirm, has a highE index, high CEO tenure, lowBoard independence, or lowProduct market competition, or has a chairman CEO. The dependent variable is the dividend payout ratio, calculated as dividends divided by net income. The same set of control variables, industry and yearfixed effects as in our baseline models are included. Industry effects are constructed based on the Fama-French 49-industry classification. Statistical significance is based on the heteroskedasticity robustfi rm-clustered standard errors reported in brackets.
E index CEO chairman Industry CEO tenure Board independence Product market
competition
High Low Yes No Non-Tech Tech High Low Low High Low High
(1) (2) (3) (4) (5) (6) (7) (8) (9) (10) (11) (12)
Intercept 0.288 (0.207) −0.052 (0.182) −0.075 (0.113) 0.777⁎⁎⁎ (0.186) −0.013 (0.077)
−0.406⁎⁎⁎ (0.132) −0.079 (0.121) 0.623⁎⁎⁎ (0.229) 0.024 (0.070) −0.001 (0.146) −0.072 (0.087) 0.341⁎⁎⁎ (0.112) Fraction of female dirst−1 0.286⁎⁎⁎
(0.092) 0.017 (0.086) 0.269⁎⁎⁎ (0.086) −0.014 (0.103) 0.253⁎⁎⁎ (0.094) 0.405 (0.297) 0.279⁎⁎⁎ (0.089) 0.063 (0.083) 0.195⁎⁎ (0.085) 0.145 (0.093) 0.229⁎⁎ (0.104) 0.107 (0.116) Leveraget–1 −0.002
(0.056)
−0.176⁎⁎⁎ (0.058)
−0.070 (0.056)
−0.103⁎ (0.058)
−0.022 (0.059)
0.179 (0.128)
−0.088⁎ (0.051)
−0.092 (0.058)
−0.135⁎⁎⁎ (0.052)
0.015 (0.061)
−0.024 (0.077)
−0.105⁎ (0.060) R&D/Salest–1 −0.076⁎
(0.040) 0.007 (0.022) −0.026 (0.037) −0.005 (0.026)
−0.122⁎⁎ (0.050)
0.022⁎ (0.011)
−0.065⁎ (0.035) 0.014 (0.019) −0.044 (0.039) 0.009 (0.018) 0.016 (0.014)
−0.106⁎ (0.064) Tobin's qt−1 0.003
(0.006) −0.003 (0.004) −0.002 (0.005) −0.001 (0.006) −0.003 (0.006) 0.001 (0.006) 0.002 (0.005) −0.005 (0.006) −0.003 (0.004) −0.001 (0.006) −0.005 (0.005) −0.004 (0.006)
ROAt−1 0.041
(0.086) 0.194⁎⁎ (0.085) 0.068 (0.083) 0.194⁎⁎ (0.091) 0.164⁎ (0.089) 0.292⁎⁎ (0.133) 0.039 (0.085) 0.191⁎ (0.098) 0.002 (0.082) 0.201⁎⁎ (0.087) 0.165 (0.105) 0.143 (0.120) Return volatilityt−1 −0.730⁎⁎⁎
(0.187)
−0.606⁎⁎⁎ (0.177)
−0.666⁎⁎⁎ (0.194)
−0.696⁎⁎⁎ (0.157)
−0.946⁎⁎⁎ (0.177)
−0.199 (0.236)
−0.412⁎⁎ (0.178)
−1.012⁎⁎⁎ (0.194)
−0.733⁎⁎⁎ (0.173)
−0.772⁎⁎⁎ (0.197)
−0.712⁎⁎⁎ (0.195)
−0.698⁎⁎ (0.284) Cash/net assetst−1 0.038
(0.032) 0.026⁎ (0.014) 0.030 (0.020) 0.032⁎ (0.019) 0.052⁎⁎ (0.026) 0.043⁎ (0.024) 0.028⁎⁎ (0.014) 0.033 (0.033) 0.054⁎⁎ (0.026) −0.001 (0.012) 0.006 (0.010) 0.065⁎⁎ (0.033)
PPE/TAt−1 0.076
(0.065) 0.068 (0.055) 0.044 (0.058) 0.104 (0.068) 0.069 (0.050) 0.514⁎⁎⁎ (0.162) 0.055 (0.061) 0.074 (0.059) 0.277⁎⁎⁎ (0.050) 0.005 (0.070) 0.080 (0.079) 0.172⁎⁎ (0.068)
Ln (TA)t−1 0.006
(0.009) 0.006 (0.007) 0.007 (0.008) 0.003 (0.009) 0.004 (0.009) 0.005 (0.014) 0.009 (0.008) 0.001 (0.008) 0.002 (0.008) 0.008 (0.008) 0.004 (0.010) 0.004 (0.009) Board sizet−1 0.020⁎⁎⁎
(0.004) 0.018⁎⁎⁎ (0.004) 0.019⁎⁎⁎ (0.004) 0.018⁎⁎⁎ (0.005) 0.027⁎⁎⁎ (0.005) 0.017⁎⁎ (0.008) 0.016⁎⁎⁎ (0.004) 0.021⁎⁎⁎ (0.004) 0.019⁎⁎⁎ (0.004) 0.022⁎⁎⁎ (0.005) 0.018⁎⁎⁎ (0.005) 0.016⁎⁎⁎ (0.004) Fraction of independent
directorst−1
0.159⁎⁎⁎ (0.054) 0.073 (0.048) 0.105⁎⁎ (0.048) 0.103⁎ (0.054) 0.046 (0.057) 0.069 (0.078) 0.062 (0.047) 0.165⁎⁎⁎ (0.053) 0.097⁎⁎ (0.048) 0.102 (0.133) 0.205⁎⁎⁎ (0.054) 0.051 (0.057) CEO Chairmant−1 0.017
(0.015)
0.035⁎⁎ (0.015)
– – 0.041⁎⁎
(0.019) 0.038 (0.025) 0.027⁎ (0.016) 0.026 (0.016) 0.030⁎⁎ (0.014) 0.027 (0.017) 0.015 (0.019) 0.026 (0.019) CEO tenuret−1 −0.002⁎
(0.001)
−0.002⁎⁎ (0.001)
−0.002⁎⁎ (0.001)
−0.001 (0.001)
−0.003⁎⁎⁎ (0.001)
−0.001 (0.002)
−0.002⁎ (0.001)
−0.002 (0.004)
−0.003⁎⁎⁎ (0.001)
−0.002 (0.001)
−0.002 (0.001)
−0.003⁎⁎⁎ (0.001) E indext−1 −0.016⁎
(0.010)
−0.021⁎⁎ (0.011)
−0.010 (0.006)
−0.012⁎ (0.007) −0.008 (0.008) 0.008 (0.011) −0.004 (0.006)
−0.018⁎⁎ (0.007)
−0.008 (0.006)
−0.011 (0.007)
−0.015⁎⁎ (0.007)
−0.002 (0.008)
Industry effects Yes Yes Yes Yes Yes Yes Yes Yes Yes Yes Yes Yes
Year effects Yes Yes Yes Yes Yes Yes Yes Yes Yes Yes Yes Yes
N 6351 5699 7430 4620 6313 1593 6371 5679 5837 6213 3729 3932
Adjusted R2 0.129 0.141 0.132 0.121 0.054 0.135 0.135 0.136 0.097 0.154 0.103 0.156
⁎ Denotes statistical significance at the 10% level. ⁎⁎Denotes statistical significance at the 5% level. ⁎⁎⁎Denotes statistical significance at the 1% level.