R E S E A R C H A R T I C L E
Open Access
Validation of reference genes for quantitative
real-time PCR (qPCR) analysis of
Actinobacillus suis
Adina R Bujold and Janet I MacInnes
*Abstract
Background:Quantitative real-time PCR is a valuable tool for evaluating bacterial gene expression. However, in order to make best use of this method, endogenous reference genes for expression data normalisation must first be identified by carefully validating the stability of expression under experimental conditions. Therefore, the objective of this study was to validate eight reference genes of the opportunistic swine pathogen,Actinobacillus suis, grown in aerobic cultures with (Epinephrine) or without (Aerobic) epinephrine in the growth medium and in anoxic static cultures (Anoxic), and sampled during exponential and stationary phases.
Results:Using the RefFinder tool, expression data were analysed to determine whether comprehensive stability rankings of selected reference genes varied with experimental design. When comparing Aerobic and Epinephrine
cultures by growth phase,pykandrpoBwere both among the most stably expressed genes, but when analysing
both growth phases together, onlypykremained in the top three rankings. When comparing Aerobic and Anoxic
samples,proSranked among the most stable genes in exponential and stationary phase data sets as well as in combined rankings. When analysing the Aerobic, Epinephrine, and Anoxic samples together, onlygyrAranked consistently among the top three most stably expressed genes during exponential and stationary growth as well as in combined rankings; therhogene ranked as least stably expressed gene in this data set.
Conclusions:Reference gene stability should be carefully assessed with the design of the experiment in mind. In this study, even the commonly used reference gene16S rRNAdemonstrated large variability in stability depending on the conditions studied and how the data were analysed. As previously suggested, the best approach may be to use a geometric mean of multiple genes to normalise qPCR results. As researchers continue to validate reference genes for various organisms in multiple growth conditions and sampling time points, it may be possible to make informed predictions as to which genes may be most suitable to validate for a given experimental design, but in the
meantime, the reference genes used to normalise qPCR data should be selected with caution.
Keywords:qPCR, Reference gene, Pasteurellaceae
Background
Actinobacillus suisis a Gram negative facultative anaer-obe which is a frequent member of the normal micro-biome of swine tonsils of the soft palate [1]. It is also an important pathogen in pigs of all ages, where it can cause septicaemia and sequelae such as meningitis, arth-ritis, and pleuropneumonia [2]. However, little is known about the pathogenesis of A. suis, including the expres-sion of virulence-associated genes.
Quantitative real-time PCR (qPCR) is a sensitive method for the determination of bacterial gene expression. In most
qPCR studies, endogenous reference genes are used to control for sample-to-sample variations that may arise due to differences in cell number and efficiency of RNA ex-traction and cDNA synthesis, among other factors [3]. Further, using a reference gene permits for normalisation of multiple genes to a common control, allowing for more robust data comparison. However, several recent studies suggest that rather than relying on commonly used genes, reference genes should be carefully selected and rigorously validated [3-6]. Also, it has been suggested that using the geometric mean of data collected from multiple reference genes is more appropriate than relying on a single refer-ence gene for normalisation [7].
* Correspondence:[email protected]
Department of Pathobiology, Ontario Veterinary College, University of Guelph, 50 Stone Road East, N1G 2W1 Guelph, Ontario, Canada
Therefore, the objective of this work was to validate reference genes of a clinical isolate ofA. suis, H91-0380, grown in different conditions and sampled during differ-ent growth phases. Eight reference genes were selected for evaluation based on published expression studies of other members of the family Pasteurellaceae [8,9] and the analysis of the A. suis genome for the presence of commonly used reference genes.
Methods
Bacterial strains and growth media
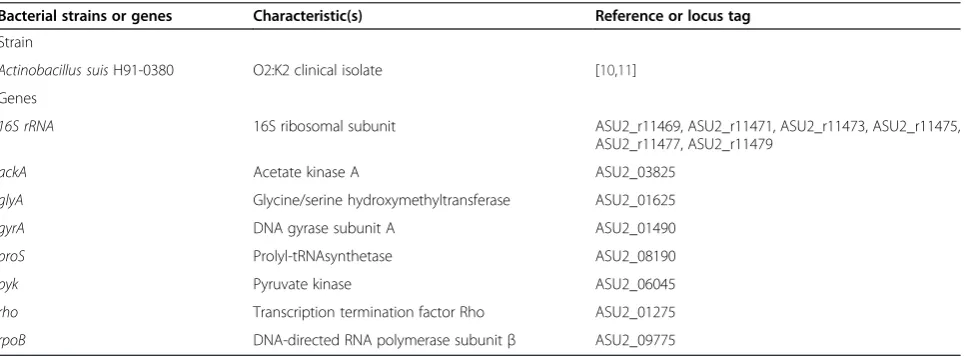
Actinobacillus suis H91-0380, a virulent O2:K2 clinical isolate collected in Southwestern Ontario, Canada, from a pig with septicaemia [10,11] (Table 1), was grown in brain heart infusion (BHI) (BD, Sparks, MD); epineph-rine (Sigma-Aldrich, St. Louis, MO) was added to the growth medium at the time of inoculation to a final con-centration of 50μM.
Growth conditions
Aerobic cultures ofA. suis H91-0380 (+/−epinephrine) were grown in BHI at 37°C with shaking at 200 rpm. Anoxic static cultures were grown without shaking in BHI at 37°C + 5% CO2in 1 mL aliquots in sealed 1.5 mL
microcentrifuge tubes.
Growth curves were done in triplicate by measuring the OD600of A. suisevery 30 minutes from the time of
inoculation until stationary phase was achieved, and then three or more additional times. Sampling time points for early exponential and early stationary phases of growth were determined, and the number of CFU/mL was calculated by plating 10-fold serial dilutions of the cultures on Columbia agar with 5% sheep blood (Oxoid Co., Nepean, ON).
RNA extraction
Samples of ~1×10⁸ CFU were collected from aerobic cultures at 60 and 180 minutes post-inoculation (mpi), and from anoxic cultures at 60 and 210 mpi (representing exponential and stationary phases, respectively). Cells were pelleted at 6000 × g for 5 minutes at 4°C and the supernatant was decanted. Cells were lysed as previously described [12]. Briefly, the pellet was suspended in 100μL pre-warmed SDS lysis solution (2% SDS, 16 mM EDTA) and heated to 100°C for 5 minutes. After addition of 1 mL TRIzol, the lysate was incubated for 5 minutes at room temperature, and then frozen at −70°C until RNA was extracted.
RNA extraction was done from four independent bio-logical replicates of each culture at the two sampling time points using the Direct-zol RNA MiniPrep Kit (Zymo Research Co., Irvine, CA). RNA was then precipi-tated with 2.5 M lithium chloride (Amresco, Solon, OH), re-suspended in nuclease-free water, and treated with DNase I (Invitrogen, Carlsbad, CA) for 30 minutes at 37°C. Ethylenediaminetetraacetic acid (EDTA; 2.3 mM) was then added and the samples were heat-inactivated at 65°C for 10 minutes. RNA quality was assessed using an Agilent 2100 Bioanalyzer (Agilent Technologies, Santa Clara, CA).
cDNA was synthesised from 500 ng of total cellular RNA by random priming using a High Capacity cDNA Reverse Transcription Kit (Applied Biosystems, Foster City, CA) in the presence of RNase inhibitor as per the manufacturer’s instructions.
Semi-quantitative real-time PCR
[image:2.595.58.541.555.733.2]Primers were designed using Primer3 as previously de-scribed [13], and are listed in Table 2. The amplification efficiencies of all primer pairs were between 95 and
Table 1 Bacterial strain and genes used in this work
Bacterial strains or genes Characteristic(s) Reference or locus tag
Strain
Actinobacillus suisH91-0380 O2:K2 clinical isolate [10,11]
Genes
16S rRNA 16S ribosomal subunit ASU2_r11469, ASU2_r11471, ASU2_r11473, ASU2_r11475, ASU2_r11477, ASU2_r11479
ackA Acetate kinase A ASU2_03825
glyA Glycine/serine hydroxymethyltransferase ASU2_01625
gyrA DNA gyrase subunit A ASU2_01490
proS Prolyl-tRNAsynthetase ASU2_08190
pyk Pyruvate kinase ASU2_06045
rho Transcription termination factor Rho ASU2_01275
102%. Three technical replicates were done per sample in a total reaction volume of 10 μL, which contained 5 μL of PerfeCTa® SYBR® Green FastMix® (Quanta Bio-Sciences, Inc., Gaithersburg, MD), 2.5 μL of a forward/ reverse primer mix with 1.6 μM of each primer, and 2.5μL of cDNA diluted 1:15.
Real-time PCR was done in a StepOnePlus Thermocy-cler (Applied Biosystems, Foster City, CA) using a pro-gram with an initial denaturation step at 95°C for 30 seconds followed by 40 cycles of 95°C for 3 seconds and 60°C for 30 seconds. Stepwise melt curves were done at the end of each run to confirm that only one template was amplified.
Reference gene validation
The stability of eight reference genes (Table 1) was assessed using RefFinder (http://www.leonxie.com/refer-encegene.php), a web-based tool that integrates the algo-rithms for geNorm, Normfinder, BestKeeper, and the comparative ΔCt methods to rank candidate reference
genes from most to least stable. A composite score is then assigned to each gene by taking into account the rankings of the various algorithms employed.
Results
Growth curves to determine sampling time points
To determine the times of early exponential and early stationary growth phase, growth curves of aerobic cul-tures with (Epinephrine) or without (Aerobic) 50 μM epinephrine added to the growth medium at the time of inoculation, and anoxic static cultures (Anoxic) (Figure 1) were done. Aerobic cultures, with or without epineph-rine, grew to a higher optical density than the Anoxic cultures. However, the presence of epinephrine in the growth medium did not affect the rate of growth of these cultures relative to Aerobic cultures.
To control for sample variability [14], once the expo-nential and early stationary growth phase time points were identified, the volume of culture sampled was ad-justed to ensure that an approximately equal number of cells was collected for RNA extraction each time; cell numbers were also enumerated by plate counting.
Reference gene validation based on growth condition and growth phase
[image:3.595.57.292.98.338.2]Comparisons of comprehensive stability rankings of ref-erence genes were determined for the epinephrine study (Aerobic and Epinephrine samples) and the anoxic study (Aerobic and Anoxic samples). For overall comparison,
Table 2 Primers used in this work
Primer name Sequence Source
ASU2-16SrRNA-F1 GTGTAGCGGTGAAATGCGTAGAG This work
ASU2-16SrRNA-R1 ACATGAGCGTCAGTACATTCCCA This work
ASU2-ackA-F1 AGCCACCTATTCATCACATCACAA This work
ASU2-ackA-R1 TACGAACAACAGATACAGAACCACC This work
ASU2-glyA-F1 GTTTATATCCGAATCCATTACCGCAC This work
ASU2-glyA-R1 TCATCGCCACAAGCAGAAAGAA This work
ASU2-gyrA-F1 ATCTGGTATTGCGGTTGGTATGG This work
ASU2-gyrA-R1 TTCTTCAATGCTGATTTGCTCGTTT This work
ASU2-proS-F1 GTGGACAAAGCGTCATTACAAGAAAC This work
ASU2-proS-R1 CGGAAATCTAAACCAAGACGAGTGAA This work
ASU2-pyk-F1 CAACTGAAGAAGCAATGGACGACA This work
ASU2-pyk-R1 AACTAACGCAGCATCACCGATTT This work
ASU2-rho-F1 TTCTTCCTGACGGTTTCGGTTTCTT This work
ASU2-rho-R1 AACGGCGGATTTGGCTTGGT This work
ASU2-rpoB-F1 AAACGCAACAAGATCATTCAAGGTG This work
ASU2-rpoB-R1 ATTTGACGACGAACCGCTAAGTAAA This work
0.01 0.1 1 10
0 30 60 90 120 150 180 210 240 270 300
OD
600nm
Time (minutes)
Aerobic
Epinephrine
Anoxic
[image:3.595.57.540.525.705.2]samples from both the epinephrine and the anoxic stud-ies at each time point (exponential and stationary) and combined samples (collected during both exponential and stationary growth) were also evaluated.
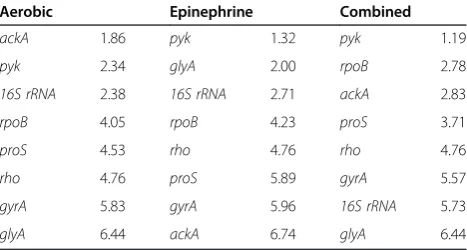
When comparing gene stability for samples collected during exponential growth phase in the epinephrine study (Table 3), the presence of epinephrine in the growth media affected the order of the gene stability rankings. In the Aerobic cultures, ackA was the most stably expressed gene, while glyA was the least stably expressed. Conversely, in the Epinephrine cultures,ackA was the least stably expressed gene and glyA was the second most stable gene. In both Aerobic and Epineph-rine cultures, pyk ranked in the top two most stably expressed genes, so it was not surprising that it was the most stably expressed gene when all samples collected during exponential growth in the epinephrine study were combined. With the exception of ackA and glyA, the overall order of the stability rankings for the Aerobic and Epinephrine samples was comparable.
In the anoxic study, the stability of reference genes in samples collected during exponential growth for both Aerobic and Anoxic cultures were compared (Table 4). The 16S rRNA gene was the most stably expressed in Anoxic cultures, but it ranked second to last in the Aerobic samples. The second and third most stably expressed genes in the Anoxic samples, proS and gyrA, ranked in the top three most stably expressed genes in the Aerobic cultures, as well. Interestingly, rpoB, the least stably expressed gene in the Aerobic cultures, ranked third in the combined stability rankings of refer-ence genes for exponential samples collected from both Aerobic and Anoxic cultures, while the second most sta-bly expressed gene in the Aerobic samples, glyA, was ranked as the least stably expressed gene in the com-bined scores.
When comparing the stability of reference genes from samples collected in the epinephrine study during sta-tionary phase (Table 5), there was less variation among
the top three most stably expressed genes compared to exponential samples. In stationary growth, bothpykand rpoB ranked in the top three for Aerobic, Epinephrine, and combined samples. The expression of 16S rRNA was less stable in the Aerobic samples than in the Epi-nephrine samples, while the opposite was true forgyrA. The least stably expressed gene, ackA, was consistent in all rankings, and glyA was also found in the bottom three rankings for all analyses of these samples.
In the samples collected for the anoxic study at sta-tionary phase, the stability rankings differed in Aerobic samples and Anoxic samples (Table 6). The stability scores ofproS,16S rRNA,andrhodid not differ substan-tially between these different growth conditions. The scores of rpoB, pyk, glyA, gyrA,and ackA,however, var-ied markedly, resulting in very different ranking orders for reference genes measured in the Aerobic and Anoxic cultures.
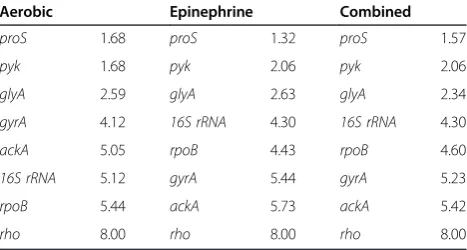
[image:4.595.305.539.114.237.2]When the data for all samples collected during expo-nential and stationary growth in the epinephrine study were analysed together, the overall stability rankings of the top three genes was similar in both growth condi-tions, and this was reflected in the combined rankings (Table 7), withproS,pyk, andglyAbeing the most stably expressed. With the exception ofrho, which consistently ranked as the least stably expressed gene, the difference
Table 3 Comprehensive stability rankings of epinephrine study reference genes from early exponential phase samples
Aerobic Epinephrine Combined
ackA 1.86 pyk 1.32 pyk 1.19
pyk 2.34 glyA 2.00 rpoB 2.78
16S rRNA 2.38 16S rRNA 2.71 ackA 2.83
rpoB 4.05 rpoB 4.23 proS 3.71
proS 4.53 rho 4.76 rho 4.76
rho 4.76 proS 5.89 gyrA 5.57
gyrA 5.83 gyrA 5.96 16S rRNA 5.73
[image:4.595.57.291.608.733.2]glyA 6.44 ackA 6.74 glyA 6.44
Table 4 Comprehensive stability rankings of anoxic study reference genes from early exponential phase samples
Aerobic Anoxic Combined
gyrA 1.41 16S rRNA 1.32 proS 1.19
glyA 2.11 proS 2.21 gyrA 1.41
proS 2.63 gyrA 2.45 rpoB 3.41
pyk 3.31 rpoB 3.50 16S rRNA 3.94
rho 5.24 pyk 4.23 pyk 4.95
ackA 5.69 glyA 6.48 ackA 6.09
16S rRNA 6.26 ackA 6.65 rho 6.24
rpoB 6.96 rho 7.44 glyA 8.00
Table 5 Comprehensive stability rankings of epinephrine study reference genes from early stationary phase samples
Aerobic Epinephrine Combined
pyk 1.50 16S rRNA 1.73 pyk 1.41
rpoB 2.00 pyk 2.00 rpoB 2.11
gyrA 3.22 rpoB 2.82 16S rRNA 3.76
rho 3.31 proS 4.23 proS 3.83
proS 4.56 rho 4.30 rho 4.30
16S rRNA 5.12 gyrA 4.56 glyA 4.53
glyA 5.69 glyA 5.23 gyrA 5.05
[image:4.595.303.539.608.731.2]in stability scores of the remaining 4 reference genes was not substantial.
Comprehensive rankings of the combined exponential and stationary samples of the anoxic study (Table 8) had similar trends to those observed in the epinephrine study, with proS and pyk ranking high in stability. The only exception to this was with glyA and gyrA, where stability in Aerobic and Anoxic cultures differed enough to affect both their stability scores and their overall rank-ings in each growth condition.
Finally, data from samples collected in both the epi-nephrine and anoxic studies were combined in order to determine overall comprehensive rankings and the effect of multiple growth conditions on gene stability rankings (Table 9). During exponential phase, 16S rRNA, gyrA, and ackA were the most stable reference genes, with comparable stability scores. However, in stationary phase, only gyrA remained in the top ranking reference genes for stability, with 16S rRNA and ackA ranking near the bottom of the list. The other two most stably expressed genes wererpoB, which ranked 5th for exponential sam-ples, and pyk, which ranked 4th. In the combined com-prehensive ranking, the most stably expressed reference genes werepyk, glyA, and gyrA. When comparing these genes to the combined comprehensive rankings from the
other analyses, it is interesting to note that at least one of these genes, and sometimes two, ranked among the top three most stably expressed genes in all other conditions. Using geNorm’s calculation of pairwise variation to deter-mine the optimal number of reference genes, it was found that three reference genes were adequate for effective data normalisation (data not shown).
[image:5.595.56.293.112.237.2]In summary, in the epinephrine study, where only aer-obic cultures with or without epinephrine in the growth media were compared, two of the same reference genes (pyk and rpoB) ranked in the top three most stably expressed genes in samples collected during exponential and stationary phases (Tables 3 and 5). However, when the comprehensive stability rankings of all samples in the epinephrine study collected during both phases of growth were compared (Table 7), only pyk remained among the top three most stably expressed genes. Simi-larly, in the anoxic study, where Aerobic and Anoxic samples were grouped together in the experimental de-sign,proS and rpoBboth ranked among the most stably expressed reference genes in the combined rankings for each of the exponential (Table 4) and stationary (Table 6) phase samples, whereas onlyproSranked among the top three most stably expressed genes of the combined
Table 6 Comprehensive stability rankings of anoxic study reference genes from early stationary phase samples
Aerobic Anoxic Combined
rpoB 1.41 glyA 1.41 pyk 1.86
pyk 1.57 gyrA 2.28 proS 1.97
proS 3.41 proS 2.63 rpoB 2.06
gyrA 4.00 16S rRNA 3.94 gyrA 4.47
16S rRNA 4.14 rho 4.76 glyA 4.68
rho 5.23 ackA 5.38 16S rRNA 4.76
glyA 6.48 rpoB 5.69 ackA 6.24
[image:5.595.299.539.121.248.2]ackA 8.00 pyk 6.96 rho 7.24
Table 7 Comprehensive stability rankings of epinephrine study reference genes from exponential and stationary growth phase samples
Aerobic Epinephrine Combined
proS 1.68 proS 1.32 proS 1.57
pyk 1.68 pyk 2.06 pyk 2.06
glyA 2.59 glyA 2.63 glyA 2.34
gyrA 4.12 16S rRNA 4.30 16S rRNA 4.30
ackA 5.05 rpoB 4.43 rpoB 4.60
16S rRNA 5.12 gyrA 5.44 gyrA 5.23
rpoB 5.44 ackA 5.73 ackA 5.42
[image:5.595.303.538.607.731.2]rho 8.00 rho 8.00 rho 8.00
Table 8 Comprehensive stability rankings of anoxic study reference genes from exponential and stationary growth phase samples
Aerobic Anoxic Combined
proS 1.41 gyrA 1.97 proS 1.41
glyA 2.11 proS 2.06 pyk 2.06
pyk 2.91 pyk 2.21 gyrA 3.22
ackA 4.24 16S rRNA 3.76 ackA 3.98
gyrA 4.68 ackA 3.81 glyA 4.23
16S rRNA 4.76 glyA 4.90 16S rRNA 4.60
rpoB 5.69 rho 6.74 rpoB 6.24
rho 7.24 rpoB 8.00 rho 7.48
Table 9 Comprehensive stability rankings of genes from epinephrine and anoxic studies at exponential and stationary phase
Exponential Stationary Combined
16S rRNA 2.00 rpoB 1.73 pyk 2.06
gyrA 2.06 pyk 1.78 glyA 2.38
ackA 2.59 gyrA 3.22 gyrA 2.63
pyk 3.81 glyA 3.46 proS 3.03
rpoB 3.94 proS 4.70 rpoB 4.05
glyA 4.74 ackA 4.95 ackA 4.40
proS 5.60 16S rRNA 5.29 16S rRNA 6.09
[image:5.595.57.291.608.733.2]scores for all samples of the anoxic study collected dur-ing both growth phases (Table 8).
Discussion
To date, no studies have been done to characterise refer-ence genes for A. suis and our preliminary studies sug-gested that reference genes used to study closely related organisms were not appropriate. Therefore, the expres-sion stability of eight reference genes was assessed in different growth conditions, growth phases, and with various methods of data analysis. No single reference gene was suitable for normalisation of qPCR results in all growth conditions, sampling time points, or experi-mental designs. Depending on how the data were ana-lysed, the overall stability rankings of all the reference genes evaluated varied markedly.
Some of the reference genes validated in this study were studied in previous work done by Klitgaard Nielsen and Boye [8] in Actinobacillus pleuropneumoniae. Simi-lar to A. pleuropneumoniae, glyA and pyk were stably expressed in most conditions and time points inA. suis. On the other hand,rho ranked low in stability in nearly all cases, often at or near the bottom of the list of genes characterised, and demonstrated several Ct differences
between exponential and stationary phase samples, and between Aerobic and Anoxic samples in the anoxic studies (data not shown).
When choosing appropriate reference genes, consider-ation should be given to the design of the study, as the number of sampling time points and the different growth phases in which samples are collected can impact the choice of reference genes for data normalisation down-stream. Likewise, if the experimental design includes sam-ples from numerous growth conditions with changes in variables such as degree of aeration (shaken vs. static), overall levels of oxygen (aerobic vs. anoxic), different additives in the growth media (presence or absence of epinephrine), and phase of growth when sampling (expo-nential vs. stationary), the impact on the comprehensive stability rankings of potential reference genes can be drastic. A thorough reference gene validation study of Staphylococcus epidermidis by Vandecasteele et al. [15] found that gene expression of purported reference genes, particularly that of 16S rRNA,varied in response to dif-ferent growth conditions. In this study, when combining all samples from both the epinephrine study and the anoxic study collected at both exponential and stationary phases (Table 9), gyrA was the only reference gene that ranked among the top three most stably expressed genes during exponential phase, stationary phase, and com-bined sampling time points.
The determination of whether to keep or discard a reference gene can be made based on the stability scores assigned by the different algorithms that go into
determining the composite score. If a gene is found to rank consistently low in stability by most or all of the individual algorithms for a given experimental design, the composite score of this gene will reflect this due to the weighted calculation employed in its determination. Similarly, the cut-off between a suitable or unsuitable ref-erence gene can be considered in the context of the indi-vidual algorithms depending on the design of the study. BestKeeper and geNorm employ similar techniques of pairwise comparisons of reference genes while consider-ing the dataset as a whole rather than considerconsider-ing the possible effects of comparing different time points or replicates collected [16]. On the other hand, NormFinder takes into account these latter types of variation, and compares each gene to the mean derived from the dataset and so it is better able to identify the gene(s) with the greatest stability in the conditions included in the dataset. To benefit from the strengths of each algorithm, and to limit the inherent biases from the assumptions employed by these different methods of reference gene validation, the composite score assigned by RefFinder reflects the geometric mean of the weighted ranking of a gene from the different algorithms. It is also valuable to employ geNorm’s calculation of pairwise variations in normal-isation factors for different combinations of reference genes in order to determine the optimum number of reference genes recommended for accurate normalisa-tion [7]. Employing this method in addinormalisa-tion to the sta-bility rankings from the algorithms and the composite scores from RefFinder allows for a reasonable valid-ation of the most stably expressed reference genes as well as the ideal number of reference genes suited to a given experimental design based on the genes tested.
gene was also validated independently by qPCR. In a study of Aggregatibacter actinomycetemcomitans, qPCR was used to look at whether the expression of selected genes from in vivo-induced antigen technology in human infections was consistent with the expression of the same genes during epithelial cell interaction. In this work, 16S rRNAandgapdh were used for normalisation [20]. While these reference genes were validated, the authors mentioned that their expression was variable and that they were differentially expressed under experi-mental conditions. Despite this, Longo et al. [21] used gapdh to normalise expression data in a later study. Finally, in a study looking at gene expression of Man-nheimia haemolytica at two time points during experi-mental infection of calves and at early log phase of bacteria grown in vitro, dnaN was used to normalise qPCR results based on its apparent stable expression in a previous microarray study [22]; however, no mention was made as to whether this gene was specifically vali-dated for qPCR.
There have been many studies where 16S rRNA has been used as the sole reference gene for data normalisa-tion with little or no data provided regarding its suitabil-ity. Others have observed variability in the stability of 16S rRNA for various organisms grown under different conditions, and even strain-to-strain variation among members of the same species [15,23]. In the current study, 16S rRNA ranked as the most stably expressed gene in three instances (Tables 4, 5, and 9), and in the top three most stably expressed genes for combined data once (Table 5). This is not to say that16S rRNA is not suitable for some studies, but caution should be taken in assuming that this gene is stably expressed in all growth conditions and growth phases, and its suitability should be assessed for each study and experimental design.
Conclusions
The current study demonstrated the relative stability rankings of eight reference genes in A. suis in different growth conditions and growth phases. This work lends further support to the notion that reference genes must be carefully assessed with all of the experimental condi-tions in mind, and that one should not rely on com-monly used genes without first demonstrating the stability of their expression under the specific conditions under study. As more qPCR studies are reported, it may be possible to make informed predictions as to which reference genes might be useful to select for validation studies; however, in the meantime, caution is warranted. Finally, these data support the recommendations of Van-desompele et al. [7] that the best approach to normalise qPCR results may be to use the geometric mean of mul-tiple reference genes.
Competing interests
The authors declare that they have no competing interests.
Authors’contributions
ARB designed the studies, carried out sample collection, RT-qPCR, and data analysis, and drafted the manuscript. JIM assisted in experimental design. Both authors read, revised, and approved the final manuscript.
Acknowledgements
This work was funded by a grant from the Natural Sciences and Engineering Research Council of Canada to JIM. ARB is supported by an Ontario Veterinary College PhD Scholarship and an Ontario Graduate Scholarship. We thank Dr. Boerlin for the use of his liquid handling robot.
Received: 6 November 2014 Accepted: 4 March 2015
References
1. Kernaghan S, Bujold AR, MacInnes JI. The microbiome of the soft palate of swine. Anim Health Res Rev. 2012;13:110–20.
2. MacInnes JI, Desrosiers R. Agents of the“suis-ide diseases”of swine: Actinobacillus suis,Haemophilus parasuis, andStreptococcus suis. Can J Vet Res. 1999;63:83–9.
3. Huggett J, Dheda K, Bustin S, Zumla A. Real-time RT-PCR normalisation; strategies and considerations. Genes Immun. 2005;6:279–84. 4. Derveaux S, Vandesompele J, Hellemans J. How to do successful gene
expression analysis using real-time PCR. Methods. 2010;50:227–30. 5. Dheda K, Huggett JF, Chang JS, Kim LU, Bustin SA, Johnson MA, et al. The
implications of using an inappropriate reference gene for real-time reverse transcription PCR data normalization. Anal Biochem. 2005;344:141–3. 6. Radonic A, Thulke S, Mackay IM, Landt O, Siegert W, Nitsche A. Guideline to
reference gene selection for quantitative real-time PCR. Biochem Biophys Res Commun. 2004;313:856–62.
7. Vandesompele J, De Preter K, Pattyn F, Poppe B, Van Roy N, De Paepe A, et al. Accurate normalization of real-time quantitative RT-PCR data by geometric averaging of multiple internal control genes. Genome Biol. 2002;3:RESEARCH0034.
8. Klitgaard Nielsen K, Boye M. Real-time quantitative reverse transcription-PCR analysis of expression stability ofActinobacillus pleuropneumoniae house-keeping genes during in vitro growth under iron-depleted conditions. Appl Environ Microbiol. 2005;71:2949–54.
9. Ren W, Liu S, Chen S, Zhang F, Li N, Yin J, et al. Dietary L-glutamine supplementation increasesPasteurella multocidaburden and the expression of its major virulence factors in mice. Amino Acids. 2013;45:947–55. 10. MacInnes JI, Mackinnon J, Bujold AR, Ziebell K, Kropinski AM, Nash JH.
Complete genome sequence ofActinobacillus suisH91-0380, a virulent serotype O2 strain. J Bacteriol. 2012;194:6686–7.
11. Van Ostaaijen J, Frey J, Rosendal S, MacInnes JI.Actinobacillus suisstrains isolated from healthy and diseased swine are clonal and carryapxICABDvar. suis andapxIICAvar. suistoxin genes. J Clin Microbiol. 1997;35:1131–7.
12. Deslandes V, Denicourt M, Girard C, Harel J, Nash JH, Jacques M.
Transcriptional profiling ofActinobacillus pleuropneumoniaeduring the acute phase of a natural infection in pigs. BMC Genomics. 2010;11:98.
13. Thornton B, Basu C. Real-time PCR (qPCR) primer design using free online software. Biochem Mol Biol Educ. 2011;39:145–54.
14. Bustin SA, Benes V, Nolan T, Pfaffl MW. Quantitative realtime RTPCR -a perspective. J Mol Endocrinol. 2005;34:597–601.
15. Vandecasteele SJ, Peetermans WE, Merckx R, Van Eldere J. Quantification of expression ofStaphylococcus epidermidishousekeeping genes with Taqman quantitative PCR during in vitro growth and under different conditions. J Bacteriol. 2001;183:7094–101.
16. Hildyard JC, Wells DJ. Identification and validation of quantitative PCR reference genes suitable for normalizing expression in normal and dystrophic cell culture models of myogenesis. PLoS Curr. 2014;6:6. 17. Gangaiah D, Zhang X, Fortney KR, Baker B, Liu Y, Munson Jr RS, et al.
Activation of CpxRA inHaemophilus ducreyiprimarily inhibits the expression of its targets, including major virulence determinants. J Bacteriol. 2013;195:3486–502.
19. Tremblay YD, Deslandes V, Jacques M.Actinobacillus pleuropneumoniae genes expression in biofilms cultured under static conditions and in a drip-flow apparatus. BMC Genomics. 2013;14:364.
20. Richardson J, Craighead JC, Cao SL, Handfield M. Concurrence between the gene expression pattern ofActinobacillus actinomycetemcomitansin localized aggressive periodontitis and in human epithelial cells. J Med Microbiol. 2005;54:497–504.
21. Longo PL, Nunes AC, Umeda JE, Mayer MP. Gene expression and phenotypic traits ofAggregatibacter actinomycetemcomitansin response to environmental changes. J Periodontal Res. 2013;48:766–72.
22. Sathiamoorthy S, Shewen PE, Hodgins DC, Lo RY. In vivo gene expression in Mannheimia haemolyticaA1 during a time-course trial in the bovine host. Vet Microbiol. 2012;158:163–71.
23. Metcalf D, Sharif S, Weese JS. Evaluation of candidate reference genes in Clostridium difficilefor gene expression normalization. Anaerobe. 2010;16:439–43.
Submit your next manuscript to BioMed Central and take full advantage of:
• Convenient online submission
• Thorough peer review
• No space constraints or color figure charges
• Immediate publication on acceptance
• Inclusion in PubMed, CAS, Scopus and Google Scholar
• Research which is freely available for redistribution