This is a repository copy of
The scale dependence and structure of convergence fields
preceding the initiation of deep convection
.
White Rose Research Online URL for this paper:
http://eprints.whiterose.ac.uk/80180/
Version: Published Version
Article:
Birch, CE, Marsham, JH, Parker, DJ et al. (1 more author) (2014) The scale dependence
and structure of convergence fields preceding the initiation of deep convection.
Geophysical Research Letters, 41 (13). 4769 - 4776. ISSN 0094-8276
https://doi.org/10.1002/2014GL060493
[email protected]
https://eprints.whiterose.ac.uk/
Reuse
Unless indicated otherwise, fulltext items are protected by copyright with all rights reserved. The copyright
exception in section 29 of the Copyright, Designs and Patents Act 1988 allows the making of a single copy
solely for the purpose of non-commercial research or private study within the limits of fair dealing. The
publisher or other rights-holder may allow further reproduction and re-use of this version - refer to the White
Rose Research Online record for this item. Where records identify the publisher as the copyright holder,
users can verify any specific terms of use on the publisher’s website.
Takedown
If you consider content in White Rose Research Online to be in breach of UK law, please notify us by
The scale dependence and structure of convergence
fi
elds preceding the initiation of deep convection
Cathryn E. Birch1, John H. Marsham2, Douglas J. Parker2, and Christopher M. Taylor3
1MetOf
fice@Leeds, University of Leeds, Leeds, UK,2Institute for Climate and Atmospheric Science, School of Earth and Environment, University of Leeds, Leeds, UK,3Centre for Ecology and Hydrology, Wallingford, UK
Abstract
Links between convergence and convection are poor in global models, and poor representation of convection is the source of many model biases in the tropics. State-of-the-art convection-permitting simulations allow us to analyze realistic convection statistically. The analysis of fractal dimension is used to show that in convection-permitting simulations (grid spacings 1.5, 4, and 12 km) of the West African monsoon, 50% of deep convective initiations occur in the near vicinity of low-level boundary layer convergence lines that are orientated along the mean wind. In these simulations, more than 80% of the initiations occur within large-scale (300 × 300 km) convergence, with some 20% in large-scale divergence, and almost all cases occur within local scale (60 × 60 km) convergence. The behavior alters in a simulation with a convection scheme and a grid spacing of 12 km; initiation is less frequent over convergence lines, and there is less dependency on high-magnitude low-level local convergence.1. Introduction
Representing the initiation and development of tropical convection in weather and climate models remains one of the key challenges in atmospheric science [Stephens et al., 2010]. Recent work using a high-resolution, convection-permitting modeling framework has explained how the inadequate representation of convection through parameterization plays a significant role in continental scale tropical biases [Marsham et al., 2013;
Birch et al., 2014]. Tropical land areas provide a particular challenge because the values of convective inhibition (CIN) can often be high, which means a dynamical forcing or“trigger”is generally required to bring parcels to their level of free convection, and these triggers are generally not resolved in global models. Triggers may take the form of convergence lines, gravity waves, cold pool outflows, regions of elevated topography or surface“hot spots”from mesoscale variations in surfacefluxes due to moisture availability, and/or surface cover [Pielke, 2001].
Low-level convergence is a crucial part of the triggering process for multiple reasons. The associated lifting cools the midlevels, thus increasing the convective available potential energy and reducing CIN, as well as increasing the relative humidity, which in turn reduces dry dilution through entrainment into convective plumes. On the cloud scale, lifting also provides a mechanism to overcome CIN, through the kinetic energy of ascending parcels. Reduced entrainment of dry air at convergence lines has also been shown to lead to increased humidity in the boundary layer, decreasing CIN [Garcia-Carreras et al., 2011].Birch et al. [2013] present a case study and show that the 100 km scale low-level convergence is thefirst-order determinant of whether or not a storm develops, although smaller scale processes determined the exact location and timing.
Most parameterization schemes diagnose convection from the buoyancy, through a simple parcel ascent, and have no knowledge of the surrounding grid boxes. Sensitivity experiments, where various trigger functions have been tested within the same global climate model (GCM), show that the position, timing, and intensity of convective activity vary substantially depending on the method employed [Kain and Fritsch, 1992] and can have major consequences for simulated convection and climate. This is especially true for the diurnal cycle of convection, where convection triggers almost immediately after sunrise over tropical land in many global models [Bechtold et al., 2004].Birch et al. [2014] show that the ability of the models to trigger convection at the correct location and time is crucial for the regional water budget and thus the representation of the entire West African monsoon. Improving the triggering procedure to be more physically based has been shown to improve the diurnal cycle of tropical precipitation more widely [e.g.,Bechtold et al., 2004].
Geophysical Research Letters
RESEARCH LETTER
10.1002/2014GL060493
Key Points:
•Fifty percent of storms initiate along convergence lines
•Most initiations occur in large and local scale convergence •Parameterized convection exhibits
a weaker dependence on strong convergence
Supporting Information: •Readme
•Figure S1
Correspondence to: C. E. Birch,
cathryn.birch@metoffice.gov.uk
Citation:
Birch, C. E., J. H. Marsham, D. J. Parker, and C. M. Taylor (2014), The scale dependence and structure of conver-gencefields preceding the initiation of deep convection,Geophys. Res. Lett.,41, 4769–4776, doi:10.1002/2014GL060493.
Received 12 MAY 2014 Accepted 14 JUN 2014
Our ability to run atmospheric models at higher resolution is increasing all the time. The UK Met Office has recently decreased the grid spacing of its global operational numerical weather prediction model to 17 km in midlatitudes. This resolution allows mesoscale structures to begin to be represented and is within the“grey zone,”where convection and mesoscale dynamics are partly resolved, while the statistical assumptions on which the parameterization schemes are based do not hold. Within these developments lies a need and an opportunity to redesign convective parameterization schemes to have a higher dependency on grid spacing [Arakawa et al., 2011] and to possibly make use of the mesoscale features that will be explicitly resolved. Certain information is required for these developments, such as the scale of convergence features that need to be captured in order to represent convective triggers and the statistics of convective activity in regard to larger-scale forcing.
In recent years, we have, for thefirst time, gained the ability to run limited-area models with sub-5 km grid spacing on continental scale domains for periods of several months. This development has, for the
first time, provided an opportunity to analyze mesoscale features that have otherwise been extremely hard to observe in sufficient quantities to get good statistics, alongside large-scalefields such as convergence, which are very hard to observe with reasonable accuracy.Taylor et al. [2013] used this model framework to show that atmospheric models employing a conventional convective parameterization scheme produce a precipitation-soil moisture feedback of the wrong sign, even at 12 km grid spacing when the surface-driven mesoscale dynamics are reasonably well captured. On the other hand, running the same model at 12, 4, and 1.5 km grid spacings with the convective parameterization switched off produced a feedback of the opposite (and correct) sign and the correct spatial structure. Similarly, an incorrect link between convergence and convection will lead to errors in the diurnal cycle of convection, affecting energy budgets [Parker et al., 2005], self-organization of convection, and coupled earth system processes such as dust uplift [Heinold et al., 2013]. Since convective parameterizations are still undoubtedly needed at these resolutions, this suggests a need to develop schemes which are specifically designed for use on these grid scales.
In this study convergence preceding the triggering of deep convection in model simulations with various horizontal grid spacings is analyzed statistically. First, a form of fractal dimension is used to illustrate the type and shape of mesoscale convergence features associated with convection initiation and their relationship with the mean wind. Second, the relationship between and relative importance of large-scale and local convergence are investigated. Within the analysis, the dependency of these aspects on model grid spacing and the way it represents convection are considered.
2. Model Simulations and Storm Tracking
Met Office Unified Model (MetUM) limited-area model simulations were run over West Africa as part of the UK Cascade consortium project. The Cascade project uses large domain, free-running regional model simulations at a variety of horizontal grid spacings to study convective organization and understand model biases related to tropical convection. Simulations were performed with 12 km grid spacing, employing theGregory and Rowntree[1990] massflux parameterization (12P [Walters et al., 2014]), and with 12, 4, and 1.5 km grid spacings (12E, 4E, and 1.5E), where the convection scheme was switched off. The simulations were initialized with a European Centre for Medium-Range Weather Forecasts (ECMWF) analysis at 0000 UTC, 26 July 2006. Parameterizations 12P, 12E, and 4E were run for 40 days and 1.5E for 9 days. Parameterizations 12P and 12E were forced at the boundaries by ECMWF analyses every 6 h, 4E was forced at the boundaries by 12P every 30 min, and 1.5E by 4E every 15 min.Pearson et al. [2013] provide a more detailed description of the model configurations.
The initiation locations of storms are identified in the model simulations using a tracking algorithm developed byTaylor et al. [2011] for use with satellite observations and modified byTaylor et al. [2013] for use with these Cascade simulations. In summary, 15 min precipitation totals from the simulations are used to identify contiguous rainy areas exceeding 1000 km2at any time of day. These features are then tracked back in time and space to the location and time of thefirst rainy grid cell. For 4E, a total of 4320 initiations were identified over the 40 days (small black dots, Figure S1 in the supporting information). In this study we focus on the Sahel domain highlighted in Figure S1 in the supporting information and exclude initiations where local topographic height exceeds 500 m, resulting in a total of 1488 cases. Repeating this process using the 12P, 12E, and 1.5E simulations gives 4051, 770, and 329 initiations, respectively. Both 4E and 1.5E
produce 37 initiations per model day and 12E produces 19. The difference is likely explained by the fact a grid spacing of 12 km is coarse for a convection-permitting simulation, and only the strongest updrafts are able to cause sufficient uplift to initiate deep convection. Many more separate initiations are identified in 12P due to the showery rain it produces. For some aspects of the analysis, only the results from 4E are shown because the three configurations without convective parameterization have a very similar statistical behavior.
3. Analysis Method and Examples
For each simulation, boundary layer convergence is computed from the 925 hPa horizontal wind
components at the initiation time (the results were found to be insensitive to the choice of convergence from this time or the preceding 2 h). The area-mean convergencefield,C, is analyzed within squares centered over each of the initiation locations. The squares have sides of lengthL, whereLvaries from the size of the grid spacing (e.g., 4 km in the case of 4E) to 300 km, to give convergenceC4toC300. The“background”
convergencefield is also computed byfinding the mean convergence over the whole Sahelian subdomain at all times.
We can understand the spatial distribution of convergence in terms of the magnitude of“local”convergence features,Clocaland the large-scale, background convergence,C∞, obtained whenLbecomes large. The
examples in Figure 1 show two patterns of convergence from which the convection is triggered:
1. Spatially distributed convergence (Figure 1a) whereCis approximately constant, regardless ofL:
C∼C
[image:4.612.198.546.92.371.2]∞∼Clocal (1)
2. Linear convergence (Figure 1b) whereCdecreases withL:
C∼C
∞þ
Clocal
L (2)
Similarly, we would expect an“isolated”convergence feature to displayC~Clocal/L2. The shading in Figure 1c
shows the contoured frequency of occurrence ofCas a function ofLbased on the 1488 events in 4E and suggests thatCtends toward a large-scale limit atL>100 km, and thus, we assumeC
∞≈C300. The plot shows
large variability inCon scales ofL<36 km (vertical black line). This is the approximate accuracy limit of the algorithm, which is due to the hourly sampling of the winds (compared to 15 min for the precipitation), coupled to the transient or propagating nature of some of the convergence features.
We have chosen to analyze the area-average convergence,C, because this is readily related to the mean vertical velocity on a given scale, through continuity. Assuming nondivergentflow, the mean upward velocities implied in Figure 2a at 1000 m altitude would be on the order of 10 cm s 1for local convergence (360 m of ascent per hour) and 1 cm s 1(~36 m h 1) for large-scale convergence. Thesefigures tend to show that large-scale convergence is unlikely to be significant in triggering convection (although it can be significant in destabilizing the profile), but local scale convergent may trigger, or significantly erode CIN, over a few hours.
Taking into account, the upper (L= 100 km) and lower (L>36 km) length-scale bounds discussed above the following analysis is performed onCbetweenL= 36 and 100 km to compute a form of“mass-radius”fractal dimension [Gouyet1996] for the convergence structures. For each initiation, the 925 hPa convergence for each model grid square within theL= 300 km box is computed, andC300is subtracted from each of them. We
wish to compute the logarithms of the functionC(L), which cannot be done ifCfalls below 0 for someL. Since at this stage, only the shape of the convergence features is of interest, negative values ofC-C300are set to 0,
and the mean is computed at eachL(for the subsequent analysis in section 5, the fullfield ofC, retaining negative values, is used). For spatially distributed convergence,C-C300is nearly constant with increasingL,
while for linear features,C-C300decreases with increasingL, as in the examples given above. DefiningGto be
the gradient of log(C-C300) against log(L) betweenL= 36 and 100 km, we can define a dimension,D, of the
convergence pattern in each initiation case by
D¼Gþ2: (3)
Localized features have a dimension,D, close to 0, linear features have a dimension close to 1, and features with spatially distributed convergence spread over an area have values of dimension close to 2. This is well illustrated by the two examples in Figure 1d; the gradient of example (a) (solid black line) betweenL= 36 and 100 km is 0.16, so thatD= 1.84, and the gradient of example (b) (dashed black line) is 0.95, so thatD= 1.05. A number of initiations are associated with values ofD>2, which represent cases where there are strong convergence features at larger distances away from the initiation point, so that the area-mean convergence increases withL.
0 1 2 3 4
0 0.05 0.1 0.15 0.2 0.25
Rel. Freq.
D
(a) 12P
12E 4E 1.5E
−900 0 90 180 270 360
0.05 0.1 0.15 0.2 0.25
Angle(°)
(b)
[image:5.612.213.538.92.212.2]Line orientation Wind orientation Angle difference
Figure 2.Relative frequency of (a) dimension,D, for each of the four model configurations; (b) the orientation of the mean wind for initiations associated with convergence lines (dashed line), the orientation of the convergence lines themselves (solid line), and the difference in angle between the two (dash-dotted line). Negative differences mean the wind is clock-wise of the line, and positive differences mean the wind is counterclockclock-wise of the line. Figure 2b is for the 4E only.
4. Shape and Orientation of Convergence Features
The shape of convergence features associated with initiations of deep convection is shown by the relative frequency of dimension,D, for each model configuration (Figure 2a). The median value ofDfor all the three simulations, where the convective parameterization is not used, is between 1.3 and 1.4, which suggests that more initiations occur due to one-dimensional (D= 1) linear-shaped convergence patterns than for distributed (D= 2) features. The median for 12P is 1.74, suggesting that 12P has more spatially distributed cases and fewer linear features. The differences between 12P and the simulations without convective parameterization are not unexpected, since the trigger mechanism in the convective parameterization in the MetUM does not have a convergence dependency, and it is less able to form the organized mesoscale convective systems that occur in reality and that are reproduced by the explicit configurations [e.g.,Pearson et al., 2013]. There are almost no instances of convective initiations over isolated features, for whichD= 0. Although a few isolated convergence features could be identified, these are typically weak, and the presence of larger convergence events in their neighborhood tended to giveD>0.
The remainder of this section focuses on the orientation of convergence lines, with respect to the mean wind, shown only for 4E. Initiations associated with linear features are identified usingD= 1 ± 0.4; 709 linear cases were identified out of a possible 1488 (48%), with similar results for 12E (51%) and 1.5E (46%) and a lower value of 27% for 12P. The lines produced by the model are similar in size and orientation to lines observed by radar near Niamey, Niger, byDione et al. [2013] and in many cases appear to be related to areas of raised orography (not shown). The orientation of the convergence lines is derived from theL= 300 km convergence
field; for each initiation, all the divergent parts of thefield are set to 0, and then the mean convergence is found for lines of every orientation between north-south and west-east, at an interval of 5°. The orientation of the convergence line is then identified by the rotated line with the largest mean convergence. Note that, for example, a west-east orientated line is equivalent to an east-west orientated line, so the value of the orientation can only be between 180 and 360°. The orientation of the line in Figure 1b is identified as 240°, i.e., close to a southwest-northeast direction.
Figure 2b shows the relative frequency of the convergence line orientations for 4E (solid line). The vast majority of the cases involve convergence lines that are orientated in approximately a west-east direction (with variability between southwest-northeast and northwest-southeast, 225–315°). The mean wind directions are converted to a wind orientation for direct comparison with the line orientation (dashed line, Figure 2b), and the difference between the two angles is shown by the dot-dashed line in Figure 2b, where negative (positive) differences represent cases where the wind is clockwise (anticlockwise) of the
convergence line. The majority of the cases fall between 45 and +45°, illustrating that most of the lines form along the mean wind, rather than perpendicular to it, and with no particular preference to be to the left or right of the wind at this level. The example in Figure 1b is representative of this: the southwest-northeast orientated convergence line forms in a mean southwesterly wind, immediately downstream of a region of elevated terrain with hill tops approximately 450 m above mean sea level (not shown). This result is consistent with Figure 1c inTaylor et al. [2013], who used the same 4E Cascade to show that the convergence associated with the storm initiations is on average linear and oriented along the mean wind.
5. Large-Scale Convergence
Many GCMs used for climate science currently have horizontal grid spacings of an order 100 km and thus cannot resolve convergence at the local (C60or less) scale. Convective parameterization at these scales only
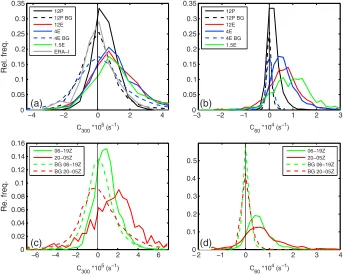
has knowledge of the large-scale (grid box average or aggregate) quantities. Although the current convective parameterization in the MetUM does not have a convergence or vertical velocity dependency, other schemes, such as that byKain and Fritsch[1993], do, which allows a more physical representation of convection [Bechtold et al., 2004]. For future development, it is necessary to know under what large-scale conditions convective storms are initiated. Figures 3a and 3b show the relative frequencies ofCat the 300 and 60 km scales that are associated with initiations. For comparison, the backgroundCis shown for 12P and 4E (12E and 1.5E have a very similar distribution to 4E). Parameterizations 12E, 4E, and 1.5E have a similar distribution ofC300, with 83% of initiations occurring in large-scale convergence and 17% of cases occurring
is consistent with the observational study byDavies et al. [2013]. The local scale convergence is much stronger in all of the three convection-permitting simulations (note different axis scales in Figures 3a and 3b), and less than 10% of the initiations occur in divergence.
The relationship between initiation and large-scale convergence is different in 12P, compared with the explicit run. Although a similar proportion of cases initiate in large-scale convergence (~80%), the magnitude of the convergence associated with the initiations is much weaker (Figure 3a). This is not only due to the weaker 12P background values (black dashed line) but also because the convection scheme does not respond to the convergence as the convection-permitting simulations do. The ratio of the probability density functions of backgroundC300convergence andC300for initiations is very different for parameterized and
explicit, particularly for the large values of convergence. The lack of response to the convergence is more apparent when comparing to the local scale convergence (C60; Figure 3b), where the tails of the 12E, 4E, and
1.5E simulations extend to an order of magnitude greater than their background, whereas the tail of 12P only extends twice the values of its background.
In addition to the Cascade model simulations, the equivalentC300analysis was performed using observed
initiations derived from satellite data byTaylor et al. [2011] and ERA-Interim winds (grey line, Figure 3a) for June–September 2006. The line is centered almost exactly overC300= 0 s 1, which illustrates that observed
storms are not preferentially associated with large-scale convergence in ERA-Interim. There can be a number of explanations for this behavior, including the failure of analyses to capture the convergence even on these scales [e.g.,Birch et al., 2013] and known biases in the location and diurnal cycle of ERA-Interim rainfall (common in GCMs) [e.g.,Meynadier et al., 2010], and the results do suggest very strongly, in agreement with
Davies et al. [2013], that large-scale convergence from a numerical weather prediction model should not be used as a predictive tool for tropical rainfall.
Figures 3c and 3d show large and local scale convergence from the 4E split into day and nighttime cases, along with the background values. At local scales (C60), there is little dependency on the time of day,
indicating that the same magnitude of local convergence is associated with the initiation of deep convection
−4 −2 0 2 4
0 0.05 0.1 0.15 0.2 0.25 0.3 0.35 Rel. freq. (a) 12P 12P BG 12E 4E 4E BG 1.5E ERA−I
−3 −2 −1 0 1 2 3
0 0.05 0.1 0.15 0.2 0.25 0.3 0.35 (b) 12P 12P BG 12E 4E 4E BG 1.5E
−6 −4 −2 0 2 4 6
0 0.02 0.04 0.06 0.08 0.1 0.12 0.14 0.16 Re. freq. (c) 06−19Z 20−05Z BG 06−19Z BG 20−05Z
−2 −1 0 1 2 3 4
[image:7.612.202.545.91.366.2]0 0.1 0.2 0.3 0.4 0.5 (d) 06−19Z 20−05Z BG 06−19Z BG 20−05Z
Figure 3.(a) The relative frequency of large-scale convergence (C300) for the four Cascade simulations (solid lines), the equivalent using initiations derived from satellite observations and ERA-Interim winds (grey solid line), and the background convergence for 12P and 4E (black and blue dashed lines). (b) The same as Figure 3a except for local scale convergence (C60). (c) and (d) The relative frequency ofC300andC60split by the time of day for 4E.
during the night and day. At large scales (C300), however, there is a much stronger diurnal dependency; at
night the magnitude of both the background convergence and divergence is larger, which can be
understood in terms of the tendency of synoptic and mesoscale circulations to intensify when the convective boundary layer mixing becomes small after sunset [Parker et al., 2005]. The ratio between the background and initiation lines is smaller during the day than at night, indicating that at night, larger magnitudes of convergence are necessary to break through the stable nocturnal boundary layer.
6. Summary and Conclusions
Where and when weather and climate models trigger deep convection is key for the correct representation of tropical convection and thus regional water cycles and monsoon circulations. Serious model biases originate from current methods of convective parameterization [e.g.,Marsham et al., 2013;Birch et al., 2014]. This study uses large domain, convection-permitting simulations at 1.5, 4, and 12 km grid spacings to quantify the scales and structures of low-level mesoscale convergence, contributing to the initiation of convection over West Africa in summer and to compare with a model simulation with parameterized convection. The large domain, 40 day simulations allow a statistical analysis of more than 1000 storm initiations.
An analysis of the fractal dimension of convergence features is used to separate linear convergence features from other sources of convective initiation. The three convection-permitting simulations behave in a similar way, with 45–50% of initiations related to convergence lines, similar in size and shape to those observed byDione et al. [2013], and the vast majority of the lines orientated along (within ±45° of) the mean wind rather than perpendicular to it. In the convection-permitting simulations, approximately 90% of the cases occur within local convergence, and more than 80% of the cases occur in large-scale convergence. At night, convergence and divergence intensify as theflow responds to the reduction in drag from boundary layer convection [Parker et al., 2005] and convection is initiated in this convergence, which also likely sustains nocturnal convection [Crook and Moncrieff, 1988].
The simulation with the standard convection parameterization shows different behavior in the distribution of the fractal dimension of convergence, with fewer initiations atD<1.5 (34% in 12P, compared with 60% in 12E). Compared to the convection-permitting simulations, a similar fraction of the initiations occur in convergence/divergence, but the magnitude of the convergence is much weaker in 12P, and the parameterized convection responds differently to the convergence the model produces, being less responsive to strong convergence. This is perhaps not a surprise given that the convection parameterization scheme in the MetUM has no explicit vertical velocity or convergence dependence.
Given the long-standing understanding of the relationship of convergence to convective initiation, these results do illustrate a fundamental problem in the way in which convective parameterization schemes initiate convection. It is conceivable that this problem may be corrected by a better relationship between the thermodynamic profile (which is modified by large-scale convergence) and convection, but it is more likely that future parameterizations will have to take account of the convergence-triggering relationship in order to capture the location and timing of convection accurately in relation to larger-scale dynamics and other parts of the climate system such as the land surface. Without improvement, these errors will continue to cause major biases in the tropics. The Cascade simulations offer a framework to evaluate the convergence-triggering relationships in different environments, which can be used as a tool to evaluate the performance of convective parameterizations in future.
References
Arakawa, A., J.-H. Jung, and C.-M. Wu (2011), Toward unification of the multiscale modelling of the atmosphere,Atmos. Phys. Chem.,11, 3731–3742, doi:10.5194/acp-11-3731-2011.
Bechtold, P., J.-P. Chaboureau, A. Beljaars, A. K. Betts, M. Köhler, M. Miller, and J.-L. Redelsperger (2004), The simulation of the diurnal cycle of convective precipitation over land in a global model,Q. J. R. Meteorol. Soc.,130, 3119–3137, doi:10.1256/qj.03.103.
Birch, C. E., D. J. Parker, A. O’Leary, J. H. Marsham, C. M. Taylor, P. P. Harris, and G. M. S. Lister (2013), Impact of soil moisture and convectively generated waves on the initiation of a West African mesoscale convective system,Q. J. R. Meteorol. Soc.,139, 1712–1720, doi:10.1002/qj.2062.
Birch, C. E., D. J. Parker, J. H. Marsham, D. Copsey, and L. Garcia-Carreras (2014), A seamless assessment of the role of convection in the water cycle of the West African Monsoon,J. Geophys. Res. Atmos.,119, 2890–2912, doi:10.1002/2013JD020887.
Crook, N. A., and M. W. Moncrieff (1988), The effect of large-scale convergence on the generation and maintenance of deep moist convection,J. Atmos. Sci.,45, 3606–3624. [Available at http://journals.ametsoc.org/doi/abs/10.1175/1520-0469%281988%29045% 3C3606%3ATEOLSC%3E2.0.CO%3B2.]
Acknowledgments
Access to the data sets used in this study is available from the corresponding author. The authors would like to thank Grenville Lister from Computer Modelling Support at the National Centre for Atmospheric Science for running the simulations. This work made use of the facilities of HECToR and the UK’s national high-performance computing service, which is provided by UoE HPCx Ltd. at the University of Edinburgh, Cray Inc., and NAG Ltd., and funded by the Office of Science and Technology through the EPSRC’s High End Computing Programme. The work under-taken by C.E.B. is an output from a project funded by the UK Department for International Development (DFID) for the benefit of developing countries. The views expressed are not necessarily those of DFID. The work is based on results from the NERC-funded AMMA (NE/G018499/1) and Cascade projects (NE/E003826/1). The authors would like to thank Karsten Peters and Ben Shipway for their helpful com-ments. Thank you to Mitch Moncrieff and a second anonymous reviewer for their helpful comments.
Davies, L., C. Jakob, P. May, V. V. Kumar, and S. Xie (2013), Relationships between the large-scale atmosphere and the small-scale convective state for Darwin, Australia,J. Geophys. Res. Atmos.,118, 11,534–11,545, doi:10.1002/jgrd.50645.
Dione, C., M. Lothon, D. Badiane, B. Campistron, F. Couvreu, F. Guichard, and S. M. Sall (2013), Phenomenology of Sahelian convection observed in Niamey during the early monsoon,Q. J. R. Meteorol. Soc.,140, 500–516, doi:10.1002/qj.2149.
Garcia-Carreras, L., D. J. Parker, and J. H. Marsham (2011), What is the mechanism for the modification of convective cloud distributions by land surface-inducedflows?,J. Atmos. Sci.,68, 619–634.
Gouyet, J.-F. (1996),Physics and Fractal Structures, 234 pp., Masson, Paris, ISBN:2-225-85130-1.
Gregory, D., and P. R. Rowntree (1990), A massflux convection scheme with representation of cloud ensemble characteristics and stability dependent closure,Mon. Weather Rev.,118, 1483–1506.
Heinold, B., P. Knippertz, J. H. Marsham, S. Fiedler, N. S. Dixon, K. Schepanski, B. Laurent, and I. Tegen (2013), The role of deep convection and nocturnal low-level jets for dust emission in summertime West Africa: Estimates from convection-permitting simulations,J. Geophys. Res. Atmos., 118, 4385–4400, doi:10.1002/jgrd.50402.
Kain, J. S., and J. M. Fritsch (1992), The role of convective“trigger function”in numerical forecasts of mesoscale convective systems,Meteorol. Atmos. Phys.,49, 93–106.
Kain, J. S., and J. M. Fritsch (1993), Convective parameterization for mesoscale models: The Kain-Fritsch Scheme,Meteorol. Monogr.,46, 165–170.
Marsham, J. H., N. Dixon, L. Garcia-Carreras, G. M. S. Lister, D. J. Parker, P. Knippertz, and C. E. Birch (2013), The role of moist convection in the West African monsoon system–Insights from continental-scale convection-permitting simulations,Geophys. Res. Lett.,40, 1843–1849, doi:10.1002/grl.50347.
Meynadier, R., O. Bock, S. Gervois, F. Guichard, J.-L. Redelsperger, A. Agusti-Panareda, and A. Beljaars (2010), West African Monsoon water cycle: 2. Assessment of numerical weather prediction water budgets,J. Geophys. Res.,115, D19107, doi:10.1029/2010JD013919. Parker, D. J., R. R. Burton, A. Diongue-Niang, R. J. Ellis, M. Felton, C. M. Taylor, C. D. Thorncroft, P. Bessemoulin, and A. M. Tompkins (2005),
The diurnal cycle of the West African monsoon circulation,Q. J. R. Meteorol. Soc.,131, 2839–2860.
Pearson, K. J., G. M. S. Lister, C. E. Birch, R. P. Allan, R. J. Hogan, and S. J. Woolnough (2013), Modelling the diurnal cycle of tropical convection across the "Grey Zone",Q. J. R. Meteorol. Soc., doi:10.1002/qj.2145.
Pielke, R. (2001), Influence of the spatial distribution of vegetation and soils on the prediction of cumulus convective rainfall,Rev. Geophys., 39, 151–177, doi:10.1029/1999RG000072.
Stephens, G. L., T. L’Ecuyer, R. Forbes, A. Gettlemen, J.-C. Golaz, A. Bodas-Salcedo, K. Suzuki, P. Gabriel, and J. Haynes (2010), Dreary state of precipitation in global models,J. Geophys. Res.,115, D24211, doi:10.1029/2010JD014532.
Taylor, C. M., A. Gounou, F. Guichard, P. P. Harris, R. J. Ellis, F. Couvreux, and M. De Kauwe (2011), Frequency of Sahelian storm initiation enhanced over mesoscale soil-moisture patterns,Nat. Geosci.,4, 430–433, doi:10.1038/ngeo1173.
Taylor, C. M., C. E. Birch, D. J. Parker, N. Dixon, F. Guichard, G. Nikulin, and G. M. S. Lister (2013), Modeling soil moisture-precipitation feedback in the Sahel: Importance of spatial scale versus convective parameterisation,Geophys. Res. Lett.,40, 6213–6218, doi:10.1002/2013GL058511. Walters, D. N., et al. (2014), The Met Office Model Global Atmosphere 4.0 and JULES Global Land 4.0 configurations,Geosci. Model Dev.,7,
361–386, doi:10.5194/gmd-7-361-2014.