The Effect of Electrolyte Additives on the Performance
of Iron Based Anodes for NiFe Cells
Jorge Omar Gil Posadazand Peter J. Hall
Chemical and Biological Engineering, University of Sheffield, Sir Robert Hadfield Building, Sheffield S1 3JD, United Kingdom
Aqueous electrolyte formulations for NiFe cells were prepared by using lithium hydroxide and potassium sulfide additives. The incidence of each additive on the overall performance of the NiFe cell was evaluated by cycling our in-house built bismuth sulfide based iron electrodes against commercially available nickel electrodes. In order to explore the composition space relevant to our formulations, a 12 replicates 3×4 full factorial experimental design was proposed to efficiently investigate the combined effect of both additives. Our experimental results suggest potassium sulfide enhances the performance of the battery. The role of lithium hydroxide is less clear but the evidence supports that it would increase coulombic efficiency to a lesser degree than potassium sulfide. This article demonstrates that by using a relatively simple manufacturing technique and low cost materials, it is possible to develop cost effective solutions to store large amounts of energy coming from renewables.
© The Author(s) 2015. Published by ECS. This is an open access article distributed under the terms of the Creative Commons Attribution 4.0 License (CC BY,http://creativecommons.org/licenses/by/4.0/), which permits unrestricted reuse of the work in any medium, provided the original work is properly cited. [DOI:10.1149/2.0451510jes] All rights reserved.
Manuscript submitted May 12, 2015; revised manuscript received July 7, 2015. Published July 28, 2015.
There is a growing demand of energy from renewable sources;1–6
however, temporary energy profiles and the availability of sun light restrict the use of such sources. Therefore, energy storage emerges as the natural solution to the asynchronous problem between energy gen-eration and demand.7,8There are many forms of energy storage
(com-pressed air, hydroelectricity, electrochemical energy storage, etc.) with the potential to store grid amounts of energy coming from renewables. However, any practical solution must be efficient, safe, environmen-tally friendly and cost effective.
It is well known that organic electrolyte based batteries exhibit much larger energy and power density than their conventional aque-ous based counterparts. Therefore, non-aqueaque-ous batteries has become the industry standard for most mobile applications (portable comput-ers, smart telephones, etc.). Due to the flammable nature of organic solvents, safety measurements are of overriding importance when dealing with such applications. Implementing safety measurements to protect your laptop’s battery is one thing, but securing energy for a much larger application, such as an airport, is a completely different story; in this case, the implementation of safety systems would be very challenging and expensive as well. This is no longer the case with aqueous batteries, where the electrolyte itself would reduce the risk of fire. In addition, the abundance and lower cost of raw materials required to produce aqueous batteries is another important aspect to consider.
Essentially, NiFe cells are secondary batteries which utilize iron based anodes, nickel based cathodes and concentrated solutions of KOH as electrolyte systems. This technology felt out of favor with the advent of cheaper lead-acid cells; however, there is a renewed interest on these batteries arising from their environmentally friendli-ness, longevity, and tolerance to electrical abuse (such as overcharge, over-discharge, not being used for extended periods and short-circuit conditions) and compatibility with photo-voltaics PV’s.9–11 In fact,
energy experts believe aqueous NiFe cell technology could provide a low cost solution for large scale energy storage in applications where relatively low specific energy (in the order of 30–50 Wh/kg) is required.12
Iron is not only relatively easy to shape into different forms, but it is also the fourth most abundant element in the Earth’s crust; likewise, the liquid core of the Earth is thought to be essentially composed of iron.13,14Nickel, on the other hand, is less abundant than iron, but it is
believed to be the second most abundant element in the Earth’s core after iron, and there are still large deposits of nickel ore that can be found in many countries such as Brazil, Russia, Philipines, Canada, Australia, Indonesia, etc.15,16Bismuth, the heaviest stable element on
zE-mail:[email protected];[email protected]
the periodic table, is not really abundant as it ranks 64thin the list;17,18
however, only small amounts of this element are required to build NiFe cells. So there are no good reasons to believe a shortage of any of the aforementioned elements would put their prices up any time soon.
Unfortunately there are still many obstacles preventing a large scale utilization of these cells, such as considerable evolution of hy-drogen, relatively low efficiency, low energy and power densities.9,19
From these problems, the evolution of hydrogen is probably the most important, for it lowers the overall cell performance by diverting part of the energy to be stored in decomposing the electrolyte. Therefore, we have utilized our in-house built Bi2S3/Fe based anodes to test
dif-ferent electrolyte systems, so this problem would be mitigated and the overall cell performance would be enhanced.
Basically, from the anode point of view, the main process taking place during the charging of a NiFe cell is the reduction of iron (II) to iron (0); as expected, the opposite reaction would take place during the discharging process. Eq.1illustrates the charging (forward reaction) and discharging (backward reaction) processes of an iron electrode under strong alkaline conditions.19,20
F e(O H)2+2e−↔F e+2O H− E0= −0.87 V [1]
Unfortunately, during the charging of the iron electrode, water is decomposed on its surface. As a consequence, part of the energy that is intended to be stored in the battery ended up wasted in the production of hydrogen. The net effect is a drastic reduction in the overall coulombic efficiency of the NiFe cell, as indicated by Eq.2.
2H2O+2e−↔H2+2O H− E0= −0.83 V [2]
Many attempts have been made in order to suppress or at least to reduce the extent to which water is decomposed through Eq. 2. Undoubtedly, the development of sulfur based iron electrode formu-lations is one of the most promising alternatives.21,22However, the
performance of the NiFe cell can also be improved by optimizing the electrolyte composition; in fact, different electrolyte additives such as wetting agents,23long chain thiols,24organic acids,25 among others
have been investigated.
Reaching staggering capacities of nearly 800 mAh g−1, high
per-formance NiFe cells have been reported;26,27however, the production
of such cells requires not only ultrapure reactants but also nano-structuring techniques. These aspects would have a major incidence in the final price of a commercial battery.26,27With this in mind, we
have decided to investigate the full potential of NiFe cells a cost effective solution for off-grid energy storage.22,28
In our previous publication,22we used a multivariate approach to
bismuth, as represented by Eq.3, and its supposed capability of in-creasing the energy barrier for water decomposition under alkaline conditions.27
Bi2S3+6e−↔Bi+3S− E0= −0.818 [3]
Where the forward reaction takes place during the charging process of the iron electrode; likewise, the backward reaction represents the discharging process.
Here, we use an experimental design approach to efficiently in-vestigate the incidence of lithium hydroxide and potassium sulfide as electrolyte additives to further increase the energy barrier for water decomposition, which in turn will increase the overall performance of the NiFe cell. The electrodes we used were commercially avail-able nickel cathodes and our in-house Fe/Bi2S3anodes under strong
alkaline conditions. The production details of these electrodes can be found elsewhere.22This work is a continuation of our research on
battery technology, where we achieved cost effective electrode formu-lations rendering NiFe cells with coulombic efficiencies in the order of 44%.22,28Herein we illustrate how to improve NiFe cells by
elec-trolyte modification, and in fact, this manuscript reveals an increase in battery performance of almost 20% (compared with our previous formulations) is possible by tailoring the electrolyte.
Experimental
Iron electrodes were produced by coating strips of nickel foam with an iron active paste which consists of varying amounts of iron powder (note that iron powder is denoted here as the “electroactive material”) with a mixture of PTFE (acting as a binder) and bismuth sulfide. The chemicals and materials used to develop iron electrode formulations were of the following specifications.
r
Iron powder (purity 99.5%,<10μm) from Alfa Aesarr
Bismuth sulfide (purity 99.5%,<5μm) from Sigma Aldrichr
PTFE (Teflon 30-N, 59.95% solids) from Alfa Aesarr
Nickel foam (purity 99.0%, density 350 g/m2) from SigmaAldrich
Broadly speaking, strips of nickel foam (10 mm ×40 mm × 1.8 mm) were dip coated with an iron rich electroactive paste (con-sisting of varying amounts of Fe, Bi2S3 and PTFE); the electrodes
thus produced were then vacuum dried for at least 5 hours until a constant amount of electroactive material (iron) was loaded onto the electrode; this coating process was repeated until approximately 0.2– 0.25 g of iron powder were loaded on an area of approximately 1 cm2.
When the process was finished, the electrodes were vacuum dried for another day to ensure consistency. More experimental details can be found elsewhere.22,28Iron electrodes of the following characteristics
were thus produced: 4% Bi2S3+9%PTFE+87%Fe.
We have recently investigated the role of certain electrode addi-tives (such as potassium sulfide, bismuth sulfide, elemental bismuth and iron sulfide) in the performance of the iron electrode.22,28
How-ever, in order to improve the performance of the iron electrode, we must consider the effect of electrolyte additives as well. With this in mind, we decided to investigate NiFe electrolyte systems using lithium hydroxide and potassium sulfide as additives. The specifica-tions of the chemicals and materials used to produce the electrolyte solutions were as follows:
r
Potassium hydroxide (purity ≥ 85.0%, pellets) from Sigma Aldrichr
Potassium sulfide (purity≥99.5%) from Sigma Aldrichr
Lithium hydroxide (purity≥98.0%) from Sigma Aldrich [image:2.585.315.535.540.737.2]In house deionized water was produced by using an Elix 10-Milli-Q Plus water purification system (Millipore, Eschborn, Germany). Basically, varying amounts of potassium hydroxide, potassium sul-fide and lithium hydroxide were dissolved in our in-house produced deionized water.
Table I. Range of concentrations.
Additive Low (M) High (M)
LiOH 0 0.3
K2S 0 0.6
Table II. Experimental definition of factors and levels.
LiOH (0–0.3M)
K2S (0–0.6M) L1 L2 L3
L1 (0.0, 0.0) (0.0, 0.15) (0.0, 0.3)
L2 (0.2, 0.0) (0.2, 0.15) (0.2, 0.3)
L3 (0.4, 0.0) (0.4, 0.15) (0.4, 0.3)
L4 (0.6, 0.0) (0.6, 0.15) (0.6, 0.3)
In order to investigate electrolyte additives on cell performance, electrolyte systems based upon TableIwere produced.
Basically, we are not interested in exploring the effect of potassium hydroxide on the electrolyte system, what we are trying to achieve is to rationalize the incidence of minor electrolyte components in the over-all performance of the battery; therefore, we have kept the composition of potassium hydroxide at a constant value of 28.5% (approximately 5.0 M). Based on the constancy of KOH and on TableI, a 3×4 full factorial design was proposed to investigate the combined effect of potassium sulfide and lithium hydroxide as electrolyte components for NiFe cells. The final definition of factors and levels for this experiment is shown in TableII.
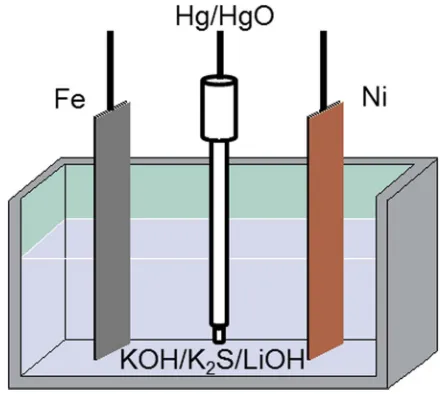
The electrolyte formulations appearing in Table II were tested on a three electrode cell. In-house produced bismuth sulfide based iron electrodes were tested in a three-electrode cell (total cell volume 0.1 L). Commercially available nickel electrodes (18 mm×70 mm ×3 mm) were used as the positive terminal of the cell. All potentials were measured against a mercury/mercury oxide (Hg/HgO) reference electrode (E0
Hg/HgO= +0.098 V vs. NHE). Experiments of charge and discharge were performed on a 64 channel Arbin SCTS. Fig.1
provides a sketch of the cell test configuration.
Experiments of charge and discharge were conducted under gal-vanostatic conditions at room temperature until the steady state was reached. Cells were cycled from 0.6 to 1.4 V vs. MMO at a C/5 rate as indicated in Fig.2. Formation and stabilization of the electrodes were found to be complete by the 50thcycle of charge and discharge.
More experimental details can be found elsewhere.22,28
Figure 2. Charge and discharge cell testing (vs. Hg/HgO).
Cyclic voltammetry was conducted on an 8 channel Solartron 1470E/1455A potentiostat/galvanostat with frequency response ana-lyzers. The electrochemical measurements were made using a con-ventional three-electrode glass cell. Measurements were carried out at 25◦C, by using a Hg/HgO reference electrode, a platinum wire as a counter electrode and a concentrated solution of KOH as electrolyte.
Results and Discussion
It is well known that any NiFe cell requires a relatively long con-ditioning period (usually the less than the first 30 cycles of charge and discharge) before it develops its full potential as an energy storage device. Fig.2confirms this observation, note how the overall perfor-mance of selected batteries increases from nearly zero (in the early cycles of charge-discharge) up to more than 60%.
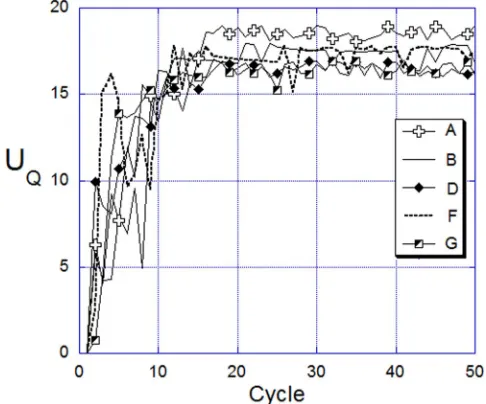
When looking at the utilization of electroactive material, a similar behavior can be found. There is an initial period where the cells develop their potential as an energy storage device. Although, there is considerable scattering, it seems like if the conditioning period would last for less than 30 cycles. Fig.3illustrates how the utilization of the electroactive material evolves with the cycle number. Figs.3and4
[image:3.585.57.264.69.201.2]confirm the existence of the aforementioned conditioning period. By looking at Figs.5and 6we can consolidate our conclusion that after the 30th cycle, there is good reproducibility for the curves of charge and discharge. Of course, these two figures only details the performance of a NiFe cell that utilizes as electrolyte system formu-lation F; however, the same trend has been observed for all electrolyte
Figure 3. Coulombic efficiency versus cycle number for selected electrolyte systems. For details on compositions, please refer to TableIII.
Figure 4. Utilization of the electroactive material versus cycle number for selected electrolyte systems. For details on compositions, please refer to TableIII.
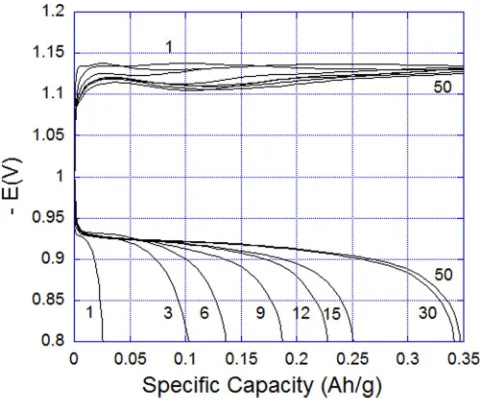
systems under consideration. Fig.6reveals a specific charge storage capacity close to 0.347 Ah g−1.
Although, very large capacities (close to 800 mAh g−1) have been
reported for nano-structured iron electrodes,26,29–31our cells reaching
almost 350 mAh g−1are worth taking seriously for we have avoided
the use of any ultra-pure reactants nor we have nano-structured the electrodes (these options would have a major impact on the final price of the battery).
TableIIIlists experimental values of coulombic efficiency calcu-lated for our electrodes in different electrolyte systems. As can be seen, the data exhibits large variability so a relatively large number of replicates (12 in this case) were required to increase the statistical force of the analysis. With this in mind, any sample whose coulombic efficiency or utilization of electroactive material lays more than two standard deviations from the mean was rejected.
[image:3.585.308.546.522.725.2]In order to determine whether a relationship existed between the factors and responses (coulombic efficiency, utilization of
[image:3.585.45.277.526.726.2]Figure 6. Selected charge and discharge curves for electrolyte system F (from TableIII) versus mercury/mercury oxide (Hg/HgO) reference electrode. The upper curves represent the charging of the electrode (cycles 1, 3, 6, 9, 12, 15, 30 and 50); likewise, the lower curves represent the discharging of the electrode for the corresponding cycles.
electroactive material and compositions of electrolyte additives), poly-nomial functions, as the one represented by Eq.4were used.
ψ=a0+a1YK+a2YK2+a3YL+a4YL2+a5YKYL [4]
Whereψrepresents the response variable, either coulombic efficiency (ηQ) or utilization of electroactive material (UQ), the a’s represent the expansion coefficients (any positive sign in front of each expansion coefficient indicates a synergistic effect; likewise, any negative sign indicates an antagonistic effect.), the Y terms represent the composi-tion of each component (in mol/L) and the subscripts K and L denote potassium sulfide and lithium hydroxide respectively.
Without intending to give a full introduction into regression anal-ysis, the use of polynomial functions (such as Tutte, Scheff´e, or any standard algebraic polynomial) are undoubtedly one of the most widely used empirical models for fitting functions. The reasons for this are many and include: simple form, continuity, computationally easy to implement, etc. Unfortunately, polynomial functions are well known for their poor interpolatory and extrapolatory properties. In general terms, the parameters of the model, this is the coefficients, can be found by using any form of regression analysis (in this case, we have used the least squares).
We will begin our analysis by using a standard linear model be-tween the response variable (coulombic efficiency and the
composi-Table III. Experimental design matrix.
Cell K2S (M) LiOH (M) ηQ(exp) uQ(exp)
A 0.0 0.0 47.6±2.4 19.4±3
B 0.0 0.15 51.3±4.0 17.6±2.8
C 0.0 0.3 54.3±2.8 14.9±2.3
D 0.2 0.0 55.8±2.9 16.0±3.5
E 0.2 0.15 59.9±2.0 17.3±2.6
F 0.2 0.3 63.5±3.6 17.7±2.5
G 0.4 0.0 60.7±3.9 16.9±3.2
H 0.4 0.15 60.0±3.3 17.0±2.5
I 0.4 0.3 63.4±3.3 18.3±3.1
J 0.6 0.0 55.7±2.2 14.1±0.6
K 0.6 0.15 58.3±1.7 15.4±3.7
[image:4.585.39.279.66.267.2]L 0.6 0.3 59.9±3.0 18.9±3.1
Figure 7. Incidence of potassium sulfide and lithium hydroxide on coulombic efficiency. The concentration of potassium sulfide is given in mol/L.
tions of the electrolyte additives:
ηQ=51.504+11.191 YK+17.708 YL [5]
It is important to highlight that we have found no evidence that any of the least squares regression assumptions are violated, so Eq.5holds. The regression analysis reveals that despite a relatively low multiple correlation coefficient (r=0.663), the model represented by Eq.5is significant (F value of 27.01), and indeed, all terms from the model are significant.
Even though the degree of linear association between variables is relatively low, due to the significance of the linear model, we could conclude that both lithium hydroxide and potassium sulfide enhance cell performance. Fig.7illustrates the use of a multi-scattering plot in visualizing how the response variable, coulombic efficiency, is affected by the factors, compositions of lithium hydroxide and potas-sium sulfide.
The bottom left part of Fig.7illustrates how coulombic efficiency is affected by changing the composition of potassium sulfide at low concentrations of lithium hydroxide; in this case, a second order as-sociation between variables can be suspected. Likewise, the bottom right and upper parts of Fig.7reveals similar information at medium and high concentrations of lithium hydroxide. By looking at the multi-scattering diagram, we can see there is a quadratic rather than linear association between the variables. A parabolic tendency could also be inferred, in which higher values of coulombic efficiency are found at intermediate concentrations of potassium sulfide, irrespective of lithium hydroxide concentration.
Now it is time to use a more sophisticated model to establish the relationship between variables. We shall include an additional interaction term so Eq.4will become:
ηQ=50.568+14.312 YK+23.950 YL−20.805 YKYL [6]
As with the previous case, the regression analysis reveals a low multiple correlation coefficient (r=0.673), the model represented by Eq.6is still significant (F value of 18.71), and all coefficients except the interaction term are significant. Therefore, we could conclude, as with the linear model, that both lithium hydroxide and potassium sulfide enhance the cell performance.
[image:4.585.37.293.611.758.2]Figure 8. Second order representation of coulombic efficiency as a function of electrolyte additives.
them has achieved more than a marginal improvement in the multiple regression coefficients.
Due to the low correlation in the previous cases, a more sophis-ticated model is still required to investigate the problem at hand. We will now consider the full model given by Eq.4, the following model was obtained:
ηQ =47.649+59.416 YK+ 20.422 YL−75.173 YK2+11.759 YL2
−20.805YKYL [7]
The regression analysis reveals that the model represented by Eq.
7is significant (F value of 58.09), the multiple correlation coefficient is relatively high (r=0.903); in addition, the only term that is not significant is the one related to the YL2. The regression analysis
per-mits to draw the very same conclusions as with the linear model. Fig.
8provides a three dimensional representation of Eq.7.
In order to find the conditions that maximize coulombic efficiency, we have use the used the fundamental theory of calculus to find station-ary values of many-variable functions. A C/C++program based on a simplex algorithm was developed to automate the process of finding the stationary values of Eq.4. The electrolyte conditions that maxi-mize coulombic efficiency were determined as [K2S]=0.44 mol/L
and [LiOH]=0.30 mol/L corresponding to a coulombic efficiency of almost 69.17%. However, NiFe cells using such electrolyte systems reach coulombic efficiencies in the order of 64.3% only (error in the order of 7.6%).
Utilization of electroactive material was explained by the compo-sition factors (K2S and LiOH content). Eq.8shows the second order
dependency between factors on response variable.
UQ=18.915−4.770 YK−13.5 YL−6.111 YK2+8.240 YL2
+45.694 YKYL [8]
Unfortunately, our experimental results show that Eq.8is of lim-ited use in describing the incidence of electrolyte additives on the response variable. In general terms, the regression coefficient and the F-statistic are both very low (in the order of 0.242 and 5.36). In addi-tion, the only term that is significant corresponds to the independent term. This would indicate that the mean (given by the independent term) could be considered representative of the entire data set. The correlation was marginally improved by using standard transforma-tions, for which the results are not shown. TableIVcompares experi-mental and predicted by the second order model values of coulombic efficiency and utilization of electroactive material.
[image:5.585.37.281.68.257.2]As was explained, the utilization of electroactive material is poorly represented by either the first or second order model, in situations like
Table IV. Coulombic efficiency and utilization of electroactive material for selected NiFe cells.
Experimental Second Order %Error (min-max)
Cell ηQ(exp) uQ(exp) ηQ(exp) uQ(exp) ηQ(exp) uQ(exp)
A 47.6±2.4 19.4±3 47.6 18.9 4.6–5.5 10.1–21.7 B 51.3±4.0 17.6±2.8 51.0 17.1 7.5–8.2 8.2–24.6 C 54.3±2.8 14.9±2.3 54.8 15.6 4.2–6.0 5.8–24.4 D 55.8±2.9 16.0±3.5 56.8 17.7 2.1–8.1 9.0–31.1 E 59.9±2.0 17.3±2.6 59.5 17.2 2.4–4.2 12.2–17.4 F 63.5±3.6 17.7±2.5 62.8 17.2 4.0–7.3 12.2–17.4 G 60.7±3.9 16.9±3.2 60.0 16.0 6.2–6.7 16.9–23.1 H 60.0±3.3 17.0±2.5 62.1 16.9 1.0–9.5 13.0–16.0 I 63.4±3.3 18.3±3.1 64.7 18.2 1.9–8.3 15.9–17.6 J 55.7±2.2 14.1±0.6 57.1 13.9 2.6–4.9 2.2–6.5 K 58.3±1.7 15.4±3.7 58.6 16.1 2.4–3.4 14.9–31.1 L 59.9±3.0 18.9±3.1 60.6 18.8 3.0–6.8 13.8–18.6
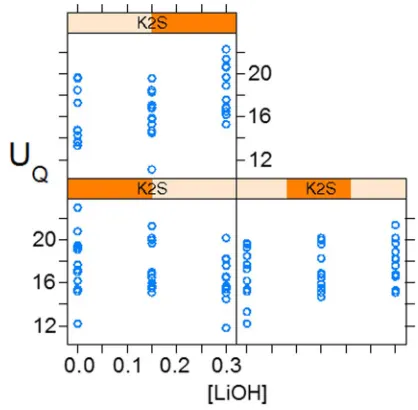
this extracting meaningful information from a three dimensional rep-resentation (surface response) is by no means trivial. Fig.9provides a better way of visualizing our data.
Fig. 9clearly indicates that there is no such a thing as a clear trend between the composition of the electrolyte and the response factor (utilization of electroactive material). At low concentrations of K2S, the utilization of electroactive material marginally decreases with
increasing the content of LiOH. Conversely, at intermediate and high concentrations of potassium sulfide, the utilization of electroactive material slightly increases with increasing the content of LiOH.
Although, we have used a relatively large number of replicates and the two standard deviation criteria for rejection was implemented, reproducibility remains as a major concern. As the methodology for producing electrolyte systems is straight forward, the origin of the variability can be traced to the production of the anodes. Reasons for such variability were already identified.22,28,32
We have recently shown that the use of low concentrations of potassium sulfide as an electrode additive only marginally effects the overall performance of the battery.22,28However, the use of potassium
sulfide at large concentrations seems to enhance the performance of the battery. This evidence persuades us to believe that at sufficiently large concentrations, the presence of the soluble bisulfide anion (HS−) is sufficient to increase the coulombic efficiency of a NiFe cell.
[image:5.585.304.550.95.245.2] [image:5.585.319.528.516.721.2]Figure 10. XRF for iron electrode after being cycled 50 times with electrolyte system F (please refer to TableIII).
The role of lithium hydroxide on the performance of the NiFe cell is less clear. From a mere graphical perspective, it is difficult to infer that the presence of this additive actually increases coulombic efficiency; however, from the regression analysis, Eq.7, it is clear that coulombic efficiency increases with the concentration of lithium hydroxide. However, the expansion coefficient associated with potas-sium sulfide is almost three times larger than the one associated with lithium hydroxide, so its incidence on battery performance is moderate-low.
As described in the experimental part, iron electrodes were pro-duced with 4% Bi2S3, the XRD of the electrodes before and after the
experiments of charge and discharge, exhibit no meaningful differ-ences. We believe that this is because the reaction between metallic iron (the electroactive material of the electrode) and the soluble bisul-phite anion is not favored. Furthermore, the utilization of the electroac-tive material is relaelectroac-tively low, so it follows there is a large amount of iron who doesn’t partake on the electrochemical process and it dom-inates the entire XRD spectrum. Fig.10shows a typical XRD trace of one of our electrodes after 50 cycles of charge and discharge. This figure confirms the presence ofα-Fe but we haven’t found any evi-dence of other polymorphs of iron (neitherβ-Fe norγ-Fe); however, we had found a very weak signal at 2θ=24◦corresponding to either
α-Fe2O3or Fe(OH)2.
Although, we have found no compelling evidence of any form of iron oxyhydroxide in our samples, it has been proposed that under alkaline conditions, Fe(III) could transform into fromβ-FeOOH and then toα-Fe2O3. Moreover, either goethite (α-FeOOH) or akaganeite
(β-FeOOH) can transform into α-Fe2O3,33,34 which means that the
signal appearing at 2θ=24◦(Fig.10) could very well be due to either of those species after transforming intoα-Fe2O3. However, this very
same signal could be related with Fe(OH)2, which can be oxidized
into either magnetite (Fe3O4), goethite, akaganeite or lepidocrocite
(γ-FeOOH),35which in turn could also transform intoα-Fe
2O3.
Mag-netite can also undergo transformation intoγ-Fe2O3 and then into α-Fe2O3.36
Although, our results confirm that battery performance is enhanced by the presence of relatively large amounts of potassium sulfide in the electrolyte, which would indicate that sulfur would play a role in the charge and discharge process of the battery, no XRD evidence of functional groups of the form Fe-S were detected on any of the samples.
[image:6.585.308.548.66.269.2]In conclusion, under our experimental conditions, we found no evidence of any reaction between potassium sulfide and either bismuth sulfide or metallic iron. However, the absence of evidence it is not
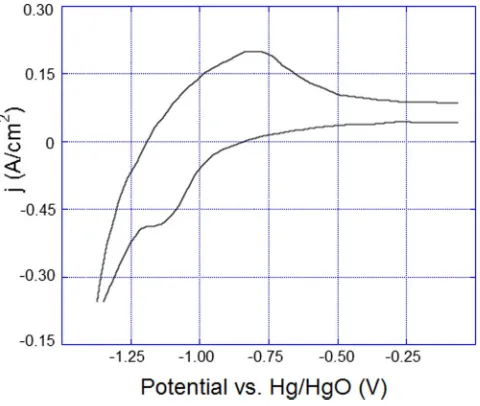
Figure 11. Triangular sweep voltammetry curves for bismuth sulfide based iron electrodes. The curves correspond to CV experiments performed in 5.1 M KOH+0.444 M K2S+0.3 M LiOH solution at a scan rate of 0.5 mV s−1.
necessarily evidence of absence, therefore, we can only conclude that our results are inconclusive and more research is still needed.
In order to investigate the electrochemical properties of the cell, cyclic voltammetry experiments were conducted under conditions that maximize coulombic efficiency; this is 5.1 M KOH+0.44 M K2S+
0.3 M LiOH. Fig.11shows a typical cyclic voltammetry experiment of a NiFe cell using the aforementioned electrolyte system.
As shown in Fig.11, there is a broad peak appearing from between −0.6 and−1.0 V which would correspond to the oxidation of iron as represented by Eq.9, the production ofδ-FeOOH as indicated by Eq.10, or to the production of Fe3O4as illustrated by Eq.11.
F e+2O H−↔F e(O H)2+2e− [9]
3F e(O H)2+O H−↔δ−F eO O H+H2O+e− [10]
3F e(O H)2+2O H−↔F e3O4+4H2O+2e− [11]
Fig.11also reveals a change of curvature at 1.12 V, which would correspond to the reduction of iron hydroxide into elemental iron as depicted by Eq.9.
It has been proposed that sulfur containing species such as bismuth sulfide and iron sulfide could improve the performance of a NiF cell by controlling the corrosion state of the iron electrode,37–39however,
the detailed mechanism is still poorly understood.40This observation
is in line with the idea that that the degree of passivation of the iron electrode is crucial to understand the evolution of hydrogen under strong alkaline conditions. Likewise, the use of potassium sulfide in the electrolyte has shown to have a positive impact in the overall performance of the battery.
It has been long recognized that the entering of hydrogen into transition metals such as iron is favored by the presence of sulfur containing compounds.41,42In fact, species such as HS−, S2−and H
2S
are common promoters of hydrogen ingress into iron.42It is our belief
that the passivation of the iron electrode is determined by its hydrogen content, for hydrogen has a real incidence in the reduction of Fe(III) to Fe(II). The passive film on the electrode would consist many different forms of iron such as magnetite, maghemite, among others.43
The adsorption of soluble HS−can be rationalized as an electro-sorptive process with charge transfer:44–46
M+H Ss−ln→M(H S−)→M Sads+2e(M)+Hs+ln [12]
Figure 12. Important processes that determine the reactivity of the iron elec-trode: Generation of new surface area (a), promotion of hydrogen ingress to the electrode by the presence of sulfur species (b), and formation of iron hydroxide (c).
right (by Le Chˆatelier’s principle). Similarly for KS−the following mechanism might occur:
M+K Ss−ln→M(K S−)→M Sads+2e(M)+Ks+ln [13]
The newly formedMSadsspecies will promote the ingress of hy-drogen into the electrode.
M Sads+2H2O+3e(M)→M Hads+H Ss−ln+2O H− [14]
It has been reported that hydrogen evolution and ingress into iron is strongly enhanced by renewal of the metal surface,44 Figs.3and 4
confirm that the performance of the iron electrode increases with the cycling number, until steady state conditions are reached.
Finally, the authors believe that a combined effect between the presence of sulfur species, not only in the electrolyte but also in the electrode itself, and the degradation of the electrode that occurs during the conditioning period is key to understand the reactivity of the iron electrode. These processes are depicted in Fig.12. These ideas are supported in part by observations that have been made during the hydrogen evolution reaction under alkaline conditions.45
Conclusions
By pursuing the development of cost effective energy storage solu-tions, we have achieved NiFe cells that render coulombic efficiencies in the order of 64%, utilization of electroactive material values close to 19% and capacities in the order of 350 mAh g−1. These results are
very promising as we have used neither ultra-pure reactants, nor we have nano-structured our electrodes (these manufacturing alternatives would certainly impact on the final price of the battery).
It was found that under our experimental conditions and at the level of confidenceα=0.05, the addition of potassium sulfide does increase cell performance. This conclusion supports the idea that the presence of the soluble bisulfide anion (HS−) has a real influence in improving the overall coulombic efficiency of the NiFe cell by mitigating the evolution of hydrogen on the iron electrode. Lithium hydroxide has proven to be less effective in mitigating hydrogen evolution than potassium sulfide.
Our experimental results suggest that at low concentrations of potassium sulfide, the utilization of electroactive material marginally decreases with increasing the content of lithium hydroxide. Con-versely, at intermediate and high concentrations of potassium sul-fide, the utilization of electroactive material slightly increases with increasing the content of lithium hydroxide. Therefore, in this case, it was not possible to find a function that properly correlates the
re-sponse variable and factors. In any case, the authors believe that more investigation is still required to further clarify the role of LiOH.
The data gathered during this project is subject to large variability; therefore, aiming to increase the statistical force of the analysis, a relatively large number of replicates (twelve in total) and the two standard deviation criteria for rejection were used.
Multi-scattering diagrams, also known as Trellis plots, provide a means to visualize the incidence of several factors on a response variable. This manuscript illustrates the usefulness of these tools in the analysis of data gathered during the characterization of relatively large numbers of half-cells.
Acknowledgments
The authors acknowledge the U.K. Engineering and Physical Sci-ences Research Council for supporting this work (EP/K000292/1; SPECIFIC Tranche 1: Buildings as Power Stations).
References
1. K. Hedegaard and P. Meibom,Renew. Energy,37, 318 (2012).
2. H. Chen, T. N. Cong, W. Yang, C. Tan, Y. Li, and Y. Ding,Progress in Natural Science,19, 291 (2009).
3. Y. Jacob,Reinforced Plastics,45, Supplement 1, 10 (2001).
4. B. Garcia, S. L. Candelaria, D. Liu, S. Sepheri, J. A. Cruz, and G. Cao,Renew. Energy,36, 1788 (2011).
5. J. Paska and T. Surma,Renew. Energy,71, 286 (2014).
6. O. Akinyele and R. K. Rayudu,Sustainable Energy Technologies and Assessments,
8, 74 (2014).
7. B. Richardson and L. D. D. Harvey,Renew. Energy,76, 432 (2015). 8. M. Delfanti, D. Falabretti, and M. Merlo,Renew. Energy,80, 61 (2015). 9. S. Chaurey and S. Deambi,Renew. Energy,2, 227 (1992).
10. S. Subburaj, B. N. Pushpakaran, and S. B. Bayne,Renew. Sust. Energ. Rev.,45, 219 (2015).
11. L. Ratnam, S. R. Weller, and C. M. Kellett,Renew. Energy,75, 123 (2015). 12. P. Gao, Y. Liu, W. Lv, R. Zhang, W. Liu, X. Bu, G. Li, and L. Lei,J. Power Sources,
265, 192 (2014).
13. L. Birch,J. Geophys. Res.,69, 4377 (1964).
14. D. Morard, J. Siebert, D. Andrault, N. Guignot, G. Garbarino, F. Guyot, and D. Antonangeli,Earth Planet. Sci. Lett.,373, 169 (2013).
15. N. Oxley and N. Barcza,Minerals Engineering,54, 2 (2013).
16. C.-L. Huang, J. Vause, H.-W. Ma, Y. Li, and C.-P. Yu,J. Clean. Prod.,84, 450 (2014). 17. K. Braunschweig, P. Cogswell, and K. Schwab,Coordin. Chem. Rev.,255, 101 (2011). 18. N. M. Leonard, L. C. Wieland, and R. S. Mohan,Tetrahedron,58, 8373 (2002). 19. G. Halpert,J. Power Sources,12, 177 (1984).
20. K. Shukla, S. Venugopalan, and B. Hariprakash,J. Power Sources,100, 125 (2001). 21. K. Manohar, C. Yang, S. Malkhandi, B. Yang, G. K. S. Prakash, and S. R. Narayanan,
J. Electrochem. Soc.,159, A2148 (2012).
22. J. O. Gil Posada and P. J. Hall,J. Power Sources,262, 263 (2014).
23. K. Manohar, C. Yang, S. Malkhandi, G. K. S. Prakash, and S. R. Narayanan, J. Electrochem. Soc.,160, A2078 (2013).
24. S. Malkhandi, B. Yang, A. K. Manohar, G. K. S. Prakash, and S. R. Narayanan, J. Am. Chem. Soc.,135, 347 (2012).
25. M. J. Mackenzie, Jr. and Alvin J. Salkind, Gas Depressor Additives For Iron Elec-trodes, Patent number US3484291 A (1969).
26. H. Wang, Y. Liang, M. Gong, Y. Li, W. Chang, T. Mefford, J. Zhou, J. Wang, T. Regier, F. Wei, and H. Dai,Nat. Commun.,3, 1 (2012).
27. K. Manohar, S. Malkhandi, B. Yang, C. Yang, G. K. S. Prakash, and S. R. Narayanan, J. Electrochem. Soc.,159, A1209 (2012).
28. J. O. Gil Posada and P. J. Hall,J. Power Sources,268, 810 (2014).
29. P. Periasamy, B. Ramesh Babu, and S. Venkatakrishna Iyer,J. Power Sources,62, 9 (1996).
30. Z. Liu, S. W. Tay, and X. Li,Chem. Commun.,47, 12473 (2011).
31. M. K. Ravikumar, T. S. Balasubramanian, and A. K. Shukla,J. Power Sources,56, 209 (1995).
32. J. O. G. Posada and P. J. Hall,Sustainable Energy Technologies and Assessments. In press
33. H. Cao, G. Wang, L. Zhang, Y. Liang, S. Zhang, and X. Zhang,ChemPhysChem,7, 1897 (2006).
34. S. Musi´c, I. Czak´o-Nagy, I. Salaj-Obeli´c, and N. Ljubeˇsi´c,Mater Lett,32, 301 (1997). 35. Hiroki Miyamoto, Teruya Shinjo, Yoshichika Bando, and T. Takada,Bulletin of the
Institute for Chemical Research, Kyoto University,45, 333 (1968).
36. B. Zhao, Y. Wang, H. Guo, J. Wang, Y. He, Z. Jiao, and M. Wu,Mater. Sci-Poland,
25, 1143 (2007).
37. V. S. Jayalakshmi, B. Nathira Begum, V. R. Chidambaram, R. Sabapathi, and V. S. Muralidharan,J. Power Sources,39, 113 (1992).
38. E. G. Lyons and L. D. Burke,Electroanal. Chem.,170, 377 (1984). 39. T. S. Balasubramanian and A. K. Shukla,J. Power Sources,41, 99 (1993). 40. P. Diez-Perez, F. Sanz, and P. Gorostiza,Electrochem. Commun.,8, 1595 (2006). 41. G. Williams, H. N. McMurray, and R. C. Newman,Electrochem. Commun.,27, 144
42. T. Flis-Kabulska, J. Flis, and T. Zakroczymski, Electrochim. Acta, 52, 7158 (2007).
43. H. B. Shao, J. M. Wang, W. C. He, J. Q. Zhang, and C. N. Cao,Electrochem. Com-mun.,7, 1429 (2005).
44. C. N. Flis-Kabulska,Electrochem. Commun.,11, 54 (2009). 45. R. Solmaz and G. Kardas¸,Electrochim. Acta,54, 3726 (2009).