This is a repository copy of A test based on panel refreshments for panel conditioning in stated utility measures.
White Rose Research Online URL for this paper: http://eprints.whiterose.ac.uk/99204/
Version: Accepted Version
Article:
Van Landeghem, B. (2014) A test based on panel refreshments for panel conditioning in stated utility measures. Economics Letters, 124 (2). pp. 236-238. ISSN 0165-1765 https://doi.org/10.1016/j.econlet.2014.05.024
© 2014 Elsevier. This is an author produced version of a paper subsequently published in Economics Letters. Uploaded in accordance with the publisher's self-archiving policy. Article available under the terms of the CC-BY-NC-ND licence
(https://creativecommons.org/licenses/by-nc-nd/4.0/)
Reuse
This article is distributed under the terms of the Creative Commons Attribution-NonCommercial-NoDerivs (CC BY-NC-ND) licence. This licence only allows you to download this work and share it with others as long as you credit the authors, but you can’t change the article in any way or use it commercially. More
information and the full terms of the licence here: https://creativecommons.org/licenses/
Takedown
If you consider content in White Rose Research Online to be in breach of UK law, please notify us by
A Test Based on Panel Refreshments for Panel
Conditioning in Stated Utility Measures
(Forthcoming in Economics Letters)
Bert Van Landeghem
University of Sheffield, Maastricht University, and IZA
[email protected]
April 2014
Abstract
Adapting a methodology proposed in Das et al. (2011), this paper uses panel refreshments as a natural experiment to determine whether trends in stated utility measures observed in panel data are genuine or rather caused by measurement issues.
Keywords: Stated Utility; Panel Attrition; Panel Conditioning; Time Trends.
1
Introduction
It is increasingly common practice in economics to use ‘stated utility’ measures, which
are derived from survey questions asking people about their satisfaction with life, income,
or health. While such measures have passed important external validity checks, in some
circumstances measurement and methodological issues need to be taken seriously when
interpreting empirical results (Benjamin et al., 2013; Conti and Pudney, 2011; Heffetz
and Rabin, 2013).
Many researchers have noticed a sharp drop in stated utility measures in the first
rounds of a commonly used panel containing such data, the German Socioeconomic
Panel. It is important to find out whether such a drop reflects a genuine decline in
stated utility in the society the dataset represents, or whether it is rather due to panel
conditioning or a panel effect, a change in the way questions measuring stated utility are
answered the more experienced one is in answering such questions. This paper aims to
help make progress in solving this puzzle inspired by an identification strategy proposed
in Das et al. (2011). The contribution of the paper is first of all empirical since it studies
a different type of data than Das et al. (2011). Second, the long time dimension of the
panel data allows us to get insights into the dynamics of panel conditioning, and to deal
more easily with the consequences of a relatively large attrition rate.
2
Data
The analysis will use panel refreshers (newcomers in the panel) as a natural experiment
to obtain identification. To ensure a higher degree of external validity, two different
nationally representative datasets are being used, the German Socioeconomic Panel
As for the German SOEP, the original West German sample started in 1984, and
the original East German sample in 1990. Comparable refreshment samples (for both
West and East) were introduced in 1998, 2000 and 2006. The Swiss Household Panel
(SHP) started in 1999 and a refreshment sample was introduced in 2004. A robustness
check with the SHP seems particularly useful since the mode of interview (telephone) is
the same across all interviews while there are several small nonrandom variations in the
face-to-face set-up in the German SOEP.
Both datasets contain an identical measure of stated utility in every round from the
first round onwards for the German SOEP, and the second round onwards for the SHP,
which is derived from the following survey question:
“On a scale from 0 (completely dissatisfied) to 10 (completely satisfied): How
satisfied are you with your life, all things considered?”
In addition to refreshers stemming from the introduction of a refreshment sample
(“induced refreshers”), a second group of “natural refreshers” enter steadily each year,
and can stem from three sources. First, members from interviewed households will
reach the eligible age to enter the panel. Second, if a new member eligible for the survey
moves into the household, the enumerator will attempt to interview this new member
as well. Third, if a household member leaves the household, the aim is to follow the
respondent and, at the same time, try to interview other members eligible for the survey
in that person’s new household. Generally, first-time respondents not stemming from a
refreshment sample account for around 3% of the respondents.
3
Estimation and Results
Das et al. (2011) illustrate with dichotomous variables that one can still calculate upper
to be made. In this context, however, bounds seem not informative due to the much
larger scale of the dependent variable and due to a relatively high attrition rate. Many
strategies are available that will, under different identifying assumptions, lead to point
estimates. In this case, since the datasets used in this paper have refreshment samples
introduced well before the last calendar year for which data are available, one can restrict
the newcomers to those who will stay in the panel for several additional years to make
the two samples more comparable and to obtain insights in the sign of the attrition bias.
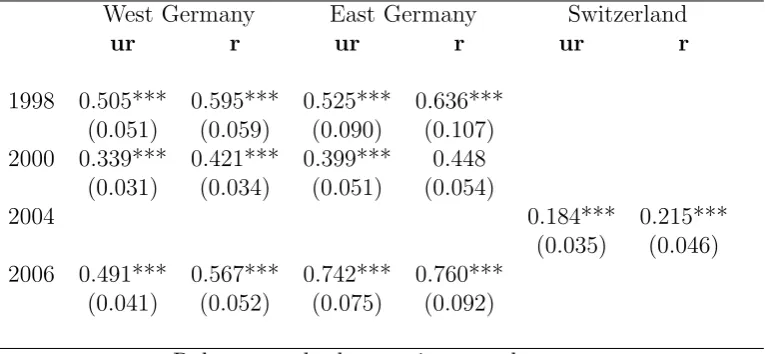
Columns 1, 3, and 5 in Table 1, show average differences between new respondents
and more experienced respondents for each calendar year in which a refreshment sample
was introduced. The other three columns show a replication of this analysis when
restricting the sample of newcomers to those who will at least stay for three additional
consecutive years. To make first-time respondents and more experienced respondents as
comparable as possible, the differences are conditional on socioeconomic variables that
are likely not to be prone to panel conditioning themselves. One important covariate is
a dummy taking one if the respondent entered the panel as a natural refresher, since the
latter entered the panel through a different sampling procedure than the others.
In all cases, scores in the calendar year in which a refreshment sample is started
are statistically and substantially higher for the refreshment sample than for the more
experienced sample. When the correction for attrition biases is applied, the results are
even more pronounced. The strategy to correct for attrition will, however, only lead us
to correct conclusions about the sign of the attrition bias if the attrition processes in
the first years of the panel are similar for the different samples, or if at least the sign
of the attrition bias for the stated utility measure is similar for the different samples.
This is investigated by running pooled OLS regressions for each of the samples, with
stated utility as the dependent variable, and a selectivity dummy, a set of controls and
time dummies as independent variables. Following Kapteyn et al. (2005), the selectivity
Table 1: Conditional Differences in Stated utility Between New Respondents and More Experienced Respondents for Years with Substantial Panel Refreshments
West Germany East Germany Switzerland
ur r ur r ur r
1998 0.505*** 0.595*** 0.525*** 0.636***
(0.051) (0.059) (0.090) (0.107)
2000 0.339*** 0.421*** 0.399*** 0.448
(0.031) (0.034) (0.051) (0.054)
2004 0.184*** 0.215***
(0.035) (0.046)
2006 0.491*** 0.567*** 0.742*** 0.760***
(0.041) (0.052) (0.075) (0.092)
Robust standard errors in parentheses
*** p<0.01, ** p<0.05, * p<0.1
Source: German Socioeconomic Panel and Swiss Household Panel.
ur = unrestricted, and r = restricted, which means that the newcomers are restricted
panel, and 0 otherwise. The coefficients on the selectivity dummies can inform us about
the sign of the bias caused by attrition, if we are willing to make the assumption which
Das et al. (2011) call “stationary attrition bias”: the difference of stated utility between
the entire population and those who will not drop out remains stable over time. The
regression results (available upon request) show substantial and positive coefficients on
all the selectivity dummies, which are significant at conventional significance levels in
all but one of the samples.
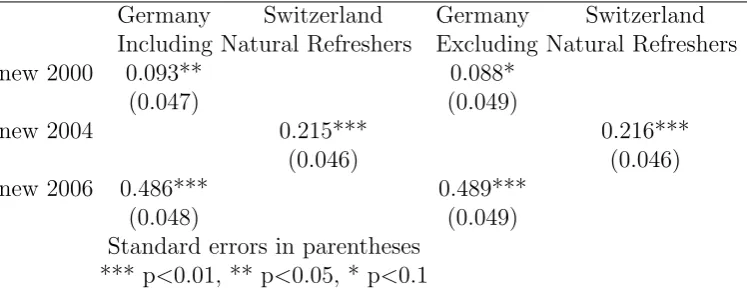
There might be remaining concerns that the results are driven by the natural
refresh-ers that have been continuously entering the panel, and that adding a dummy to control
for this is not sufficient. Hence, Table 2 compares the subsequent German SOEP’s
re-freshment samples with each other, as well as the SHP’s main and rere-freshment sample,
in the case when the natural refreshers are included, and in the case when they are
omit-ted. Even though there is some variation in the coefficients’ size, the results show that
the evidence for panel conditioning remains when comparing the refreshment samples
with each other, and do not change much after removing the natural refreshers from the
analysis.
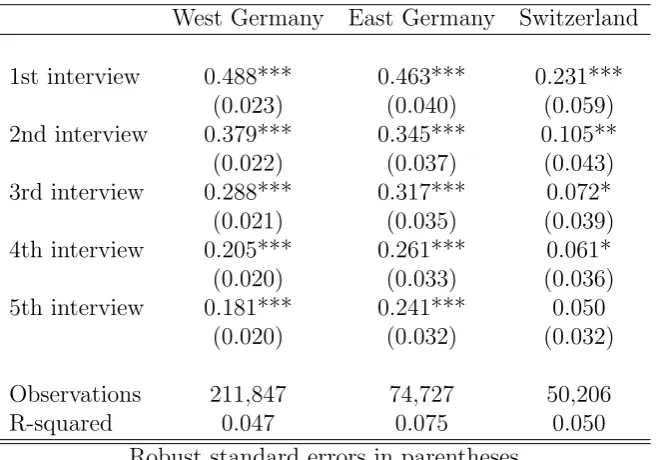
Finally, since the data include newcomers in every year, and since many rounds of
data are available, there is an opportunity for a further extension to get more precise
insights into the size and dynamics of panel conditioning. A subsample of individuals
is selected who are interviewed in at least five consecutive rounds. The stated utility
measure is regressed on dummies indicating whether one is asked the stated utility
question for the first, second, . . . or fifth time1
as well as on a set of covariates.
Results in Table 3 show us that the panel effect is not entirely established between
being interviewed for the first and second time but that it accumulates over the different
survey rounds. In West and East Germany, there is a substantial panel effect from the
second to the fifth interview, which is also statistically significant at any conventional
1
Table 2: Conditional Differences in Stated Utility Between New Respondents and Re-spondents Stemming from the Previous Substantial Refreshment: Analyses With and Without Natural Refreshers
Germany Switzerland Germany Switzerland
Including Natural Refreshers Excluding Natural Refreshers
new 2000 0.093** 0.088*
(0.047) (0.049)
new 2004 0.215*** 0.216***
(0.046) (0.046)
new 2006 0.486*** 0.489***
(0.048) (0.049)
Standard errors in parentheses
*** p<0.01, ** p<0.05, * p<0.1
Source: German Socioeconomic Panel and Swiss Household Panel.
Controls are similar as in Table 1, and the correction for panel attrition has been applied.
significance level.2
The pattern for Switzerland is in line with that for Germany, but no
panel effect is measured after the third interview.
The coefficient on the dummy for being interviewed for the fifth time can be
inter-preted as the negative of a residual panel effect, that is, which will be established over
all the interviews after the fifth has taken place.3
For West and East Germany, this
coefficient still has a substantial magnitude of 0.18 and 0.29, respectively. It is rather
speculative why in the Swiss data the cumulation path is somewhat shorter than in the
German data, but it might be due to a different mode of interview or due to the fact
that the key question was only asked from the second year onwards in the SHP, when
respondents had already some experience with answering surveys.
2
A panel effect for interview n is calculated as the difference in coefficients between the nth and n−1th interview.
3
Table 3: The Path of Panel Effects over Interviews: Results for West Germany, East Germany, and Switzerland
West Germany East Germany Switzerland
1st interview 0.488*** 0.463*** 0.231***
(0.023) (0.040) (0.059)
2nd interview 0.379*** 0.345*** 0.105**
(0.022) (0.037) (0.043)
3rd interview 0.288*** 0.317*** 0.072*
(0.021) (0.035) (0.039)
4th interview 0.205*** 0.261*** 0.061*
(0.020) (0.033) (0.036)
5th interview 0.181*** 0.241*** 0.050
(0.020) (0.032) (0.032)
Observations 211,847 74,727 50,206
R-squared 0.047 0.075 0.050
Robust standard errors in parentheses
*** p<0.01, ** p<0.05, * p<0.1
Source: German Socioeconomic Panel and Swiss Household Panel.
All regressions include marital status dummies, labour force status dummies, education
dummies, age and time dummies, and a dummy for having entered the panel as natural
4
Conclusion
This paper has used panel refreshers as a source of identification to show that a time
trend of stated utility measures one often observes in panel data can be attributed to
panel conditioning, that is, answering questions differently the longer one has been in
the panel. Reasons for this might be numerous and it is likely that an interplay of factors
is at work, e.g. cognitive biases as described in Kahneman and Krueger (2006) might
change, or one might interact differently with the interviewer (Chadi, 2013). There
seems to be some variation in panel effects across the different samples in the analysis.
Since the stated utility question is only asked from the second wave onwards in the SHP,
the smaller panel effect in Swiss data in Table 3 might reveal that survey participation
as a whole rather than having repeatedly answered the stated utility question causes the
panel effect. Interaction effects of the panel effect with other variables (such as survey
design characteristics and macroeconomic shocks), as well as sampling error might be
other explanations for variations in the size of the estimated panel effect.
As it seems that panel conditioning can be identified without strong arbitrary
as-sumptions, as panel attrition seems to bias the estimated effect towards zero rather than
the reverse, and as the phenomenon does not seem to be bound to one particular dataset,
the results might imply important consequences for interpreting and designing studies
that look at a society’s (or specific cohort’s) well-being over time.
Acknowledgments
Acknowledgments
Arthur van Soest for valuable comments, discussions and advice. I am also grateful to
seminar and conference participants in Berlin, Bonn, Cambridge, Freiburg, Maastricht,
Malaga, Philadelphia and Milan. This project was partly funded by a Rubicon grant
from the Dutch Scientific Organization (NWO).
References
Benjamin, D., O. Heffetz, M. Kimball and A. Rees-Jones (2013) Can Marginal Rates
of Substitution Be Inferred from Happiness Data? Evidence from Residency Choices.
American Economic Review, Forthcoming.
Chadi, A. (2013) The Role of Interviewer Encounters in Panel Responses on Life
Satisfaction. Economics Letters 121, 550-554.
Conti, G. and S. Pudney (2011) Survey Design and the Analysis of Satisfaction.
Review of Economics and Statistics 93, 1087-1093.
Das, J., A. van Soest and V. Toepoel (2011) Nonparametric Tests of Panel
Con-ditioning and Attrition Bias in Panel Surveys. Sociological Methods and Research 40,
32-56.
Heffetz, O. and M. Rabin (2013) Conclusions Regarding Cross-Group Differences in
Happiness Depend on Difficulty of Reaching Respondents. American Economic Review
103, 3001-3021.
Kahneman, D. and A. Krueger (2006) Developments in the Measurement of
Subjec-tive Well-being. Journal of Economic Perspectives 20, 3-24.
Kapteyn, A., R. Alessie and A Lusardi (2005) Explaining the Wealth Holdings of
Different Cohorts: Productivity Growth and Social Security. European Economic Review