E U R O P E A N C O A L A N D S T E E L C O M M U N I W E U R O P E A N E C O N O M I C C O M M U N I T Y E U R O P E A N A T O M I C E N E R G Y C O M M U N I T Y
C O M M I S S I O N
The Agricultu
ral Situation
in the Community
1979 Report
(Report published in conjunction with the
'Thirteenth
General Report on the
Activities of the European
Communities')
This publication is also available in the following languages DA fSBN 92-825-1487-0
DE ISBN 92-825- 1488-9 FR fSBN 92-825-1490-0 rr rsBN 92-825- 1491-9 NL fSBN 92-825-1492-7
Cataloguing data can be found at the end of this volume
O Copyright ECSC / EEC / EAEC, Brussels and Luxembourg, 1980 Printed in the FR of Germany
Reproduction authorized, in whole or in part, provided the source is acknowledged.
Contents
Foreword
Introduction: The year 1979 | - The general situation
1. Economic differences continue
2. The introduction of the European Monetary System 3. World markets in agricultural products
4. The Community's external relations 5. Common policies
ll - Agricultural structure General survey 1 . L a n d a n d l a n d u s e 2. Farm labour 3. Capital
4. Part-time farming 5. Productivity 6. Market structures 7 . Relevant issues
lll - The common market in agriculture A - General survey
B - Trade in agricultural products
C - The situation on the agricultural markets 1. Cereals
2. Rice
3. Sugar and isoglucose 4. Olive oil
A G R . R E P . 1 9 7 9
1 1
Page
I
1 5 1 5 1 7 1 8 1 9 2 2 2 7 2 7
CONTENTS
5. Oilseeds and protein seeds
6. Dehydrated fodder: peas and f ield beans 7 . Fibre flax and hemp
8. Seeds 9. Wine 10. Raw tobacco
1 1. Fruit, vegetables, live plants 12. Hops
13. Milk and milk products 14. Beef and veal
1 5 . P i g m e a t 1 6. Eggs 17. Poultrymeat 18. Silkworms
19. Products not subject to a common market organization (a) Agricultural alcohol
(b) Potatoes (c) Sheepmeat (d) Honey (e) Wood 20. Meat 2 1 . O i l s a n d F a t s 22. Feedingstuffs
D - obstacles to the common agricultural market 1. Monetary compensatory amounts 2. State aid
lV - The consumer and the producer General survey
A The consumer
1. Influence of the general economic environment on the consumer 2. Trends in consumption and consumer habits
3. Security of supply 4. Price stability
5. Special measures to benefit consumers
6 7 69 70 7 1 7 1 7 3 74 7 7 7 7 8 1 83 8 7 8 7 89 89 89 89 90 9 1 9 1 9 1 9 2 9 3
94 98
1 0 1 1 0 1 1 0 3 1 0 3 1 0 3 1 0 5 1 0 6 1 0 8
B - The producer 112
1. Agricultural production '112
2. Price trends 1 18
3. Income trends 121
4. Regional disparities in agricultural incomes according to various national
sources 127
5. Special measures to assist pröducers 129
CONTENTS
V - The financial aspects A - General survey
B - The EAGGF Guarantee Section C - The EAGGF Guidance Section
Conclusions: The outlook 1. General survey 2. Basic assumptions
3. Development of agriculture until 1990 4. Major problems agriculture will face 5. Short to medium-term outlooks for markets
6. Cost of the market organizations and compensatory amounts
Statistical information and tables 1. Monetary units used
2. Key to symbols and abbreviations 3. Observations on statistical method 4. Statistical tables
General economy General economic data Agricultural economics Prices
Consumption
Trade and degree of self supply Agricultural incomes
Financial aspects Structures Regions Agricultural markets
Cereals Rice Sugar Olive oil
Oilseeds and protein seeds
Dried Fibre fodder: peas and field beans Flax and hemp
Seeds W i n e Raw tobacco Fruit and vegetables Hops
A G R . R E P . 1 9 7 9
1 3 3 1 3 3 1 3 5 140
143 143 145 1 4 6 1 5 5 1 5 8 1 6 1
Table No
o 1 - 1 0 5
0 1 - 0 3 1 7 7 - 1 8 0 0 4 - 1 2 1 8 0 - 1 9 6
13-23 187 -223 24-26 224-227 27 - 43 228-245 44 - 48 246-253 49 - 59 254-267 60 - 97 268-3 1 5 9 8 - 1 0 5 3 1 6 - 3 3 1 M - 332 -!37
[image:7.456.34.403.47.592.2]CONTENTS
M i t k
Beef and veal P i g m e a t E g g s Poultrymeat Silkworms Alcohol
Potatoes Sheepmeat H o n e y Wood All meat Fats
Feedingstuffs
Graphs N o
1. Consumption (inhabitants), production (UAA) and agricultural produc-t i o n - 1 9 7 8
2. Percentage of farms of lesS than 20 ha 3. Agriculture in the economy as a whole 4. Breakdown of holdings by size category
5. Percentage of dairy cows for which milking machinery is used 6. Percentage of the area under cereals for which combine harvesters
are used
7 . Percentage of total working population employed principally in agri-culture
8. Percentage of farmers having another gainful activity 9. Labour productivity in agriculture
10. Percentage of farmers who are members of cooperatives 1 1. Common price ratios for certain agricultural products 12. Cereals: c.i.f. prices and import levies
13. Pig prices in Community countries
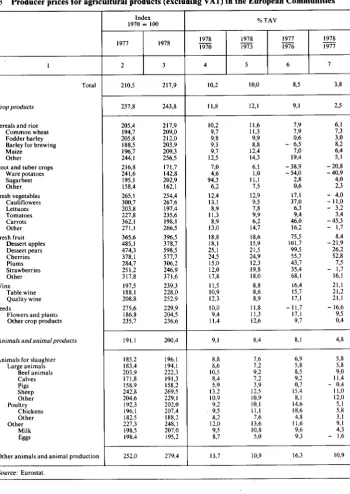
14. Rates used for the calculation of monetary compensatory amounts 1 5. Final agricultural production at current prices
16. a and b Producer price indices for several agricultural products 17. Intermediate agricultural consumption at current prices
18. Net value added in agriculture at factor cost and current prices 19. Factors of production on farms by main types of farming 20. Production and income of farms by main types of farming
21. Agricultural employment as a percentage of total civilian employ-ment
22. Less-favoured areas within the meaning of Council Directive 75 / 268 /EEC of 2SApril 1975 on mountain and hill farming and farming in certain less-favoured areas
M . 1 3 . 1 - 1 3 . 1 8 3 8 6 - 4 0 3 M. 14. 1 - 14.7 404-408 M . 1 5 . 1 - 1 5 . 7 4 0 9 - 4 1 2 M . 1 6 . 1 - 1 6 . 6 4 1 3 - 4 1 5 M . 1 7 . 1 - 1 7 . 5 4 1 6 - 4 1 8 M . 1 8 . 1 4 1 8 M . 1 9 . a 4 1 9 M . 1 9 . b . 1 - 19.b.4 4 2 0 - 4 2 3 M. 19.c.1 - 19.c.6 424-426 M . 1 9 . d . 1 4 2 7 M . 1 9 . e . 1 4 2 8 M.20. 1-20.4 429-431 M . 2 1 . 1 - 2 1 . 2 4 3 2 M.22.1 -22.8 433-437
t3
2 8 3 3 40 4 1 44 46 48 50 5 6 6 2 8 5 9 6 1 1 3 1 1 6 + 1 1 7CONTENTS
23. Agriculture as percentage of gross domestic product 24. Currency parities
25. Gross and net value added per person employed in agriculture 26. The regiöns of the Community and their UAA
27 . Consumer price indices for fruit and vegetables
1 5 6 1 7 0 246 3 1 6 3 7 6
Foreword
This Annual Report on the Agricultural Situation in the Community-the fifth
in published form-is intended to be read in conjunction with the 'Thirteenth
General Report on the Activities of the European Communities'.
Chapter IIIC on the situation of the agricultural markets is a summary of the Document 'situation of agricultural markets in the Community - 1979 report'' The Commission has already presented separate reports to the Council on a number of matters.
This Report was completed on 31 October 1979.
f ntroduction
: The year 1979
1. ln 1979 the Community's recovery from recession was jeopardized by the
rapid oil price increases following supply shortages in the ltrst part of the year. The effect of these price rises was to increase inflation rates and to cause a slowdown in economic growth. Faster inflation affected agriculture through increases in the prices of its intermediate consumption.
2. The introduction of the European Monetary System brought a greater degree of stability to currency exchange rates, though currency disturbances in Septem-ber did cause some small realignment of central rates. National expressions of the
common price level were brought closer together by adaptations of the green
rates.
3. The world cereals harvest approached 1978's record levels. This was also
reflected in the Community where favourable weather also increased the sugar yield of the sugarbeet harvest and the level of wine production.
4. Community agriculture is still marked by persistent surpluses in some sectors, milk and sugar being examples. Measures taken to bring more balance to the milk market have been insufficient to stem the steady increase of produc-tion.
5. The year saw a continued effort to help the economic development of less-favoured regions. Measures proposed in March 1979 will stimulate agricul-ture by transferring resources and by correcting production deficiencies.
1 2 r N T R o D U c r r o N
CONSUMPTION (inhabitants), PRODUCTTON (UAAI and
AGRICULTURAL PRODUCTION
t978
,o !.l.#
ffi ,nn.o,,rnts - proportion of the poputation (%) $fl u"^o - proportion of uAA (7o)
S ur,r" of final production (%)
,"*,r"rffi
Final production
GRAPH I
I N T R O D U C T I O N l 3
3 1 . 1 . 6 . 2 . 1 3 . 3 . 1 4 . 3 . 20.3. 29.3. 4 . 4 . 9 .4 . t2.4. 28.5 . 7 -t0.6. 2 5 . 6 . 2 5 . 6 .
2 5 - 2 7 . 6 . 13.7 . 25.9. l . 1 0 . I . 1 0 .
The main events of 1979
E v e n t
Commission adopts price proposals and connected measures for 1979/80; no increase in prices in EUA, progressive dismantling of MCAs.
Council adopts structural measures for Mediterranean zones. EMS enters into operation.
European 'Parliament rejects Commission price proposals; requests 3% increase in prices in EUA except for products in excess.
Commission sends new structural proposals to the Council.
G r e e n ra t e s d e v a l u a t i o n f o r F F ( - 5 . l l 8 o / " ) L I T ( - 5 . 0 2 1 o / o ) U K L ( - 5 . 0 0 o / " ) I R L ( -0 .297 o/").
Economic and Social Committee supports Commission proposals on prices of'products in excess as well as dismantling of MCAs.
The European Currency Unit (ECU) introduced into the CAP. Opening for initial of combined texts of the GATT agreements. Treaty of Accession of Greece to the EEC signed in Athens. Direct elections to the European Parliament.
Council agrees a 1.5%o increase in agricultural prices in ECU for 1919/80,, with the exception of milk and milk products.
R e v a l u a t i o n o f t h e g r e e n r a t e f o r t h e D M ( + t . l l 0 % ) B F R , , L F R a n d H F L ( + 0 . 5 5 2 % each); devaluation of the green rate for the FF ( - I .5%o) UKL (-5 %o) and LIT (-8.991 to -4.184"/o according to product).
Text of new ACP-EEC Convention hnalized.
Protocol of GATT tariff agreement (MTN) signed in Geneva.
Central rate of the DM in EMS revalued by 2o/o, that of the DKR devalued by 3 % o .
G r e e n ra t e s d e v a l u a t i o n f o r F F ( - 1 . 0 3 5 % ) L I T ( - l . l 2 l % ) U K L ( - 1 . 0 9 9 % ) I R L ( - 0 . 9 7 6 % ) D K R ( - 3 .802o/o).
Commission report shows rise in crude-oil prices fob of 59o/o since 3l December I 9 7 8 .
l-The
situation
6. The following are the main events of 1979.
The Community's slow recovery from economic recession was shaken by events
in the world oil market.
1. These events led to rapid rises in oil prices which, in turn, caused faster inflation and slowed economic growth. The faster inflation, especially in energy prices, affected agriculture through the prices of its intermediate consumption.
2. 1979 saw the launching of the European Monetary System and the introduc-tion in the agricultural policy of the European Currency Unit.
3. World production of grains approached the record harvest of 1978.
4. ln 1979 the Community took several initiatives in the freld of interflational relations of vital interest to Community agriculture.
5. The Community has also, in 1979, continued to develop the common agricultural policy, notably in the field of agricultural structures.
1. Economic differences continue
7. The Community's slow recovery from economic recession was shaken in
1979 by events in the world oil market. The threat of an oil shortage in the first months of the year led to a series of price increases and, by the end of June, the world oil price was 60% above its level for December 1978. Other raw-material
prices also rose and inflation rates throughout the Community accelerated. This,
in turn, led to lower rates of economic growth than had been forecast.
general
8. The effects of these events
so that the economic situation economic differences.
A G R . R E P . 1 9 7 9
l 6 G E N E R A L S I T U A T I O N
9. The impact on inflation and economic growth of the rapid rise in oil prices tended to slow down, or even halt, the slight tendency towards economic
convergence that has been evident since 1976. This is true both for inflation and
economic growth rates.
10. ln 1979, the growth rate of Community real GDP is expected to be
3.l%--equal to 1978-but it was slowing down at the end of the year. The performance varied widely from country to country. Towards the end of the year, real GDP was growing more quickly than in 1978 in the FR of Germany,
Italy, Denmark, Belgium and the Netherlands. In Ireland, the United Kingdom
and Luxembourg, however, 1979 saw a marked decline in the growth rate. Conditions in the Community labour market can scarcely be said to have
improved, although unemployment stabilized;5.6% of the available labour force
was unemployed compared to 5.5% in 1978.
11. The Community inflation rate increased in 1979 under the effect of oil
price rises and the GDP deflator rose from 7.8% in 1978 to 89% in1979.
For the second year running, food prices made a considerable contribution to the
fight against inflation. In the first part of 1979, food prices rose by 7.5% against 8.5% for non-food goods and 8.9% for overall consumption.
12 . The rate of increase of wages
wage per wage earner was forecast to more than in 1978.
accelerated slightly in 1979. The average grow at about 10.6% in the year, slightly
13. The oil price increases helped to bring about a marked change in the
Community's trade and cunent-account balances. From a substantial current-account surplus in 1978 (+ 14 000 million ECU), the Community moved to a deficit in1979 (-3 300 million EctD.Besides the rise in oil prices, this was due to the deterioration of the trade balances in volume terms of the FR of Germany, Italy and the United Kingdom.
14 . Agriculture felt the effects of
through the purchase prices of its considerably in all Member States, Government control.
oil and other raw material price increases means of production. Energy prices rose except ltaly, where prices are subject to
G E N E R A L S I T U A T I O N
15. The productivity of agricultural labour grew by about 6% a year from
'1968'to'1976'-using a three-year average for the years in question-and land
productivity by 2 to 2.5% a year. Under the influence of the economic recession the growth of productivity has been slowing down since 1973.
2. The introduction of the European Monetary System (EMSI
16. The major world currencies continued to float in 1979. Thus their daily
and weekly variations continued to affect the operation of the common agricul-tural policy in its relations with external markets (effect on the rates of levies and export refunds). Similarly the variations of the floating currencies within the Community continued to affect the internal agricultural market.
17. On 13 March the EMS came into operation after a delay of two and a half
months due to difficulties concerned with the implications of the system for certain aspects of the common agricultural policy. The central rates of the national currencies against the European Currency Unit (ECI-D were based, in the case of cunencies belonging to the former European exchange system (the snake, i.e. BFR/LFR, HFL, DKR, DM), on the central rates applied until 12 March under that system and, in the case of the other currencies, on their market rates on the eve of the inroduction of the new system (EMS).
18. The ECU was introduced into the common agricultural policy on 9 April
1979. This introduction was made neutral for institutional agricultural prices and agricultural monetary compensatory amounts by the application of a coeffrcient of adjustment to institutional prices and to green rates. The coefficient was made necessary by the fact that the ECU had a lower value than the existing agricultural unit of account.
19. There was considerable intervention by the EMS participants in the six
months under review, but the system functioned without recourse to credit mechanisms. The main currencies used for bilateral intervention operations were the DM, BFR/LFR and DKR. The effective intervention operations carried out by the Community central banks in the months which followed the launching of the system were designed more to offset the negative effects of the performance of the US dollar on the cohesion of the EMS than to put right any fundamental
A G R . R E P . 1 9 7 9
l 8 G E N E R A L S I T U A T I O N
disequilibrium within the system. The greater part of official intervention by Community central banks, therefore, continued to be in dollars. Much of the intervention took place in the context of the wider cooperation among central banks, especially between the US authorities and some other major central banks.
20. Efforts to reduce monetary compensatory amounts (MCAs) continued
during the year by means of several adjustments to representative rates. On the introduction of the ECU into the common agricultural policy on 9 April 1979 devaluations of representative rates had the effect of reducing MCAs. Later, when the common agricultural prices were being fixed, a further adjustment of representative rates was made.
21. Following disturbances on the foreign exchange markets in late summer,
which has their origin largely outside the Community, finance ministers and central bank governors of countries participating fully in the EMS agreed on a
realignment of exchange rates. The Deutschmark was revalued by 2% and the
Danish krone was devalued by 3% against the other participant currencies. This
decision resulted in the following changes in central rates in ECU: BFR/LFR, F F , H F L , L I T , IRL -0.97%, DKR -3.8% and DM +1.01%.
22. Since the value of the ECU is made up from a basket of the currencies of
Member States, a change in the central rate of one of those currencies results in an alteration in all the relationships between the ECU and the national currencies, so that, in theory, all the monetary gaps used in calculating the MCAs are changed.
3. World markets in agricultural products
23. The outlook for grain production in 1979/80 was for another abundant
world harvest. World production was forecast at about I 500 million tonnes, only a little below the record harvests of 1978179. The major regional variations
showed relatively poor prospects in the Soviet Union, with production some
25% down on 1978/79, partially offset by a record production (up 4%) in the United States.
As between wheat and feed grains the patterns were similar, with a strong increase in wheat production and modest increases in feed grains in the US partially offsetting strong decreases for wheat and feed grains in the Soviet Union.
G E N E R A L S I T U A T I O N l 9
Prices have been rather firm, particularly as
requirements of the Soviet Union and Eastern
substantially higher than in 1978.
a result of the high import Europe, and for all cereals are
24. So far as protein crops are concerned, a record soya-bean production
forecast at around 93 million tonnes and sunflower and rapeseed production also expected to be very high. Despite this outlook, soya prices remain relatively high levels.
25. Despite the possibility that world sugar production will be below forecast
consumption, price prospects remain weak as a result of the very high accumu-lated stock levels, although developments in the Intern4tional Sugar Agreement may modify the outlook.
4. The Community's external relations
26. The cooperation agreements concluded with the south Mediterranean
countries provide for an examination of their results in order to determine if improvements can be made on the one hand, and on the other to study the
experience required during the operation of these agreements, taking account of
the objectives which are defined therein. To date, this examination has only been initiated with Israel. Exploratory conversations are under way with Moroc-co.
27. Negotiations with Greece culminated in the signing of the Act of
Accession on 28 May 1979. For agriculture, the transitional period and the duration of the transitional measures are of five years, but for fresh and processed tomatoes and fresh and canned peaches they will last seven years; cotton is covered by a special Protocol; the granting of production aid for dried figs and raisins (dried grapes) will be envisaged under Community rules. During the transitional period the differences between the prices of Greek and Commu-nity products will be compensated for by accession compensatory amounts. Special compensation arrangements have been agreed for certain fresh fruit and vegetables.
28. The Commission staff were, at the end of 1979, engaged in preparing a communication from the Commission to the Council on guidelines for the negotiations with Spain in the agricultural sector.
A G R . R E P . 1 9 7 9
20 G E N E R A L S I T U A T I O N
29. The new ACP-EEC Convention signed on 3l October 1979 at Lom6
represents a considerable improvement over the current Convention which expires on 29 February 1980. The trade arrangements will be extended and a number of improvements incorporated concerning, in particular, bovine meat. The system for the stabilization of ACP States' earnings from exports of certain products will also be extended, improved and broadened to cover other products, including agricultural products.
30. The generalized system of preferences applying to all developing countries
received some slight improvement in 1979. The Community introduced, for 1979, nil duties for all products covered by the system in favour of the least-advanced developing countries, and free access except for the six agricultu-ral products under quota. In 1980, the Commission has not proposed improve-ments with respect to the products covered by this system with the exception of dried bananas, certain technical arrangements so that pineapple quotas are better exploited and so that the Indian exports of tobacco are not penalized by the introduction of the ECU.
31. The Commission's proposals for the 1970 food-aid programme were
adopted by the Council on 8 May 1979. These proposals concern the allocation
of 720 500 tonnes of cereals (to which is added the 566 500 tonnes of aid granted
directly by the Member States), 150 000 tonnes of skimmed-milk powder, 45 000
tonnes of butteroil and 6 153 tonnes of sugar.
32. The low prices on the free sugar market meant that the obligations
regarding storage and the maximum reduction of export quotas applicable to the parties to the 1977 International Sugar Agreement were in force throughout 1979. The fund to finance the sugar stocks which are to be built up, under the Agreement, to help exporting developing countries to respect these obligations is
still, however, in suspense pending ratification of the Agreement by the United
States. The Community has had exploratory contacts with the International
Sugar Council on its possible accession to the Agreement, but no negotiations
haVe been opened.
33. The Community took part in negotiations for a new International Olive
Oil Agreement; this was successfully concluded in March 1979. The new Agreement will come into force on I January 1980 if it has been signed and ratified by a sufficient number of parties to the Agreement by that date.
G E N E R A L S I T U A T I O N 21
34. A special committee has been set up to prepare the ground for a further
negotiating conference under the auspices of UNCTAD.
35. The GATT Multilateral Trade Negotiations have ended. The results can
be seen as satisfactory for the Community, particularly in the agricultural sector, and are being put through Council acceptance procedure. The main results of these negotiations in the agricultural sector are as follows:
- the setting up of international agreements on meat and milk products, each
containing arrangements for increased multilateral cooperation in the event of threatening or crisis situations arising and, for milk products, specific agreements imposing disciplines with regard to exports of milk powder, butter and cheese;
- the exchange of 'tariff and non-tariff concessions enabling the Community to consolidate and, in certain sectors, to develop significantly its exports of agricultural products to financially solvent non-member countries;
- the bringing into force of codes or general agreements also relating to the agricultural sector on such matters as subsidies and countervailing duties, quantitative restrictions, value for customs purposes änd technical barriers to trade, which will provide both for greater discipline in import and export practices and for a uniform application of GATT obligations by all major countries.
Still in connection with GATT, the panel, set up by the Contracting Parties to examine Australia's appeal regarding export refunds on Community sugar, met several times. At the beginning of October it had reached the stage of publishing its conclusions. Generally speaking one may say that the panel did not accept the Austraian point of view as regards the main heads of its complaint against the Community. A second panel was also set up to look into a similar complaint submitted by Brazil, also regarding Community sugar exports. Work is in progress.
The 1971 International Wheat Agreement was extended following the failure to negotiate a new agreement.
36. Relations with the United States have been affected by problems
connected with the outcome of the multilateral trade negotiations. Bilateral problems have also arisen regarding certain Community exports. The United States introduced a countervailing duty on exports of canned tomatoes from the Community.
22 G E N E R A L S I T U A T I O N
3 7 . The Commission has begun
manioc to the Community. Thailand product to the 1978 volume. Work
discussions with Thailand on exports of
has agreed to limit its 1979 exports of this
is in progress on future arrangements.
38. Negotiations are taking place with Yugoslavia for a new agreement of broader scope. The Council has for that reason extended until 31 December
1979 its concession to that country on baby-beef.
39. The dialogue initiated in 1978 with Japan on ways of improving
Commu-nity exports to that country was actively pursued ln1979.It covers all aspects of
Japan's import policy including health protection and plant health measures. The
favourable trend in agricultural exports was maintained in 1979'
40. The trade agreement concluded with China in 1978 continued to operate.
At the first meeting of the Joint Committee provided for in the agreement, the Community was able to announce that from January 1980 the generalized
system of preferences would be extended to China for non-sensitive products.
5. Common policies
41. The development of European policy in general and the decisions taken
by the Community institutions within the scope of common policies, including the common agricultural policy, provide the general political framework in which Community agriculture has evolved in 1979.
42. In order to render the agricultural structures policy more effective and to
provide better for the needs of the farmers, regions and sectors most directly concerned. a number of directives or proposals for directives were adopted in
1979 by the Council acting on proposals from the Commission. They are part of
a longer-term strategy aimed at eliminating the disparities between the agricul-tural regions of the Community and thereby reducing the considerable differ-ences in income between them. In February the Council, after obtaining the opinion of the Parliament, adopted a Directive on a programme to encourage drainage in catchment areas including land on both sides of the border between
G E N E R A L S I T U A T I O N
Ireland and Northern Ireland. In March 1979 the Council, after obtaining the opinion of the European Parliament and the Economic and Social Committee, approved a Directive on the programme to speed the conversion of certain areas
under vines in the Charentes departments.
In March also the Commission put forward to the Council several proposals concerning the agricultural structures policy. These proposals were of two kinds: adjustments to the Directives already in force, proposals for Council Regulations
covering new measures, as follows:
- proposal introducing a common measure for the development of beef and
sheepmeat production in Italy;
- proposal concerning the speeding up of agricultural development in the less-favoured regions of the west of Ireland;
- proposal concerning the development of sheep-farming in Greenland;
- three proposals concerning integrated development programmes, namely: one
for the Western Isles of Scotland; one for the LozÖre department (France) and one for the Belgian province of Luxembourg;
- proposal amending council Regulation (EEc) No 355/77 of 15 February
1977 concerning a common measure to improve the conditions under which
agricultural products are processed and marketed (special measure relating to
the slaughtering of pigs and the processing of pigmeat in France and the
United Kingdom.
43. On 31 January 1979 the Commission adopted the principal proposals on
farm prices and related measures for 1979-80. The draft regulations pertaining to these proposals were adopted early in February and the package as a whole was transmitted to the Council at that time. The main proposals were for the maintenance of prices in 1979180 at their 1978/79 level, an increase in the co-responsibility level for milk production to at least 2%, and the progressive
dismantling of the monetary compensatory amounts.
44. The price discussions in the Council lasted from the beginning of March
to the end of June 1979. Agreement was reached with an increase of 1.5% in all
prices except those of milk and milk products, expressed in ECU. When green
rate changes were taken into account, increases in terms of national currency ranged from +0.4% to +12.0%. In addition, no change in the milk co-responsibility levy was adopted. As the structural proposals had not been
sufliciently examined, no decision was taken on them in the prices package. The
Commissioner for Agriculture, Mr Gundelach dissociated himself and the
Commission from the decisions relating to the milk and sugar sectors.
A G R . R E P . 1 9 7 9
24 G E N E R A L S I T U A T I O N
45. Following a decision by the European Court of Justice in October 1978
that the amount of the production levy on isoglucose was not valid, a new
production system applicable to the 1979180 marketing year came into force on
1 July 1979. lt provides for a system of quotas similar to that for sugar. The production and consumption of isoglucose have increased steadily in recent years and will amount to about 160000 tonnes in1979.In view of this situation and the likelihood that the use of glucose will continue to increase, it is improbable that there will be any significant increase in sugar consumption in the next few years.
46. Under the provisions of Articles 92 to 94 of the Treaty, the Commission
continued to take decisions on State aid. In 1979 it received sixty-six notifica-tions of draft laws introducing or altering national aid. In most cases the Commission decided not to raise any objection to the implementation of these draft laws, having in several cases, as the result of bilateral contacts with the representatives of the Member States, received further details or assurances as to the manner of application of these measures. However, it decided to initiate the examination procedure provided for by Article 93 (2) of the Treaty in respect of the proposal by the United Kingdom to grant aid in the egg and poultrymeat sector (Northern Ireland). The Commission also decided to close the procedure, previously initiated under the same provision, in respect of four Italian draft laws.
26 AGRICULTURAL STRUCTURE
Percentage of farms of less than 20 ha
1975
d
Iffi
f:l
m
[m
<25o/o
25 - 50%
50 - 75o/o l5 - l00Yo
GRAPH 2
ll - Agricultural
structure
(1)
General survey
47. Structural change in the Community is continuing. The total number of
farms is declining progressively albeit, in some cases, at a lower annual rate in
more recent than in former years. In the majority of Member States this decline
is confined mainly, though not exclusively to farms in the smaller size groups;
during the period 1970 to 1975, the decline was concentrated on farms of 20 ha
or less at Community level. (t) However, the threshold between farm size
categories with decreasing and increasing farm numbers, which remained at
20 ha in five of the nine Member States during this five-year period, was at 30 ha in Denmark and Luxembourg, at 50 ha in France and even at 120 ha in the United Kingdom. These latter figures underlie the differing levels of structural development and, implicitly, the degree of variation in structural change which is taking place in different areas of the Community (Graph 2).
ln 1977 /78 the rate of decline in the number of farms over I ha varied from
0.7% in the United Kingdom ro 2.5% in Belgium and 3.8% in Luxembourg. A
similar downward trend is observed in agricultural employment. In 1977178 the
active farm population declined by 2.4%, afigure which varied from 0.6% in the United Kingdom to 4.1% in Belgium.
48. Between 1968 and 1976, the final agricultural production in the
Commu-nity (apart from the United Kingdom) increased at an annual rate of 1.8% in
terms of constant (1970) prices. On the other hand labour productivity measured in terms of final agricultural production increased by 63% annually, while productivity per ha increased by 2.4%. The relative importance of agriculture in
the Community economy is progressively declining. In 1978, the contribution of
(t) The cunent analysis of agricultural structure in the Community is mainly based on the results of the 1975 Farm Structures Survey. These results, although still provisional to a large extent, permit a more in-depth examination of the situation at regional level than might otherwise be possible. Altogether the Survey covered 66% of total land area,92% of utilized agricultural area (UAA) 2'l% of woodland area,93% of total livestock units (LU) in the Community.
ü
s
(D
ä R P P S S g @ . o . t N o
: O @ ( 0 t N O ( D ( 9 t ( r | O
O\ rF 'F rF
rq
J
o
FT{
>
a
o
Z o \
8 5
H d
H E
F
z,
rq ü
-F ,-1
9 t ()
A G R I C U L T U R A L S T R U C T U R E 2 9
agriculture to overall economic activity was 4.4% in terms of GDP and 8% in
terms of total employment (cf. 1973: 5.2% and 9.2% respectively) (Graph 3).
49. The pattern of agricultural production has remained largely unchanged,
however, by comparison with previous years. The largest livestock enterprises are found in the United Kingdom while the greatest concentration of non-grazing livestock is found in Denmark, Belgium and in certain regions of the FR of Germany, France and Italy. The total number of farms in the Community declined at an annual rate of 296 between 1970 and 1975. However, some 64% of farms still have less than 10 ha in area and embrace no more than 14% of total UAA while only 6% of farms are over 50 ha in area but cover 41% of total U A A .
50. Some 82% of the total annual work units (AWU) in the Community's
agriculture comprises family labour. The percentage of family labour in the labour force declines with increasing farm size, however. The average man-land ratio is 9 AWU per 100 ha. Some 44% of farmers are over 55 years of age, and they occupy some 33% of UAA. Only 36% of farm holders can be classified as full-time farmers; some 56% are mainly occupied in farming however in so far as they devote more than 50% of their working time to this activity. On
aggregate, full-time farmers occupy 68% of total UAA. By contrast each of the
groups working less than 50% and over 50% of their working time on the land occupy 16% of total UAA. Full-time farmers account for 59% of all farms with dairy cows but no more than 34% of the total area of permanent crops.
51. Capital investment at the macro and micro-levels appears to be most
intensive in the FR of Germany, the Netherlands, Beglium and Luxembourg and least intensive in Italy and lreland. At farm level, non-land capital
investment per AWU increases substantially as between farms earning 80% and
120% of the comparable income per work unit (cf. Directive 72/159/EEC, Article 4).
52. Sales of agricultural produce through cooperatives changed little in 1978,
except in the FR of Germany where there was a substantial increase in the cooperative sales of fruit and vegetables and in Denmark where similar sales of
beef, pigmeat and eggs increased slightly.
3 0 A G R I C U L T U R A L S T R U C T U R E
53. The foregoing facets of agricultural structure in the Community give rise
to a number of relevant issues. Since the intensity of land use is highest on the
smaller farms the structural reorganization of agriculture is of vital importance to
the achievement of a satisfactory market balance between supply and demand,
particularly in the dairy sector. Farmheads over 65 years of age still control over 13% of total UAA. The stimulation of land mobility for structural purposes
faces many obstacles not least of which is the currently high price of farmland
and the restrictive nature of land-tenancy legislation. Because of the lack of impact of Council Directive 72l160|EEC in stimulating land mobility, much of
the modernization of farms which has taken place in accordance with the
provisions of Directive 72/l59|EEC has been more or less synonymous with the
intensification of farming systems within the framework of existing farm
structures. The adaptations of Directive 72/160/EEC which are currently under
discussion in the Council are designed to make it a more effective instrument in the stimulation of land mobility.
54. The Community's socio-structural policy as it has operated to date has
not been suffrcient to solve the basic problems of many less-favoured areas. In its new proposals for structural policy, therefore, which are currently under
discussion in the Council. the Commission has put forward specific programmes
and integrated development projects designed to provide solutions to the
pressing problems of agricultural development in the regions concerned.
1. Land and land use
ji5. Between 1968 and 1978 the annual rate of decline in total UAA averaged
05% at Community level. However, between 1973 and 1978 the UAA
remained more or less unchanged, possibly because of the adverse effects of the
economic recession on the development of the non-agricultural sectors during
this latter period.
56. Within agriculture itself, shifts in the major pattern of land use and the emphasis of land utilization in Member States apparent in previous years and
discussed in some detail in previous reports showed little change in 1978 (Table
60).
A G R I C U L T U R A L S T R U C T U R E
57. The structure of farm production is still dominated by small and
medium-sized farms in the majority of Member States, the United Kingdom constituting the exception to this rule at the top and Italy the exception at the bottom of the scale.
Thus, as regards arable farming in the Community as a whole, the extent of production is on average less than
- 5 ha in the case of 67% of cereal farms;
- I ha in the case of 89% of potato farms;
- 2ha in the case of 43% of sugarbeet farms;
- I ha in the case of 63% of fruit farms.
At the same time 58% of cattle.farmers keep less than 20 head of cattle while
82% of dairy farmers keep less than 20 dairy cows per farm (Table 65).
58. A comparison of the appropriate structural data for 1970 and 1975 (Table
87) emphasizes the continuing concentration of farm production, the number of
farms engaging in almost all lines of production having fallen more sharply than
the conesponding areas of crops or numbers of animals. In some cases both the
land area and livestock numbers have increased. With the exception of fruit
farms and certain types of poultry farms, the decrease in farm numbers mainly concerns those in the smaller size groups.
59. Some 4.3 million or 74% of the Community's 5.8 million farms raise
livestock of one type or another. Some 78% of livestock farms keep grazing stock (cattle, sheep, goats, horses) and account for 73% of total LU; by contrast,
an even greater proportion (85%) of livestock farms keep non-grazing stock (pigs
and poultry) which, however, amount to no more than 27% of total LU.
The largest livestock enterprises are found in the United Kingdom while the
greatest concentrations of non-grazing stock are in Denmark and Belgium, in the
German regions of Niedersachsen and Nordrhein-Westfalen, in Bretagne (France) and in the Italian regions of Emilia Romagna, Toscana, Umbria and Marche.
60. Some 1.1 million or 26% of all stockraising farms have more than 20ha
of UAA; this proportion ranges from 30% on grazing stock farms to 24oÄ on non-grazing farms. The density of grazing stock per 100 ha of UAA varies directly with size of herd and inversely with size of farm. Thus, the average number of LU per l00ha, which is 113 on all farnis taken together, falls to 6l on farms of more than 100 ha. By contrast, in grazing herds of 100 LU and over, the corresponding figure is 153.
A G R . R E P . 1 9 7 9
32 A G R I C Ü L T U R A L STRUCTURE
61. Increasing farm size is accompanied by a larger forage area per livestock
unit and by a larger number of total livestock per AWU. Livestock density decreases, therefore, with increasing size of farm. On the other hand, an increase in livestock density with increasing size of grazing herd possibly reflects the greater scope which exists in such circumstances for more effrcient livestock management. In addition a reduction in the forage area per livestock unit which is generally associated with the larger herds may be due to the incidence of higher yields per ha of fodder crops and pasture or to the greater use of purchased feedingstuffs on the farms concemed (Table 91).
62. The average density of dairy cows at Community level is 28 per 100 ha.
This figure varies from less than 20 in many regions of ltaly to more than 100 in the Netherlands. Dairy farming is heavily concentrated in a few regions of the Community, the number of cows per 100 ha being 40 or more only in the
Netherlands, Denmark, Belgium and Luxembourg, in Bretagne, Basse Normandie
and Nord regions (France), in Bavaria, Schleswig-Holstein and in parts of Rheinland-Pfalz, Baden-Württemberg and Niedersachsen (FR of Germany), in Lombardia and Veneto (Italy), in the West Midlands and South-West regions of the United Kingdom and in the Munster region of lreland.
Farm numbers and farm size
63. In 1975 there were 5.8 million farms in the Community or some 12% less
than in 1970, representing an annual decrease of 2%. The sharpest decline
during this period was in Belgium (5% per annum) (Table 87). Some 64% of farms with 44% of AWU had less than 10 ha UAA and covered no more than 14% of total UAA. Correspondingly, farms with more than 50 ha UAA, comprising only 6% of total farms and 14% of AWU, accounted for 4l% of total UAA. Italy and the United Kingdom represent the extremes in this situation. In Italy roughly 86% of farms are less than l0 ha in area and occupy 37 % of total UAA while the 2% of farms which are over 50 ha occupy 32%. By contrast, in the United Kingdom only 27% of farms are less than l0 ha but occupy no more than 2% of total UAA while 30% are over 50 ha and occupy 8l% (Table 62 and Graph 4).
o/o
40 30 20
1 0
o
o/o
3 0 20 1 0
o
o/o
30 20 1 0
o
BREAKDOWN OF HOLDINGS BY SrZE CATEGORY (NUMBER - UAA - ALU)
5 - < l o l l o - < 2 0 l z o - < 5 0
Size category in ha UAA
oA
40 30 20 1 0
o
o/o
30 2 0 1 0
o
o/o
30 2 0 1 0
o
Number of holdings
50 -< loo
GRAPH 4
3 4 A C R I C U L T U R A L S T R U C T U R E
64. On average, barely two-thirds of all UAA is owner-occupied. (') This
proportion decreases with increasing size of the farm being 85% on farms with
l-5 ha and 59% on farms in excess of 100 ha in area.
65. Generally speaking, the intensity of land use is highest on the smaller
farms. At Community level permanent grassland accounts for 25% of UAA on
farms of 1 to 5 ha in area but increases to 49% on farms of more than 100 ha.
66. An examination of manpower frgures shows that the relative importance
of labour on a full-time basis increases with increasing farm size. Compared with the average farm where full-time workers contribute about half the time worked, they contribute only one-quarter of the time worked on farms with less than 5 ha. but two-thirds of that on farms with more than 50 ha.
67. Family labour contributes 82% of the time worked. This figure does not
vary very much between size categories except in the case of farms of 50 to 100 ha (65%) and of 100 ha UAA or more (29%).
The highest contribution made by family labour to total AWU (90%) is found on farms of 5 to 20 ha. Differences between Member States are substantial, varying from 60% in the United Kingdom to over 90% in the FR of Germany, Belgium and Luxembourg.
2. Farm labour
68. In 1975 the Community's total farm labour force included 5.8 million
farmheads, 6.0 million family members and 1.0 million regular non-family
workers. Aggregate manpower was 7.5 million AWU or about 15% less than in
1970; some 82% of this latter figure comprised family labour (46% farmheads and 360Ä family members) and 18% non-family workers (11% regular and 7%
(') Data for farms with less than I ha and labour density per ha UAA on the figures as presented give some
include those with no UAA. In.such-circumstances livestock the smaller farms tend to be over-estimated. Despite this fact,
indication of the total situation.
A G R I C U L T U R A L S T R U C T U R E 3 s
casual or seasonal). The proportion Kingdom (33%) was almost double reflecting no doubt the relatively high Member State (Table 89).
of non-family workers in the United
the corresponding Community figure,
level of structural development in this
69. At Community level, the average man/land ratio amounted to 9 AWU
per 100 ha UAA. This figure varied from 2 on farms of 100 ha and over to 39 on farms of I to 5 ha. At Member State level the number of AWU per 100 ha varied from 4 in the United Kingdom to 17 in ltaly.
Age of farmers
70. The breakdown of farms according to the age of the farmhead has an
important influence on structural change in agriculture, reflecting as it does the possibilities existing for the cessation of farming and the subsequent re-allocation of land for farm enlargement, particularly in the case of ageing farmers without
prospective successors. At Community level some 44% of farmers are over 55
years of age; this figure varies from 26% in the FR of Germany, to 5296 in Ireland and 55% in Italy. On the other hand, in 1975 comparatively young farmheads were relatively important numerically in the FR of Germany, the Netherlands and Belgium, where the proportion of those less than 35 years of age amounted to l3%, 14% and 12% respectively as against 7% for the Community as a whole (Table 89).
Between 1970 and 1975, farmheads in the under-35, 35 to 44 and 55 to 64 age
categories decreased by between 5 and 6% per annum in EUR 6. (r) On the
other hand, the 45 to 54 age category increased by 2% per annum largely as a
result of significant increases in the FR of Germany, France and ltaly. In Italy
and Denmark, the number of farmheads in the over-65 age category increased
by about one-tenth but declined elsewhere; this decline was most pronounced in
the FR of Germany (8% p.a.), Belgium (6% p.a.), Netherlands (4% p.a.) and
France (3% p.a.) (Table 87).
Farmheads of each age category are distributed variously among farms of different sizes (Table 103). At Community level 4l % of farmheads aged less
( r ) The relevant evolution for
A G R . R E P . 1 9 7 9
36 A G R I C U L T U R A L S T R U C T U R E
than 55 years have farms of less than 5 ha; this percentage increases significant-ly with increasing age of farmer going from 54% for farmheads of 55 to 64 years to 67% in the case of those over 65 years of age.
71. If one considers production capacity expressed in terms of UAA, of LU
and AWU, all three being classified according to the age of the farmhead and
the number of AWU per farm, it emerges that many small farms are operated by elderly farmers (Table 97). Farmheads over 65 years of age, for example,
account for 2l% of farms, 17% of the AWU, 13% of UAA and less than l0%
of LU. The bulk of the production potential lies in farms with I to 3 AWU operated by farmheads of 35 to 54 years of age. From the point of view of potential structural change, this means that if all farms were relinquished by
those in the over-65 year age category, some 13% of the UAA would become
available for structural improvement.
Composition of labour force
72. The character of the individual farm varies considerably, depending on
the composition of its workforce. This ranges from the one-man farm, through
farms worked solely by family labour, to the large holding operated entirely by
non-family workers. Only a partial analysis of this composition is feasible on the basis of the available data. Some 93% of all farms employ no outside labourq
these farms account for 70% of the UAA and have an average area of I I ha per
farm. At the other end of the scale, 0.4% of farms exclusively employ regular non-family labour and comprise 2.4% of total UAA. The remaining farms employ varying proportions of regular non-family labour in their workforce.
Normally, as the size of farm increases so does the percentage of regular
non-family workers in the labour force; farms with only 20% of non-family labour average 40 ha in area while those with a labour force consisting exclusively of non-family workers have an average area of 77 ha.
Farms where the workforce comprises more than 50% non-family regular labour
account for 4% of all farms and 18% of total UAA, the average UAA per farm
being 73 ha. By contrast, the remaining 96% of farms account for 82% of total
UAA and have an average size of only 12 ha.
A G R I C U L T U R A L S T R U C T U R E 3 7
Breakdown of farms and UAA non-family labour
according to the percentage of regular in the farm's total AWIJ
% regular non-family labour in the farm's total AWU
Breakdown of total (%) Average
UAA per farm
h a Number of
farms UAA
0 % 20 - < 40%o 4 0 - < 5 0 % 50 - < 60%o 60 - < 80%o 80 - < 10096
l0ßo/o Total
92.7 70 .2
0 . 6 1 . 6 2 . 0 6 . 4 l . l 4 . 2 1 . 0 3 . 7 | . 2 5 . 5 1 . 0 6 . 0 0 . 4 2 . 4
l l
40 4 8 5 7 56 70 9 1 7 7
100 1 0 0 t 5
0 - < 5 0 % o 50 - < 100%o
96.4 82.4
3 . 6 1 7 . 6
t 2 7 3
Source: 1975 Farm Structure Survev.
3. Capital
73. The level of capital investment in agriculture is influenced mainly by the
use of new technology, by the expansion of farm output and by the
moderniza-tion of agriculture including an increase in farm size.
Precise quantitative data on the level of capital investment in agriculture are not available in all Member States and so a detailed comparative analysis of its use throughout the Community is not possible. However, at the macro-level, Eurostat data relating to depreciation and to gross fixed capital formation, as specified in national accounts, give a reasonable indication of the magnitude of
the capital investment needed to support modern agriculture. In addition, at the
micro-level, data emanating from the Farm Accountancy Data Network (FADN)
throw additional light on the capital needs of farms at different levels of development.
3 8 A G R I C U L T U R A L S T R U C T U R E
Depreciation
74. The capital depreciation rate relates to previous capital investment. The
level of depreciation taken as a percentage of final agricultural production, per ha of UAA or per active person employed in agriculture, presents a good, if not an
exact, basis for comparison of the level of capital investment among the Member
States. Depending on which indicator is used a particular ranking in the use of
capital by Membei States may be established. (t) Each of the selected indicators
suggests that in the FR of Germany, Belgium and Luxembourg the use of capital
is most intensive while it is least intensive in Ireland and ltaly (Table 71). It should be noted however, that in terms of depreciation per ha UAA, the Netherlands (220 EUA) ranks highest in the Community while in terms of depreciation per active person employed in agriculture it ranks only number 5 with a figure of 1560 EUA, being exceeded by Belgium (1920 EUA), the United Kingdom (1 690 EUA) and the FR of Germany and Luxembourg (l 630 EUA each). In terms of depreciation as a percentage of final agricultural production, however, the Netherlands (5.7%) ranks lowest in the Community, reflecting a fairly high level of added-value in agriculture per unit of capital input.
Gross fixed capital formation
75. Data relating to gross fixed capital formation, presented in terms of EUA
per ha UAA and per active person in agriculture, reflect the current evolution of capital investment in agriculture. Each of these indicators shows that capital formation in the Netherlands at 580 EUA per ha UAA and 4 170 EUA per active person employed in agriculture is substantially greater than elsewhere in the Community, with the FR of Germany and Belgium occupying the next two places in the ranking and Ireland and Italy again occupying the lowest positions.
76. These rather substantial differences in capital investment between Ireland
and Italy on the one hand and the Netherlands, the FR of Germany and Belgium on the other give an indication of the prospective financial cost of modernizing agriculture in the former two countries.
(') Because of lack of the necessary data, Denmark is not included in ttris analysis.
A G R I C U L T U R A L S T R U C T U R E 3 9
Capital per ha and per annual work unit
77. A somewhat similar picture relating to the use of capital in Member States
emerges when data available at the micro-level are analysed (Table 72). Thus,
the FADN data, relating to three groups of farms in each Member State-less
than 80%. 80 to 120% and more tltan 120% of the comparable income (cf.
Directive 72/159/EEC, Article 4.lFagain show levels of capital investment per
ha which are generally much higher than elsewhere in the Netherlands, Belgium
and the FR of Germany and much lower than elsewhere in Ireland and in the
United Kingdom. In the case of the United Kingdom, however, an average size
of farm which is very much higher than that of other Member States tends to bias the level of capital investment per ha downwards so that the resulting figure should not be taken as indicating a less than adequate use of capital per farm in
this Member State. Indeed. within all Member States the level of capital used per
ha varies very little as between farms with less than 80% and more than 120% of the comparable income.
78. The level of capital used per AWU gives a clearer picture of the relative :.lation as between farms of different levels of development and between
Iember States. In all Member States the level of investment per AWU increases
quite substantially from the lower to the higher income farms, while the highest
investments are in evidence in the Netherlands, the FR of Germany, Luxem-bourg and Belgium and the lowest in Italy and lreland.
Mechanization
79. The density of tractors varies from one region to another, the average for
the community as a whole being 5 per 100ha UAA (1975); the figure for
Scotland is only one tractor, whereas that for Baden-Württemberg is 14 (Table
100). Size of farm and farm organization are probably the main reasons for these differences. There are also considerable differences in tractor size. For instance, 46% of tractors in the East-Midlands region of the United Kingdom have an engine powei exceeding 50h.p., whereas only 5% are this powerful in Val d'Aoste (Italy).
80. The Farm Structures Survey suggests that 79% of all dairy cows are
-itt"O mechanically at Community level. At Member State level this figure varies from 42% in Ireland to 960Ä in Denmark. In regions with a low dairy cow
40 A G R I C U L T U R A L STRUCTURE
density, as in Liguria and Sicily (Italy) the corresponding figure is no more than 6% (Graph 5).
81. At Community level, the degree of mechanization of cereals and
sugar-beet harvesting is very high at 85% or 860Ä, but only 54% of potatoes are
harvested entirely on a mechanical basis. However, the survey has taken account
only of the highest degree of mechanization, i.e. machinery which copes with
most of the various harvesting processes. Simple reapers and binders and potato
lifters are not included in these figures. Thus, there are some regions where
highly mechanized harvesting techniques are not used at all, due no doubt, to
the small area of the crops concerned (Table 100 and Graph 6).
Farmland prices and lease rents
82. The continuing increase in farmland prices adds a further and signifrcant
dimension to the capital profile of agriculture. As has been the case in past years, statistical data on farmland prices are available from six of the nine Member States only, the exceptions still being ltaly, Luxembourg and lreland. These data suggest that in the Netherlands, Belgium and the FR of Germany farmland prices on average are roughly twice as high as in Denmark, between three and four times as high as in England, Wales, Northern Ireland and France and six to seven times as high as in Scotland. All six Member States recorded
fairly substantial increases in farmland prices in 1978/77. Land prices in the
Netherlands, already the highest in the Community, increased by between 50%
and 60% in 1977/76 and by a further 33% to 36% in 1978/77. A continuing
upward pressure on farmland prices is also in evidence in the United Kingdom,
particularly in England, Wales and Northern lreland, in Denmark, in Belgium and in the FR of Germany. Only in France, where land prices are still relatively
low by comparison with most of the other Member States, and in Scotland did
the price increase remain within modest proportions in 1978/77 (Table 68).
83. Data on lease rents are available from four Member States only, France, the
Netherlands, Belgium and the United Kingdom. These data suggest that the
evolution of lease rents in three of the four Member States, the exception being
France, took place on a much more modest scale than that of farmland prices. In
Belgium rents increased by no more than 2.8 to 3.5%, depending on the type of
land in question, as opposed to increases to 14 to 20% in land prices. In the four Member States concerned lease rents represent only between 0.8 and 1.9% of
EI]
N
%
ffi
m
PERCENTAGE OF DAIRY COWS FOR WHICH MILKING MACHINERY IS USED
r975
< 50% 5 0 - < 7 0 % 70 - < g0o6 80 - <gooÄ 7 9oo/o
GRAPH 5
PERCENTAGE OF THE AREA UNDER CEREALS FOR WHICH COMBINE HARVESTERS ARE USED
1975
Ef
<-soo/o
N so - <Too/o m 7 o - < B o % o ffi 80- <eoo/o m >eoo/o
GRAPH 6
A G R I C U L T U R A L S T R U C T U R E 4 3
the value of farmland. This low return, allied to the restrictive nature of the
tenancy legislation in some Member States, which has already been mentioned
in previous reports, means that there is little chance of increasing the rate of
land mobility for structural reform purposes through leasing. And so, given the
progressive increase in farmland prices, the potential development farmer has
little chance in ths situation of acquiring the extra land which he needs for farm
modernization purposes (Table 69).
lnterest rates
84. The cost of capital, as exemplified in the prevailing rate of interest,
continues to increase thus further compounding the problem of capital formation
in agriculture. The rate of interest payable on farm loans is roughly twice as great in the United Kingdom, Ireland and Denmark as in other Member States in the Community (Table 67). lt has now reached a level in these three Member States where it must constitute a significant barrier to farm development, particularly in the case of farmers who must, of necessity, borrow relatively large sums of money for this purpose.
To some extent the adverse effects of high interest rates are mitigated by various
types of interest rate subsidies which are granted by individual Member States
for specific types of farm loans. Details of such.subsidies are available in the 1978 Report.
4. Part-time farming
85. According to the 1975 Structures Survey some 37% of all farms are
'full-time farms', where the farm holder works full time on the farm.(t) This low figure is'due to the large number of part-time farms in ltaly. In all the other Member States the proportion of full-time farmers is higher than the EEC
average, being more than 50% in all States except the FR of Germany, and as
high as 72% in the United Kingdom.
(') All further comments on 2 200 hours per year and A G R . R E P . 1 9 7 9
PERCENTAGE OF TOTAL WORKING POPULATION EMPLOYED PRINCIPALLY IN AGRICULTURE
r975
1 l o / o
l - < 5 %
s - < r o %
lO- < 2Oo/o 2O'< 3Oo/o 30 et + o/o
SOURCE:
EEC Labour Force Sample Survey 1977; Deutschland 1979
tl
m
T
w
m
r
GRAPH 7
A G R I C U L T U R A L S T R U C T U R E 4 5
The dividing line between part-time farmers and those whose main occupation is
farming is often drawn at 50% of time worked on the farm. On this basis, 56% of farm holders in the Community are mainly occupied in farming.
Between 1970 and 1975, the number of full-time working farm holders in the
Community of Six, decreased more sharply (3% per annum) than the number of
total farms. (t) The decline was sharp (5% per annum) in the case of farm holders who spend less than 25% of their working time on the farm; by contrast the number of those spending 50-100% of their annual working time on the farm increased by I % per annum (Table 87 and Graph 7).
86. In the 1975 survey data were obtained for the first time linking time
worked on the farm with other gainful activities. Of all farmers 2l% had a gainful activity outside their farm, but the proportion varies in relation to time worked on the farm. Only 3% of full-time farmers, have a second gainful activity, in contrast to roughly 50% for the part-time farmers who spend less than half of their annual working time on the farm. Part-time farmers who have no other gainful activity are in reality under-employed. In effect, except in cases
of illness, they represent a type of hidden unemployment (Table 92).
87. Other gainful activity is most common in the south of the FR of
Germany. It is least common in most areas of France. In the Community some 26% of such activity is on a self-employed basis while 74% is on a paid
employment basis (Table 104). These percentages vary among regions and in
accordance with the percentage of working time on the farm. Paid employment
is most common in the FR of Germany (e.g. Rheinland-Pfalzl. 89%) and Italy.
In France, and more particularly in the United Kingdom, self-employed
activi-ties predominate (Graph 8).
88. The results of the 1975 Structures Survey also allow for the first time the
possibility of estimäting the production potential of part-time farms. Full-time farms occupy 68% of total UAA. By contrast part-time farms on which the
owner works less than 25% of his annual working time represent no more than
9% of total UAA. The corresponding figures for farms on which the owner
works between 25 and 50%, and 50 to 100% of his time on the farm are 7%
and 16% respectively. All part-time farmers occupy 34% of UAA on 64% of
farms. have 25% of LU. and contribute 43% of AWU.
PERCENTAGE OF FARMERS HAVING ANOTHER GAINFUL ACTIVITY 1975
E
N
m
w
m
l lOo/o
lO - < 2Oo/o 20- < 30%
30 - 1 4Oo/o 2 4oo/o
No figures available for Ireland
A G R I C U L T U R A L S T R U C T U R E 4 7
89. The percentage of full-time farmers in the total varies according to
farming enterprise. Full-time farms account for 59% of all dairy farms, for 80%
of cows and for 74% of milking-machine insallations. In the case of permanent
crops, however, full-time farms (25% of all farms) cover only 34% of the total area. They also account for only 42% of the two-wheeled tractors used. Part-time farms have a correspondingly large proportion of tractors (37 %), particularly the two-wheeled type (58%). Compared with their share of UAA,
they are more strongly represented in poultry and sheep farming, as well as in
vegetable growing, and, particularly, in permanent crops (Table 93).
90. As regards farm organization, part-time farms tend to be more extensive
(exception: poultry, vegetable and, in particular, permanent crops). This applies
especially to livestock farming in general and especially to dairy farming. Livestock farming tends to become more intensive as working time on the farm
increases. On average, part-time farm holders spend less than 25% of their
working time on the farm, keep 12 cows and 56 LU per 100 ha UAA compared with a full-time farmer's 36 cows and 114 LU (Table 95).
5. Productivity
91. Changes in agricultural productivity in the Community in recent years are
measured in this section in terms of (a) growth in the productivity of labour and
(b) growth in yields per ha. Such changes, however, can be measured with any
degree of accuracy only over the long term.
92. Measured in terms of constant (1970) prices, final agricultural production
(United Kingdom excepted) increased at an average annual rate of 1.8% in EUR
8 between '1968' and'1977'. During the same period, agricultural employment
and total UAA for EUR 9 declined at an average annual rate of 4.2% and0'6%
respectively. Labour productivity for EUR 8 measured in terms of final
agricul-tural production increased annually by 6.3% at Community level; this figure
varied from 3.9% in Denmark to 7.8% in Belgium. In Belgium the increase in
labour productivity was due to a greater than average decline in the active farm population; by contrast in Denmark the twin effects of much lower than average rate of growth in final agricultural production and a lower than average rate of decline in the active agricultural population were the main factors contributing to