White Rose Research Online [email protected]
Universities of Leeds, Sheffield and York
http://eprints.whiterose.ac.uk/
This is an author produced version of a paper published in Journal of Rail and Rapid Transit.
White Rose Research Online URL for this paper: http://eprints.whiterose.ac.uk/43164/
Published Paper
Garnham, John E, Fletcher, David I, Davis, Claire L and Franklin, Francis J (2011)
Visualisation and modelling to understand rail rolling contact fatigue cracks in three-dimensions. Proceedings of the Institution of Mechanical Engineers, Part F: Journal of Rail and Rapid Transit, 225 (2). pp. 165-178.
Visualisation and modelling to understand rail rolling
contact fatigue cracks in three-dimensions
J E Garnham1, D I Fletcher2, C L Davis1*, F J Franklin3
(1) School of Metallurgy and Materials, University of Birmingham, UK (2) Department of Mechanical Engineering, University of Sheffield, UK
(3) School of Mechanical & Systems Engineering, University of Newcastle upon Tyne, UK
[* Corresponding author: [email protected]]
Abstract
The paper presents an extensive survey of experimental data on rolling contact fatigue (RCF) crack shape and propagation characteristics in rails removed from service, where such cracks are angled to the rail axis. The data includes re-analysis of previously published experimental data to extract crack shape information and new experimental work on crack shapes at different stages in the early RCF life. Periods from initiation (ratcheted 'flake cracks') have been considered through very early growth to the limit of one prior austenite (PA) grain and on to rail-head visual cracks. Techniques included multi-sectioning through single cracks and crack zones, on used rail and test discs, to build up real 3D data on crack shapes and propagation characteristics. This data has been compared with the UK rail system guidance charts relating to visual crack length and respective vertical depth; all data fell within the indicated guidance zones. The configuration of such angled cracks, typically found in curves, so aligned due to the vector of both lateral and longitudinal traction, rather than just axially, was identified as an important case for modelling. A fracture mechanics based model has been developed to predict mode I and II stress intensity factors for such cracks covering multiple PA grains. An important geometry effect is revealed by which a contact approaching a crack angled to the rail axis is effectively ‘offset’ from the approach direction considered in 2D models, thereby resulting in lower predicted peak stress intensity factor values, compared with 2D, for the prediction of crack growth rates.
Keywords
1.0 Introduction
1.1 Different scales of crack growth
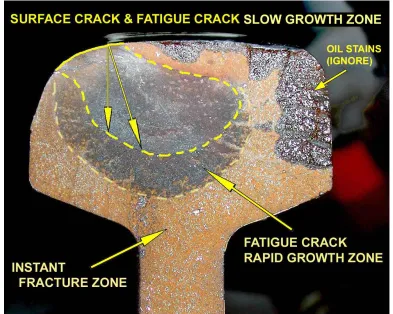
Metallurgical research into the development of cracks in rails is driven by both safety concerns (especially for new or innovative grades of steel) and the requirement to reduce the cost of rail maintenance and replacement. Improvements in steel quality over the last 40 years have meant that the incidence of very large, brittle, non-metallic inclusions causing fatigue initiation deep within the rail head and sudden rail fracture are now rare. Most concern in recent decades has been to better understand the development of RCF cracks initiated at, or very near, the rail head surface. As these are visual (up to a point) their growth can be monitored by various non-destructive evaluation (NDE) methods and can be managed by rail head grinding (i.e. artificial wear). Such practices, together with requisite traffic stoppages, are expensive; however if not managed correctly, RCF cracks can grow to a critical size with eventual surface spalling or, more seriously, downward branching and propagation resulting in a broken rail (Figure 1).
It is therefore imperative to develop accurate models of the growth of such cracks with an
understanding of initiation and growth from the 'pre-micro', sub prior austenite (PA) grain size scale of < 20!m (PA grains are typically between 20 and 80 !m in diameter for standard, pearlitic rail), moving through to the 'micro' scale of single and clusters of PA grains (~ 20 to 500 !m crack length) and then on to the greater 'macro' scale with crack growth extending millimetres through numerous PA grains reaching through the complete depth of the strain-altered near-surface
microstructure and beyond. At these and later stages, cracks become visually apparent and are liable to branch under the action of residual and bending stresses, influenced by multiple wheel loadings, sleeper spacing, sub-structure support and other large scale features.
The contact mechanics of the wheel-rail interface can also be viewed on this micro and macro scale. On the macro scale the shape of the contact zone and the location of maximum (Hertzian) stress is determined by the rail and wheel geometries, contact stresses and axial, transverse and spin creepage (traction) forces. On a micro scale there are many (surface roughness) asperity contacts within the 'macro' wheel-rail contact patch, resulting in high strains within a few microns of the rail surface. At the macro level dry contact conditions produce high traction / friction coefficients bringing the highest stresses to the rail surface but at lower traction coefficients typical of water-lubricated contact there will be a maximum stress zone sub-surface. Between this and the surface high strain zone, there will be a less strained matrix [1, 2]. Multiple wheel passes cause the surface to become ratcheted with plastic deformation of asperities and the formation of 'flakes'; i.e. eventual plasticity exhaustion and mass crack initiation beneath the flakes at this sub PA grain size scale. In dry conditions, most of these micro-cracks are removed by wear before significant growth, although 'dry' wear rates can be reduced by the 'third body layer' of oxide and compounded biological detritus on the rail surface [3].
1.2 The influence of fluids on crack growth
geometries. However, when considering cracks in three dimensions (3D) several problems with this growth mechanism become apparent. First, the lateral size of all but the smallest cracks will exceed the contact patch dimensions, making it impossible for the contact to seal (and therefore pressurise) the crack. Second, the contact may run with a lateral offset to the crack mouth, again preventing it sealing all but the smallest cracks. Third, in situations with multiple cracks it is possible that
internal links between cracks exist within the rail, again preventing pressurisation. This is discussed by Fletcher et al, [7], and while it reduces the attractiveness of fluid pressurisation as a mechanism there are as yet no internal crack pressure measurements to prove the existence or absence of the mechanism. Cases in which pressurisation may occur include highly conformal rail-wheel contact, although wheel management and rail grinding always tries to avoid conformal contact. In addition, even incompletely sealed cracks may experience a pressure spike through the squeeze film
lubrication mechanism and crack propagation would be facilitated by crack face lubrication [8].
Some of such cracks can propagate to a size detectable by various non-destructive evaluation
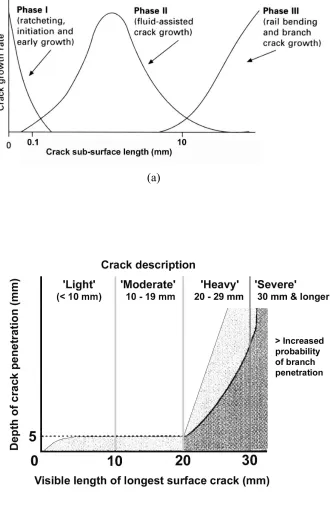
(NDE) methods. Figure 2a (based on Figure 9.1 of [4]), shows 3 regimes of crack growth; this paper addresses the 3D aspects of RCF crack initiation and growth within the first two zones, before rail flexing as a beam becomes significant. From Figure 2b (a RCF crack visual length / vertical depth guidance diagram for the UK rail network [9]) it can be seen that the first two crack growth regimes of Figure 2a are situated within the 'light' crack zone of Figure 2b with crack depths not expected to exceed 5 mm.
1.3 Material data
Most material mechanical property data is obtained from tests where the material is loaded and/or fatigued in tension. Such data cannot always be directly related to the wheel-rail contact situation where the rail head and contacting wheel are subject to high compressive stresses [10] (in excess of tensile yield) together with multi-directional creepage (tangential, frictional) forces at the rail surface such that the near-surface microstructure is both compressed and re-aligned. This includes the more ductile non-metallic inclusions within the structure. The most common, standard type of rail steel microstructure, pearlite, performs far better than indicated by its tensile properties as its microstructure is altered by the contact forces. However, testing steels on the railway using experimental rails is both time-consuming and expensive. RCF behavioural data has therefore usually been obtained both by examination of used rails and by laboratory twin-disc testing with rail and wheel steel discs experiencing similar degrees of compressive and tangential stress, albeit unidirectional and climatically consistent [2, 4, 11 - 19]. Such data has been used to develop models, initially in 2D [13 - 15] and more recently in 3D [19 - 22]. Understanding crack initiation and growth in 3D at the pre-micro, micro and macro scale is required to accurately model rail life for the various steel grades and microstructures as there are implications of crack shape for growth rate prediction zones shown in Figure 1. This paper includes the most recent work on understanding the 3D geometry of RCF cracks and on how their alignment with the rail affects predictions about their growth which could not be made using pure 2D models and crack representations.
2.0 Experimental evidence
Many previous models of RCF crack growth have assumed a simple semi-circular or semi-elliptical crack geometry. To support further developing models of RCF crack growth it was decided to bring together existing data on crack morphology, fill the gaps in knowledge with new experimental evidence and conduct quantification of the crack shapes observed.
Past work on rails removed from service [4, 14, 15, 21, 22, 23] has shown that vertical, angled sections normal to, and through the centre of, an RCF crack, i.e. cut in the direction of the
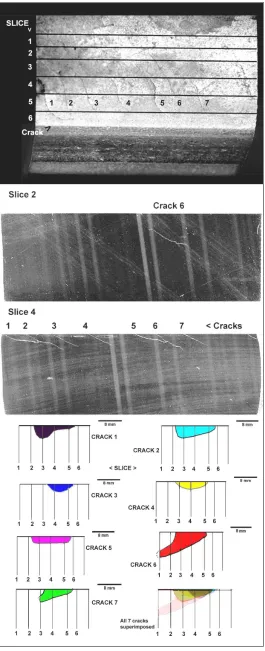
maximum vector of composite creepage, give a clearer picture of crack severity and microstructural strain than seen with axial and transverse vertical sections, where crack branching and multi-crack interactions can confuse the analysis. With discs from twin disc tests, creepage and tractive force are unidirectional and therefore circumferential sections most clearly reveal crack characteristics and strained microstructural features. Recent work has involved crack shape determinations from axial slices across a cluster of clearly visual, RCF cracks in used track. Logging crack surface positions plus sub-surface lengths and depths on each slice has enabled the approximate crack shapes relative to the transverse rail-head profile to be determined; these results are compared with external data [24, 25, 26].
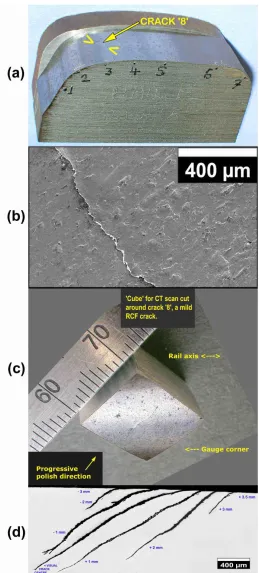
The visual crack characteristics and finer (ratcheted) flaking patterns of used rail and test disc surfaces have been observed via polishing and etching followed by optical and scanning electron microscopy (SEM). It has been observed on examples of worn high rails from curves, in the region where RCF cracks form, that there is a maximum density of adhering flakes in this zone located just above the gauge corner zone of maximum wear (Figure 3). Rail heads have been sectioned axially, transversely and at angles normal to the visual RCF cracks (Figure 3). Following this, the shape of some of these cracks was assessed by progressive sectioning and/or by progressive grinding and polishing through, and at 90° to, the complete crack visual length thus building up a three dimensional (3D) picture of the crack shape and related microstructure sub-surface (Figure 3). Specific initiating cracks have also been examined by focussed ion beam (FIB) nano-erosion and imaging on the electron microscope to reveal features of the strained microstructure in 3D [20, 21].
2.2 Crack characteristics for cracks up to PA grain size
It has been established in earlier work [13, 15, 17, 19, 20] that in standard grade, pearlitic rail steels subject to cyclic wheel-rail contact, where some pro-eutectoid (PE) ferrite was present at PA grain boundaries, there was strain-partitioning between the PE ferrite and the fully pearlitic zones. Earlier ductility exhaustion took place in the PE ferrite than in the fully pearlitic zones and hence RCF crack initiation and propagation took place along the PE ferrite / pearlite boundaries [20, 21]. Variations in PE ferrite content for a standard 220 grade 0.55%C rail steel were achieved by heat treating test discs to both minimise and maximise PE ferrite content thus the effect of PE ferrite content on RCF life could be assessed and modelled [14 - 16]. Comparison between used rail examinations and twin-disc tests, including tests to various percentages of average RCF life (where 100% or 'full life' was defined as when the eddy current system was triggered, which has been found to be for crack depths of between 200 and 800 !m [15, 18, 27]), established that such initiation occurred only on favourable orientated and the most highly strained PE ferrite zones and that crack growth was greatly slowed once the limit of such a boundary had been reached [20, 21]. After initiation (at 10% > 20% life), RCF cracks were mostly restricted to a single PA grain length until well into RCF life (> 55% life).
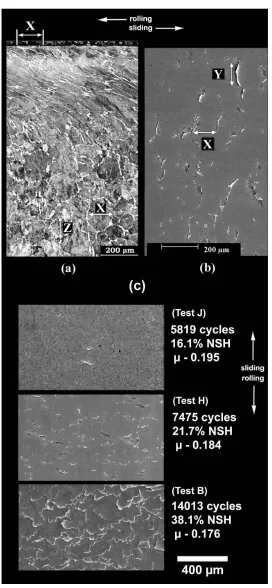
The 3D aspects of this very early crack formation and deformation of the surrounding micro-structure were examined by both multiple polishing of a microsection across single 'flakes' (i.e. ratcheted) cracks on PE ferrite boundaries and flanking PA grains [21] and also by comparing the pattern of initiated flake cracks in microsections to the pattern of surface flaking on the test discs (Figure 4). This showed that crack growth along PE ferrite boundaries was additionally restricted by the transverse 3D limits of individual grains leading to discrete flake cracks early in RCF life
and -1% creepage), only after ~50% RCF life did the discrete flakes grow beyond the boundaries of single PA grains, both to propagate deeper and transversely join on the contact surface [21].
2.3 Crack characteristics beyond a single PA grain size
Once the contact microstructure has experienced enough (rail-vehicle or twin-disc test) loading cycles such that near-surface and surface grains have been considerably elongated in the strain direction, early cracks which have propagated along and down highly strain-elongated PE ferrite zones now enter the sub-surface zone of maximum strain and thus become more subject to the strain field rather than microstructural control. To accommodate this, propagating cracks were observed to have 'jumped' across PA grains from one PE ferrite zone to another [20, 21]. This behaviour was also indicated by focussed ion beam (FIB) examination of an area approaching and including a singular surface crack [21]. This method erodes out material around the crack on a microsection, and then erodes the block containing the crack in quarter micron stages, with each stage SEM imaged, thus building up a 3D picture of the crack shape and flanking features. Further development to bring out micro-structural detail with this method is ongoing.
It was observed in the longest RCF life twin disc test involving a disc in the minimum percent PE ferrite condition that cracks additionally initiated at pearlite nodule or PA grain boundaries. No PE ferrite was present at these boundaries, thus indicating a possible RCF crack initiation mechanism for longer life, higher grade rail with minimal to near-zero PE ferrite, in which the usual PE ferrite mechanism could not act. In past twin-disc work [2] involving lubricated tests at varied contact stresses and creepages, the degree to which (post one PA grain) crack propagation followed and branched along continual PA grain boundaries appeared dependent upon the degree of aligned strain within the microstructure; the more severe the strain, the more aligned the propagation within the strain field.
2.4 Crack characteristics for visible cracks extending through multiple PA grains
Once a crack becomes easily visually apparent on the rail surface (i.e. without magnification), at its centre it has generally propagated near to, or beyond, the sub-surface zone of strain-altered
microstructure (typically 3-5 mm deep). When barely visually apparent (e.g. ~ 3 mm visual length) it will not have grown beyond this zone. Table 1 shows data for crack shapes taken from angled and axial sections through used rails (e.g. Figure 3). Sections were cut vertically and angled normal to visual crack alignment and were shown to have an approximate part-elliptical shape; the centre cut would therefore show the deepest part of the crack. As shall be seen, with larger and more extensive cracks the situation is more complex. This data has been used for modelling the shape of just-visual, surface cracks in Section 3.
The multi-slice axial sectioning and analysis of crack shapes on each slice (Table 1, Rail 'X')
allowed a picture of crack shapes in the transverse plane to be constructed by joining crack limits in each plane (Figure 5). This shows that there can be considerable variability in shape for these 'moderate' cracks, with the deepest crack extending sub-surface beyond the visual crack in a similar way to the crack shown in the fracture face of the broken rail in Figure1.
Further track data has been obtained from two reports: one based on data from UK and German rail (DB) networks [24*, 25] and the other from Canada [26]. (* [24] gives measuring method used.) New analyses of the cracks shown in the reference images have been conducted. The UK / DB 'visual crack length / sub-surface crack depth' data was fitted by two straight-line relationships with good agreement [25]. This and the Canadian data have been superimposed on the Railtrack
data and for the Canadian data (Table 2) may reflect the rail experiencing a different mix of traffic and thus contact zones and conditions. Where traffic is mainly of one vehicle type, regular RCF crack patterns have been observed [28]. Additionally, the aspect of one crack shielding the next and their respective sizes requires consideration in understanding the observed crack shapes.
It should be noted that the larger (heavy and severe) RCF cracks considered above, which have grown (on the rail surface) to a size and shape beyond an angled straight line (typically 'S shaped' or ‘mirror S-shaped') which has not yet been included in the modelling below. Some of the cracks shown in Figure 5 were at the stage of beginning to propagate into 'mirror S-shapes’. Modelling to date has considered initial (microstructure-based) micro-crack propagation and 'just-visual', angled, 'straight', RCF cracks.
3.0 Modelling
3.1 Modelling of crack initiation and very early growth.
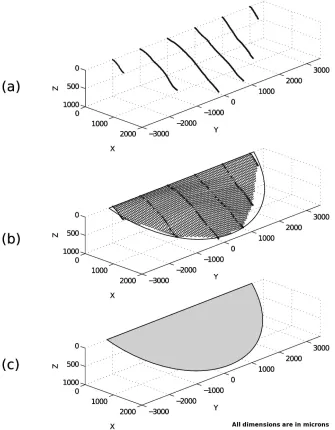
As mentioned in the previous section, with standard rail grades, flake crack formation and initial propagation has been along the boundaries of PE ferrite at PA grain boundaries. This has been modelled in 2D for various PE ferrite widths at the PA boundary by Franklin et al [14, 16]. A 3D model of this very early crack formation and growth is being developed; the PA grain distribution has been represented by a volume (with periodic boundaries) of convex polyhedra (Figure 7a) with paths for potential crack growth along the representative PA grain boundaries mapped over time as the microstructure deforms plastically. Two example cracks are shown in Figure 7b. The linking of these cracks at the surface is similar to some aspects seen on rail and test disc observations but this needs further study and model refinement. The general sub-surface crack shapes, truncated ellipses as shown in grey in Figure 7, compare favourable with the shape of the crack shown in Figure 3 which is discussed further in the following section. Further details are to be the subject of a separate publication currently under preparation.
3.2 Modelling visual cracks extending through multiple PA grains.
3.2.1 Visualising medium sized inclined cracks.
Many models of RCF have been developed based on semi-circular or semi-elliptical cracks [29 - 33]. With the detailed crack morphology data collected from rails removed from service in the current work it was possible to examine how closely real cracks approach this assumed shape. The cracks discussed here are of ‘light’ size, that is, they have dimensions of a few millimetres, covering multiple PA grains, but they have not yet extended to the size at which branching towards the rail surface or down towards the rail foot takes place.
The paths of the cracks revealed by serial sectioning of the rail (Figure 3) were manually digitised using the software G3Data [34]. For each crack this gave data on a 2D plane with the third
dimension supplied by the separation between the planes examined. Plotting the data in 3D, and taking the origin at the approximate centre of the crack mouth, gave Figure 8a. To do this, it was assumed that the crack mouth was a straight line, which is a simplification of the real crack shown in Figure 3.
in the Matlab Least Squares Geometric Elements library developed at the NPL Centre for Mathematics and Scientific Computing [35].
The resulting circular fit representing the crack front is shown in Figure 8b, and the schematic representation of the crack in Figure 8c. It was found that the crack could be closely represented by a segment of a circle, although this was not a semi-circle. The circle was of radius 2.7mm, with the crack mouth running for 149° around the circle. The circle was at an angle of 29° below the
horizontal, matching very closely the angle of 30° used in many models. !
As an alternative to fitting a circle it would also have been possible to fit an ellipse to the crack morphology data. A close approximation to the circular segment described above is a semi-ellipse with semi-axes of approximately 1.9 and 2.6 mm, and this may offer a more simple way to model the crack geometry rather than considering a segment from a circle [33].
3.2.2 Crack growth prediction for cracks at an angle to the rail longitudinal direction
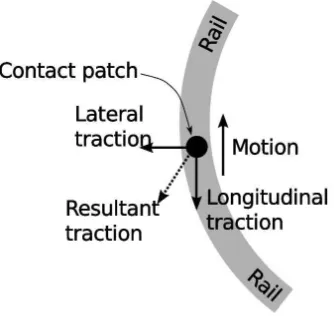
Most existing models of stress intensity factor calculation and crack growth rate prediction for 'light' to 'moderate' size cracks in Phase II (contact stress driven crack growth, cracks of a few tens of microns up to tens of millimetres, see Figure 2a) assume any surface traction to be aligned with the reverse of the direction of contact patch motion, in the longitudinal direction along the rail. This is realistic in many cases, but in curves there is significant lateral traction, and its effect is reflected in the alignment of cracks at these locations (Figures 3, 5, 9). Having conducted work to visualise this type of crack, it was decided to assess the effect on stress intensity factors for rolling contact fatigue of the crack “rotation” relative to the conventionally considered orientation.
To investigate the effect of this lateral traction a further development was made of the “2.5d” stress intensity factor calculation method [33, 36] to allow consideration of lateral traction. This
modelling approach is a hybrid approach using a fully three dimensional stress field as input, but using two-dimensional Greens functions to convert stresses to stress intensity factors as these are currently the best available in a generally applicable form [37]. It is capable of predicting mode I and II but not mode III stress intensity factors. In the previous versions of the “2.5d” model it was assumed that cracks were aligned normal to the rail longitudinal direction, and that the contact passed either directly over the crack or with a small offset to the side [33]. Stresses driving crack growth are calculated by resolving stresses parallel and normal to the crack face along line A-B (Figure 10a). Although a fully 3D model would consider the distribution of stress across the entire crack face the use of 2D Greens functions necessitates the assumption that stress along this deepest line through the crack controls overall behaviour. Good correlation found with fully 3D models based on the body force method [38] has previously supported this assumption for the crack and contact geometries for which data were available. The treatment of crack face friction within the model has been described fully in a previous publication [36], and assumes that crack faces are either locked or able to slide in mode II shear according to the normal load pressing them together and the friction coefficient between them. Where sliding occurs, the stress available to drive further growth of the crack is reduced by the stress required to overcome the crack face friction.
This “rotation” is only possible if the contact patch is taken to be circular. An alternative approach allowing calculations for elliptical contact patches is to rotate the direction of traction while leaving the contact patch and its motion aligned with the x-axis. This is illustrated in Figure 10d but has the disadvantage that the stress to be determined on the line A-B lies in a fully 3D space, rather than on one of the coordinate axes. Resolving stress normal and parallel to the crack face therefore becomes much more complex than in the current models. The calculation is perfectly possible, but would need careful validation to ensure the contributions of each component of stress were considered correctly. The approach here is restricted to considering a circular contact patch, but is a simple development from previous versions of the 2.5d model, and is therefore easily validated against them.
3.3 Results
3.3.1 Longitudinal traction only
To verify the newly written code the new model for combined lateral and longitudinal traction was initially run with longitudinal traction only. The results for mode I and II stress intensity factors from the original “2.5d” model were found to be indistinguishable from those produced by the updated model under these conditions, indicating that the rotation of the contact and motion in xx and yy directions has been correctly implemented.
3.3.2 Combined longitudinal and lateral traction
To examine combined lateral and longitudinal traction a case with a resultant surface traction coefficient of 0.18 was modelled, with a ratio of lateral to longitudinal traction of 0.90. This gives an angle of 42° between the resultant traction and the rail longitudinal direction. For comparison, results for longitudinal traction only with a traction coefficient of 0.18 and 0.134 were also
produced, the lower coefficient representing the longitudinal component of the resultant traction. A crack face friction coefficient of 0.18 was used in all the cases, which modelled a 5mm radius plane semi-circular crack at 30° below the surface. Maximum Hertzian contact pressure was 900 MPa, and the contact radius was 10 mm. In all cases a fully slipping contact was assumed, so the traction distribution was equal to the pressure distribution multiplied by the traction coefficient.
Figure 11 shows the mode I and II stress intensity factor results, using the radial distance from the contact centre to the origin at the centre of the crack mouth rather than the more usual axial distance. The radial distance is the correct measure of how far the contact is from the crack when motion of the contact does not follow the local coordinate axis in models combining lateral and longitudinal traction. This radial distance is actually the y-axis displacement between the contact and crack mouth centres, since motion of the contact is parallel to the direction. Figure 12 displays the motion of the contact across the cracks for both models, with contact positions marked at peaks in the predicted stress intensity factor.
From the plots in Figure 11 it can be seen that the peaks in stress intensity factor occur at very similar radial distances from the origin, regardless of the inclusion of lateral traction, or the
magnitude of longitudinal traction. Reducing the longitudinal traction coefficient from 0.18 to 0.134 causes only a small reduction in the magnitude of the stress intensity factor peaks. Introduction of lateral traction, while keeping the resultant traction coefficient at 0.18, produces a large reduction in the first mode I peak of stress intensity factor at contact positions around -0.01 m. The second mode I peak and those for mode II are only slightly below those for the case of longitudinal traction acting alone at a coefficient of traction of 0.134.
direction of motion, and not the change in longitudinal traction. Figures 12 shows the positions of the contact relative to the crack at which peak stress intensity factors are produced. The first mode I peak is produced just as the contact is about to move onto the crack centreline (labelled A-B in Figure 12). With longitudinal traction alone, the contact is moving along the axis aligned with the centreline of the crack. Movement along this axis minimises the distance from the contact to the line A-B on which stresses are calculated for any particular contact distance from the crack, i.e. for a particular radial distance between the contact and the crack, it would be expected to maximise stress on the crack face.
For the case with lateral traction, the crack is rotated relative to the direction of motion. As the contact meets the mouth of the crack (a radial distance of 0.01m away from the origin) the contact centre remains offset from the axis on which the crack centreline A-B lies. Lateral offset of the contact to the side of a crack has previously been modelled to understand the effect of lateral contact patch relocation following girding maintenance and was shown to produce great reductions in stress intensity factor for only small offsets [33]. The same process of stress intensity factor reduction through lateral offset between the contact and the crack is taking place through the geometry of a contact crossing a “rotated” crack.
4.0 Conclusions
The paper presents an extensive survey of experimental data on crack shape and propagation
characteristics for RCF cracks. For cracks in rails removed from service this includes the orientation of the cracks relative to the rail longitudinal direction. The data includes re-analysis of previously published experimental data to extract crack shape information, and new experimental work to fill gaps in knowledge about crack shape at different stages in the early life of RCF cracks. The period from crack initiation in the form of ratcheted 'flake cracks', through very early growth to the limit of one PA grain (typically between 20 and 70 microns in diameter before strain-elongation) and on to cracks which become visually apparent (i.e., without magnification) on the rail surface has been considered. Observation techniques included multi-stage sectioning and polishing of cracks and crack zones, on used rail and test discs, on all these scales, to build up real 3D data on crack shapes and propagation characteristics. RCF cracks smaller than ~ 12 mm surface length (i.e. 'light' and some 'moderate' cracks ) typically have a semi-circular (or semi-elliptical) shape, whereas longer cracks can have a complex shape, with the deepest part of the crack not being below the surface breaking crack.
A comparison was made between the crack size data collected and the UK rail system guidance charts relating to visual crack length and corresponding crack depth. It was found that all the cracks examined fell within the region of expected crack depth and size covered by the chart, i.e. no cracks were found which would be deeper or more extensive than the worst cases predicted by the industry guidance chart.
lower predicted peak stress intensity factor values than if a 2D approximation to the system had been used in the prediction of crack growth rates.
5.0 Acknowledgements
Thanks are due to EPSRC for project funding of Rail Research UK 'Projects A2 & A6'; Dr Rengen Ding, Dr Xinjiang Hao and Nick Southey for experimental support (all - School of Metallurgy and Materials, University of Birmingham, UK).
6.0 References
01) Johnson, K.L. "Contact Mechanics", Cambridge University Press, 1985.
02) Beynon, J. H., Garnham, J. E., Sawley, K. J., "Rolling contact fatigue of three pearlitic rail steels." Wear, 1996, 192, 94-111.
03) Busquet, M., Baillet, L., Bordreuil, C., Berthier, Y. 3D finite element investigation on the plastic flows of rolling contacts—correlation with railhead microstructural observations, Wear Vol. 258 (2005) 1071–1080
04) Fletcher, D. I., Franklin, F. J., Kapoor, A., "Rail surface fatigue and wear", Wheel-Rail Interface Handbook, (Chapter 9), Eds. R. Lewis & U. Olofsson, Woodhead Publishing, Cambridge, UK, 2009.
05) Fletcher, D. I., Hyde, P., Kapoor, A. "Full scale trials and modelling to investigate fluid penetration of rolling contact fatigue cracks", Proc. 7th Int. Conf. “Contact Mechanics and Wear of Rail / Wheel Systems,” Brisbane, Australia, 24th-27th September, 2006.
06) Dirks, B., Emblom, R., "Prediction model for wheel profile wear and rolling contact fatigue", Proc. 8th Int. Conf. “Contact Mechanics and Wear of Rail / Wheel Systems,” Florence (Firenze), Italy, 15th-18th September, 2009, 935-943.
07) Fletcher, D. I., Hyde, P., Kapoor, A. Investigating "uid penetration of rolling contact fatigue cracks in rails using a newly developed full-scale test facility, Proc. IMechE Vol. 221 Part F: J. Rail and Rapid Transit, 2007, 35-44.
08) Bogdanski, S. A rolling contact fatigue crack driven by squeeze "uid #lm. Fatigue Fract. Eng. Mater. Struct., 2002, 25, 1061 – 1071.
09) Railtrack "Permanent Way Special Instruction No. 4, Issue 2 (2002-01-14)"
10) Kapoor, A., Beynon, J. H., Fletcher, D. I. and Loo-Morrey, M., Computer simulation of strain accumulation and hardening for pearlitic rail steel undergoing repeated contact, IMechE Journal of Strain Analysis for Engineering Design, 2004, 39(4), pp 383.
11) Bolton, P. J., Clayton, P., Rolling-sliding wear damage in rail and tyre steels", Wear, 1984, 93, 145-165.
13) Eden, H. C., Garnham, J. E., Davis, C. L., “Influential microstructural changes on rolling contact fatigue crack initiation in pearlitic rail steels”, Materials Science and Technology, 2007, 21 (6), 623–629.
14) Garnham, J. E., Franklin, F. J., Fletcher, D. I., Kapoor, A., Davis, C. L., “Predicting the life of steel rails”, Proc. IMechE, Part F: J. Rail and Rapid Transit (special issue), 2007, 221 (1), 45-58.
15) Garnham, J. E., Davis, C. L., “The role of deformed microstructure on rolling contact fatigue initiation.” Wear, 2008, 265, 1363-1372. (Paper initially presented in the Proc. 7th Int. Conf. “Contact Mechanics and Wear of Rail / Wheel Systems,” Brisbane, Australia, 24th-27th September, 2006.)
16) Franklin, F. J., Garnham, J. E., Fletcher, D. I., Davis, C. L., Kapoor, A., “Modelling rail steel microstructure and its effect on wear and crack initiation”, Wear, 2008, 265, 1332-1341. (Paper initially presented in the Proc. 7th Int. Conf. “Contact Mechanics and Wear of Rail / Wheel Systems,” Brisbane, Australia, 24th-27th September, 2006.)
17) Garnham J. E., Beynon, J. H., "Dry rolling-sliding wear of bainitic and pearlitic steels." Wear, 1992, 157 (1), 81–109.
18) Fletcher D. I., Beynon, J. H., "Development of a machine for closely controlled rolling contact fatigue and wear testing." Journal of Testing and Evaluation, 2000, 28(4), 267–275.
19) Garnham, J. E., Davis, C. L., '"Rail Materials", Wheel-Rail Interface Handbook, (Chapter 5), Eds. R. Lewis & U. Olofsson, Woodhead Publishing, Cambridge, UK, 2009.
20) Franklin, F. J., Garnham, J. E., Davis, C. L.,Fletcher, D. I., Kapoor, A., "The evolution and failure of pearlitic microstructure in rail steel: observations and modelling", Wheel-Rail
Interface Handbook, (Chapter 10), Eds. R. Lewis & U. Olofsson, Woodhead Publishing, Cambridge, UK, 2009.
21) Garnham J. E., Davis, C. L., "Very early stage rolling contact fatigue crack growth in pearlitic rail steels", Proc. 8th Int. Conf. “Contact Mechanics and Wear of Rail / Wheel Systems,” Florence (Firenze), Italy, 15th-18th September, 2009, 61-71. Paper submitted to Wear, September, 2009.
22) Franklin F. J., Gahlot, A., Fletcher, D. I., Garnham, J. E., Davis, C. L.,
Three-dimensional modelling of rail steel microstructure and crack growth", Proc. 8th Int. Conf. “Contact Mechanics and Wear of Rail / Wheel Systems,” Florence (Firenze), Italy, 15th-18th September, 2009. Paper submitted to Wear, September, 2009, 53-59.
23) Garnham J. E., Ding, R-G., Davis, C. L., Ductile inclusions in rail, subject to compressive rolling-sliding contact". Paper submitted to Wear, February, 2010.
24) Carroll, R., INNOTRACK – Corus Report INT-SP43-26—071029-D-RCF measurement, 2008.
26) Magel, E., Sawley, K J., National Research Council of Canada - Centre for Transportation Technology (CSTT) Report No. CSTT-RYV-CAT-090, 2006. [Report available from E Magel (CSTT).]
27) Garnham J. E., Beynon, J. H., "The early detection of rolling-sliding contact fatigue cracks" Wear, 1991, 144, 103 – 116.
28) Fischmeister, E., et. al., From rail surface cracks to rail breaks – Recent investigations and results of research at the Wiener-Linien Metro System, Proc. 8th Int. Conf. “Contact Mechanics and Wear of Rail / Wheel Systems,” Florence (Firenze), Italy, 15th-18th September, 2009, 333-339.
29) Bower, A. F. “The influence of crack face friction and trapped fluid on rolling contact fatigue cracks.” ASME Journal of Tribology, 110, 1988, 704–711.
30) Kaneta, M., Yatsuzuka, H., Murakami, Y. Mechanism of crack growth in lubricated rolling/sliding contact. ASLE Transactions, 28(3), 1985, 407-414.
31) Kaneta, M., Suetsugu, M., Murakami, Y., Mechanism of surface crack growth in lubricated rolling/sliding spherical contact. ASME Journal of Applied Mechanics, 53, 1986, 354-360.
32) Kaneta, M., Murakami, Y. Propagation of semi-elliptical surface cracks in lubricated rolling/sliding elliptical contacts. ASME Journal of Tribology, 113, 1991, 270-275.
33) Fletcher, D.I. and Kapoor, A. A rapid method of stress intensity factor calculation for semi-elliptical surface breaking cracks under three-dimensional contact loading. Proc. IMechE, Part F: J. Rail and Rapid Transit, 220, 2006, 219-234.
34) G3data, Graph digitising software, http://www.frantz.fi/software/g3data.php, retrieved March 2010.
35) Least Squares Geometric Elements library for MatLab, NPL Centre for Mathematics and Scientific Computing,
http://scicomp.npl.co.uk/eurometros/gen_report.php?category=distributions&pkey=14&subform=y es, retrieved March 2010
36) Fletcher, D.I. and Beynon, J.H. A simple method of stress intensity factor calculation for inclined surface breaking cracks with crack face friction under contact loading. Proc. IMechE, Part J, Journal of Engineering Tribology, 213, 1999, 481-486.
37) Rooke D.P., Rayaprolu D.B. and Aliabadi M.H., Crack line and edge green's functions for stress intensity factors of inclined edge cracks, Fatigue and Fracture of Engineering Materials and Structures , 1992, 15(5), 441-461.
38) Kaneta M. and Murakami Y., Propagation of semi-ellitpical surface cracks in lubricated rolling/sliding elliptical contacts, ASME Journal of Tribology , 1991, 113, 270-275.
2010 - 3D paper - Tables & Figure Captions
Univ. B'ham sections (1) (A) Visual surface crack length (2)
(mm)
(B) Sub-surface crack centre length
(mm)
(C) Sub-surface crack centre depth
(mm)
A - B - C ratio
260 grade, 0.81%C, 'Rail F', selected
~ 15.00 4.46 2.13 7.04 - 2.09 - 1
260 grade 0.68%C 'Rail E' - 'crack 8'
~ 5.50 2.152 1.022 5.38 - 2.11 - 1
'Rail E' - 'crack 9' ~ 2.58 0.939 0.513 5.03 - 1.83 - 1
260 grade
Rail 'X' – 'crack 4' ~ 12.69 6.44 2.54 4.99 - 2.54 - 1
Rail 'X' – 'crack 7' (3) ~ 15.42 6.64 4.49 3.43 – 1.48 - 1
Note (1) 'Rails F & E' – angled, vertical sections, normal to visual crack; 'Rail F' single section through crack centre; 'Rail E' – multiple grind & polish of angled sections, normal to crack, across complete crack visual lengths. 'Rail X' – multi-slice axial sections across a clearly visual cluster of large RCF cracks.
Note (2) Surface visual lengths include crack waviness (e.g. 'S-shaped') as specified in [24]. Note (3) 'Rail X crack 7' extends transversely sub-surface towards the rail centre beyond the
[image:15.595.69.557.114.298.2]visual surface crack (cf. Figures 1 & 5).
Table 1. RCF crack shape data from angled microsections, normal to the crack*, at crack (visual) centres. (* i.e. section taken in direction of maximum composite creepage.) and from multi-slice, axial sections. Due to rail surface flaking and staining, the exact to limits of visual cracks are difficult to assess (i.e. to +/- 0.05 mm) even with SEM, hence the closest determinations for visual lengths (~) are given.
Canadian rail axial, vertical slices. Slice reference is distance from gauge corner given in mm. Slice with deepest crack underlined.
(A) Visual surface crack length(1, 2) (mm) (B) Sub-surface crack centre length (mm) (C) Sub-surface maximum crack centre depth (mm)
A - B - C ratio
Rail sample 'C1' Data given for slices 12, 16, 21
~ 46.2 28.38 4.73 9.77 / 6.00 / 1
Rail sample 'A2' Data given for slices 10, 16, 20
~ 38.5 18.37 5.12 7.52 / 3.59 / 1
Rail sample 'B1' Data given for slices 10, 16, 20
~ 35.2 17.85 2.56 13.75 / 6.97 / 1
Rail sample 'A6' Data given for slices 9, 11, 13, 15
~ 33.0 20.60 6.02 5.48 / 3.42 / 1
Note(1) Surface visual lengths include crack waviness (e.g. 'S-shaped') as specified in [24].
Note(2) Visual length assessed from photographs in horizontal plane above rail with a correction factor for curvature of x1.1 (determined from rail-head transverse sections).
[image:15.595.66.561.484.668.2]Figure captions
Figure 1. Complete fracture of rail from a developed RCF crack (outlined). Note that RCF crack depth vertically assessed is less than crack depths taken at tangent to surface curvatures containing RCF visual, surface crack . Also note that the crack extends sub-surface toward rail transverse centre. The two growth zones represent the 2nd regime (planar, rippled surface) and the 3rd regime (additional cleavage and micro-void coalescence) of standard fatigue crack growth.
Figure 2. RCF crack visual length / depth categorisation. (a) Three phases of RCF crack growth (after Fletcher [4]).
(b) Railtrack (now Network rail, UK) RCF crack visual length / depth guidance diagram [9].
Figure 3. Examination of 3D aspects of just-visual RCF cracks.
a) Transverse slice of worn, 260 grade rail head containing a singular RCF crack ('Rail E crack 8') situated just above the gauge corner. The worn rail profile is set against an un-used rail head profile in order to compare wear with the RCF crack location. (Crack size data is given in Table 1.). Probable traffic direction from bottom to top of image.
b) SEM view of crack centre at the same orientation as above; surface flaking at maximum at this profile location.
c) Extraction of block of material with vertical cuts around crack with faces angled so that they are normal and parallel to crack. The indicated face was then progressively ground and polished across complete crack length in nine stages to determine crack 3D shape and related microstructure. d) The crack shape and size at each of the nine polish stages; the photographic images have been super-imposed on to one image for comparison and to build up a view of the 3D shape of the crack. The distances of the polish stages from the crack (visual) centre polish stage are given in +/- mm.
Figure 4. 3D aspects of crack initiation and propagation on highly strained, PA grain boundaries (usually defined by PE ferrite) situated normal to the strain direction. The dimensions and spacing of early crack formation matches PA grain size. Figure 4a (a circumferential section through a rail test disc subject to 45% of average RCF life test cycles) and Figure 4b (the respective test disc surface flaking pattern) illustrate the comparative, similar dimensions between flake size and shape and PA grain size, shape and orientation, with PA grains defined by (white) PE ferrite at the
boundaries. 'X, Y and Z' represent 3D directions, of equal dimension, of a cube which contains an unstrained PA grain (Figure 4a). This 'Y' dimension also matches the transverse limit of an early flake crack and the 'X' dimension also matches the circumferential spacing between two flake cracks (Figure 4b). In Figure 4c shows surface flakes at different stages of life, from top to bottom, showing the formation of discrete flakes at 35% average RCF life, the eventual transverse joining of some discrete flakes at average 45% RCF life and mass flaking on one of the discs tested to 100% RCF life, (Test identification reference 'J, H & B', respectively).
Figure 6. Data from UK, German and Canadian networks [25, 26] superimposed on to the Railtrack (now Network rail, UK) RCF crack visual length / depth guidance diagram (assuming linear scale between 0-5 mm for crack depth) [9].
Line X-X Line fit for INNOTRACK-Corus for UK network 220 grade, 260 grade and 400 HB ProRail, from [25].
Line
+
-+
Line fit for INNOTRACK-Corus for DB network 260 grade, from [25]. * A2, A6, B1, C1 – CSST (260 grade equivalent) data, from [26]; cf. Table 2.* F , Ec8, Ec9 – University of Birmingham 260 grade rail data, angled sections normal to visual crack centres ('Rail F, Rail E crack 8 & '9', respectively), cf. Table 1 & Figure 3.
* Xc4, Xc7 - University of Birmingham 260 grade rail data, multi-slice axial sections across seven visual cracks (cf. Rail X), cf. Table 1 & Figure 5.
Figure 7. Modelling of initial crack growth.
a) The unit volume of convex polyhedra representative of a PA grain network used by Franklin et al. via the Voronoi method with periodic boundary constraints [22].
b) Development of the model showing crack propagation down PA boundaries with general crack shape part-ellipses superimposed.
Figure 8. Visualisation of just-visual RCF crack on rail removed from service [cf. Table 1; Figure 3]. (a) Data on crack morphology digitised from micrographs. (b) Linearly interpolated surface and fitted circular segment crack front. (c) Schematic representation of the crack.
Figure 9. Schematic representation of the traction in the longitudinal and lateral directions
experienced by the high (outer) rail on a curve. Note that these are tractions experienced by the rail not the vehicle, so the outward pointing lateral traction is correct.
Figure 10. Considerations of tractive forces and relative wheel rail motions on schematic representation of small RCF crack and its angle to rail axis / direction of travel. (a) Crack with centreline AB and mouth aligned normal to the direction of traction, traversed by a circular contact patch with semi-elliptical pressure profile. Traction direction is opposite to the direction of motion. (b) Crack with centreline AB and mouth aligned normal to the resultant traction, which is at angle ! to the direction of motion. Motion is in parallel to the x-axis. (c) Definition of a local axis system xx-yy, in which the traction is parallel to the xx-axis, crack mouth parallel to the yy-axis, and motion occurs in a combination of xx and yy directions. (d) Crack with centreline AB traversed by an elliptical contact patch.
Figure 11. Stress intensity factor plotted against radial distance of the contact centre from the top centre of the crack mouth. Crack size 5mm radius 30° below horizontal, contact pressure 900MPa, contact radius 10mm, crack face friction coefficient 0.18; (a) Mode I. (b) Model II.
Figure 12. Contact positions producing peak (minimum or maximum) stress intensity factors for a 5mm radius crack below a 10mm radius contact (cf. Figure 10). For stress intensity factor
(a)
[image:19.595.158.488.99.606.2](b)
(a) (b)
(a)
(b)
(c) (d)
[image:27.595.103.527.126.650.2](a)
(b)
[image:28.595.100.526.86.671.2](a) (b)
[image:29.595.98.518.86.580.2](c) (d)
![Table 2. RCF crack data from multiple, axial aligned, vertical slices through sample lengths of rail on the Canadian network; data taken from [26]](https://thumb-us.123doks.com/thumbv2/123dok_us/7995520.207118/15.595.69.557.114.298/table-multiple-aligned-vertical-sample-lengths-canadian-network.webp)