International Journal of
Molecular Sciences
ISSN 1422-0067 www.mdpi.com/journal/ijms Article
Variation in Stability of Endogenous Reference Genes in
Fallopian Tubes and Endometrium from Healthy and Ectopic
Pregnant Women
Alpha K. Gebeh 1, Emma L. Marczylo 2, Akwasi A. Amoako 1, Jonathon M. Willets 1 and Justin C. Konje 1,*
1 Endocannabinoid Research Group, Reproductive Science Section, Department of Cancer Studies
and Molecular Medicine, University of Leicester, Leicester, LE2 7LX, UK;
E-Mails: [email protected] (A.K.G.); [email protected] (A.A.A.); [email protected] (J.M.W.)
2 Systems Toxicology, MRC Toxicology Unit, Hodgkin Building, University of Leicester,
Lancaster Road, Leicester, LE1 9HN, UK; E-Mail: [email protected]
* Author to whom correspondence should be addressed; E-Mail: [email protected]; Tel.: +44-116-252-5826; Fax: +44-116-252-3162.
Received: 5 January 2012; in revised form: 10 February 2012 / Accepted: 27 February 2012 / Published: 2 March 2012
Keywords: ectopic pregnancy; fallopian tubes; endometrium; reference genes; geNorm; NormFinder; quantitative real time PCR; NAPE-PLD
1. Introduction
Ectopic pregnancy is a common early pregnancy complication in which the embryo implants outside the uterus. It is estimated to complicate 2% of pregnancies and, more importantly, is still associated with significant morbidity and mortality in many parts of the world [1,2]. The most common site is the fallopian tube (98.3%) with sites such as the ovary, cervix and abdomen only being rarely affected [3]. Sadly, the mechanisms that underlie tubal implantation are still not fully understood despite the expansion in ectopic pregnancy related research over the last decade [4]. Over the years, various tools have been employed to elucidate these mechanisms with one such tool being quantitative real time PCR (RT-qPCR).
RT-qPCR is an important and common technique used to examine changes in gene expression levels in various pathological states. It offers an advantage over other methods such as northern blotting because of its high sensitivity, specificity, ease of use and broad dynamic range [5,6]. This feature albeit advantageous comes with a price i.e., that it is susceptible to variation in extraction and experimental processes including differences in RNA extraction, presence of contaminating DNA, efficiency of cDNA synthesis etc. [7–9]. These inherent vulnerabilities make normalisation of RT-qPCR data an absolute requirement in the interpretation of experimental data. One of the most common methods of normalisation is the use of a reference gene whose expression should remain constant under various experimental and disease conditions [10]. This compensates for variation in the experimental conditions since both the gene of interest and the reference gene are exposed to the same experimental conditions. However, in practice, it is unlikely that a perfect reference gene exists since several studies have demonstrated that reference genes themselves can be influenced by drugs, chemicals and disease states [9]. Therefore, the validity of gene expression results generated by this method of normalisation is highly dependent on the optimal selection of endogenous reference genes to which the genes of interest are to be normalised.
from the human geNormTM reference gene kit (PrimerDesign, Southampton, UK) i.e., ACTB, ATP synthase, H+ transporting, mitochondrial F1 complex, beta polypeptide (ATP5B), Beta-2-microglobulin (B2M), Cytochrome c-1 (CYC1), Eukaryotic translation initiation factor 4A isoform 2 (EIF4A2), GAPDH, Tyrosine 3-monooxygenase/tryptophan 5-monooxygenase activation protein, zeta polypeptide (YWHAZ), Ubiquitin C (UBC), Ribosomal protein L13a (RPLA13), Succinate dehydrogenase complex subunit A flavoprotein (SDHA), Topoisomerase (DNA) 1 (TOP1), and RN18S1. We also evaluated the effects of using each of these genes on the expression of a test gene of interest in order to demonstrate the effects (if any) that arbitrary selection of reference genes may have on data interpretation. For this aspect of the study, the gene expression of N-acylphosphatidyl-ethanolamide phospholipase D (NAPE-PLD) in human endometrium was used. The choice of NAPE-PLD is partly due to our group’s interest in evaluating the role of the endocannabinoid system in early mammalian reproduction including tubal transport of embryos. For further details on NAPE-PLD and the endocannabinoid system and their role in tubal transport and early pregnancy, see reviews by Taylor et al. [12], Bambang et al. [13] and Gebeh et al. [4].
2. Results and Discussion
2.1. Patient Characteristics
There was no significant difference in age (yrs) in both the follicular (n = 4) and luteal (n = 4) phase control groups. However, as expected, the age of the non-pregnant group was significantly higher than that of the ectopic group (n = 4). The mean ± SD was 43.00 ± 6.27, (follicular), 41.25 ± 4.43 (luteal) and 28.75 ± 2.87 (ectopic pregnancy), p = 0.004 (one way ANOVA). There was no significant difference in BMI (kg/m2) between the three groups studied. The mean ± SD were as follows: 27.00 ± 4.97 (follicular), 29.38 ± 9.86 (luteal) and 27.50 ± 4.40 (ectopic pregnancy), p = 0.877 (one way ANOVA).
2.2. General Expression Levels of Endogenous Reference Genes
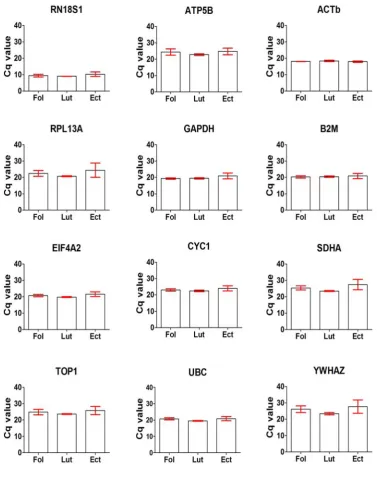
Figure 1. Expression levels of the 12 reference genes evaluated as shown by their Cq values in 12 fallopian tube samples. Samples were from the follicular (Fol, n = 4), luteal (Lut, n = 4) phase and ectopic pregnancy (Ect, n = 4). Cq values were obtained from the data output file of ABI PRISM 7000 and are inversely proportional to amount of mRNA template material present.
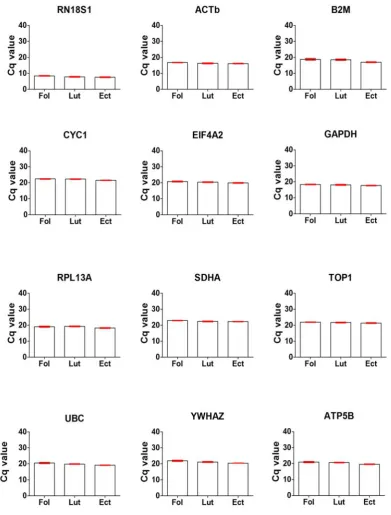
Figure 2. Expression levels of the 12 reference genes evaluated as shown by their Cq values in 12 endometrial samples. Samples were from the follicular (Fol, n = 4), luteal (Lut, n = 4) phase and ectopic pregnancy (Ect, n = 4). Cq values were obtained from the data output file of ABI PRISM 7000 and are inversely proportional to amount of mRNA template material present.
2.3. Analysis of Reference Gene Stability in Fallopian Tubes 2.3.1. geNorm Algorithm
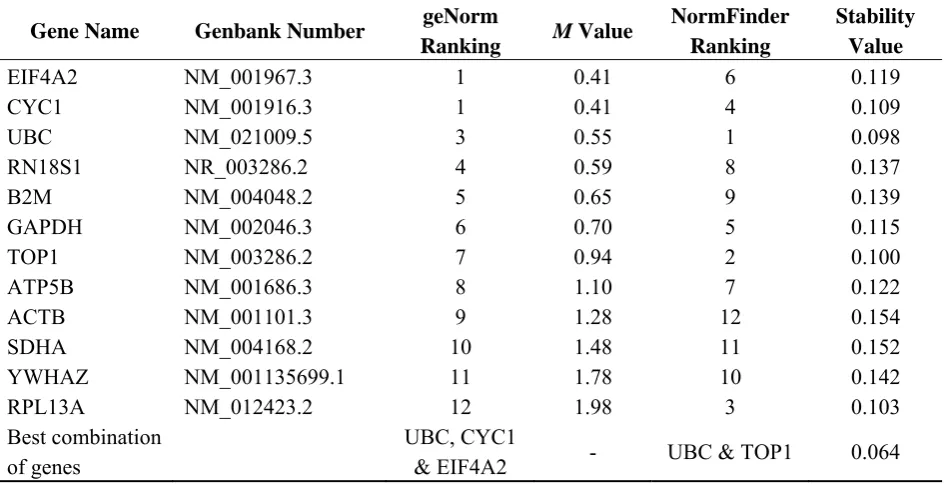
The cut-off for an acceptable reference gene is one with an M value of less than 1.5. The ranking of the reference genes evaluated starting from the most stable (lowest M value) to the least stable (highest M value) for these experiments were as follows: EIF4A2/CYC1 > UBC > RN18S1 > B2M > GAPDH > TOP1 > ATP5B > ACTB > SDHA > YWHAZ > RPL13A (Table 1). The M value for YWHAZ and RPL13A were greater than 1.5 indicating that they are unsuitable for use as internal control genes in fallopian tubes.
Table 1. Ranking of reference genes in fallopian tubes using the geNorm (M value) and NormFinder (stability value) algorithms. Lower M or stability value indicates more stable expression and vice versa. Genes highlighted in bold were those ranking consistently in the top half of the table using both algorithms.
Gene Name Genbank Number geNorm
Ranking M Value
NormFinder Ranking
Stability Value
EIF4A2 NM_001967.3 1 0.41 6 0.119
CYC1 NM_001916.3 1 0.41 4 0.109
UBC NM_021009.5 3 0.55 1 0.098
RN18S1 NR_003286.2 4 0.59 8 0.137
B2M NM_004048.2 5 0.65 9 0.139
GAPDH NM_002046.3 6 0.70 5 0.115
TOP1 NM_003286.2 7 0.94 2 0.100
ATP5B NM_001686.3 8 1.10 7 0.122
ACTB NM_001101.3 9 1.28 12 0.154
SDHA NM_004168.2 10 1.48 11 0.152
YWHAZ NM_001135699.1 11 1.78 10 0.142
RPL13A NM_012423.2 12 1.98 3 0.103
Best combination of genes
UBC, CYC1
& EIF4A2 - UBC & TOP1 0.064
geNorm also calculates the pairwise variation between two normalisation factors (NFn and NFn+1
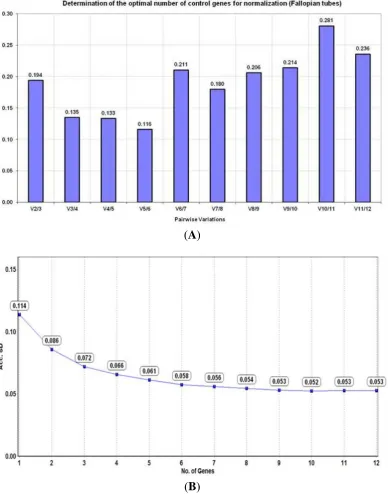
genes) which gives an indication of the optimal number of reference genes to be used for appropriate normalisation of RT-qPCR data. A pairwise variation value of ≤0.15 is the acceptable cut-off below which the addition of an extra reference gene does not confer any advantage over the existing genes. Although EIF4A2 and CYC1 were the two best genes, their pairwise variation value was greater than 0.15 (V2/3 = 0.194) indicating that additional genes are required for adequate normalisation. Based on
analysis by geNorm, EIF4A2, CYC1 and UBC (V3/4 = 0.135) was considered the minimum
Figure 3. Determination of the optimal number of reference genes for normalization in fallopian tubes (n = 12) based on their (A) pairwise variation (V) analysis using the geNorm algorithm and (B) accumulated standard deviation (Acc. SD) using the NormFinder algorithm.
(A)
(B) 2.3.2.NormFinder Algorithm
were as follows (starting from the most stable to the least stable): UBC > TOP1 > RPL13A > CYC1 > GAPDH > EIF4A2 > ATP5B > RN18S1 > B2M > YWHAZ > SDHA > ACTB (Table 1). The most suitable combination of genes was UBC and TOP1 (combined stability value = 0.064) which was different to that obtained using geNorm. Manual inspection of the data suggests that SDHA and YWHAZ had a wide intragroup variation while SDHA, YWHAZ and RPL13A had wide intergroup variation making them less suitable as reference genes.
The accumulated standard deviation (Acc. SD) was calculated using NormFinder and is an indicator of the optimal number of reference genes to be used for data normalisation. The lowest Acc. SD (theoretically indicating the optimal number of reference genes) was obtained when 10 genes were used (Acc. SD = 0.052) (Figure 3). However, TOP1 and UBC were selected by NormFinder as the best pair of genes for normalisation in fallopian tubes (Table 1).
2.4. Analysis of Reference Gene Stability in Endometrium 2.4.1. geNorm Analysis
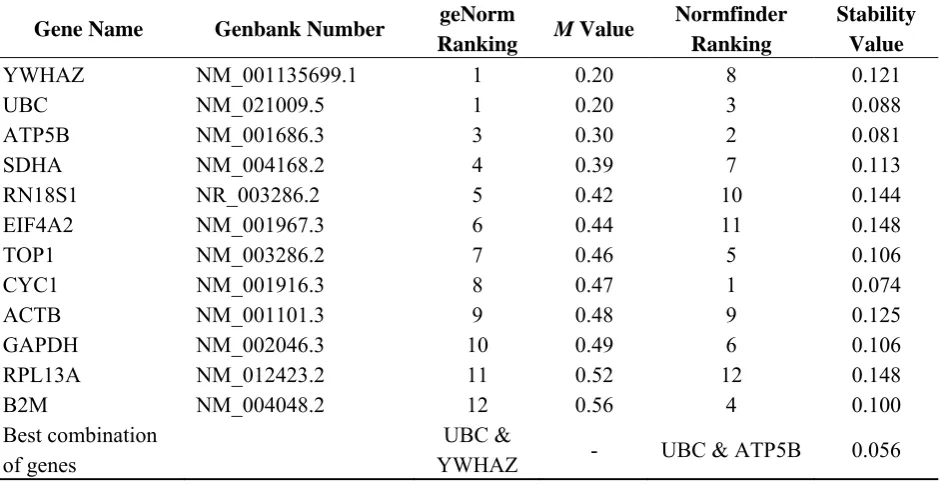
[image:8.595.65.537.507.749.2]The ranking of the reference genes in the endometrium was different to that of the fallopian tubes and were as follows (starting from the most stable to the least stable): YWHAZ/UBC > ATP5B > SDHA > RN18S1 > EIF4A2 > TOP1 > CYC1 > ACTB > GAPDH > RPL13A > B2M (Table 2). Unlike the fallopian tubes, the M value for each of the 12 genes was less than 1.5 indicating that they were all reasonably stable enough to be used as reference genes in the endometrium.
Table 2. Ranking of reference genes in endometrium using the geNorm (M value) and NormFinder (stability value) algorithms. Lower M or stability value indicates more stable expression and vice versa. Genes highlighted in bold were those ranking consistently in the top half of the table using both algorithms.
Gene Name Genbank Number geNorm
Ranking M Value
Normfinder Ranking
Stability Value
YWHAZ NM_001135699.1 1 0.20 8 0.121
UBC NM_021009.5 1 0.20 3 0.088
ATP5B NM_001686.3 3 0.30 2 0.081
SDHA NM_004168.2 4 0.39 7 0.113
RN18S1 NR_003286.2 5 0.42 10 0.144
EIF4A2 NM_001967.3 6 0.44 11 0.148
TOP1 NM_003286.2 7 0.46 5 0.106
CYC1 NM_001916.3 8 0.47 1 0.074
ACTB NM_001101.3 9 0.48 9 0.125
GAPDH NM_002046.3 10 0.49 6 0.106
RPL13A NM_012423.2 11 0.52 12 0.148
B2M NM_004048.2 12 0.56 4 0.100
Best combination of genes
UBC &
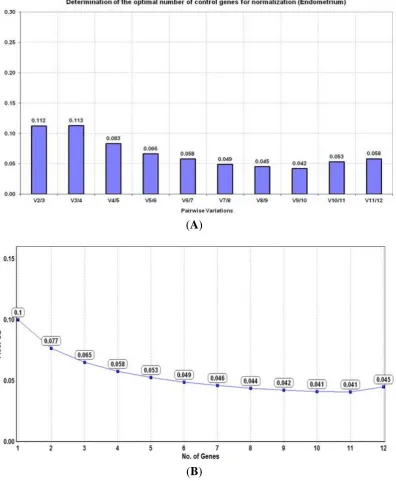
Pairwise variation calculated by geNorm indicated that the combination of the top two reference genes in the endometrium i.e., UBC and YWHAZ were stable enough to be used for normalisation without the addition of a 3rd gene (V2/3 = 0.112) (Figure 4). Although this was acceptable (V ≤ 0.15), the
[image:9.595.103.500.240.722.2]lowest pairwise variation score was obtained with a combination of 10 candidate genes (V9/10 = 0.042).
Figure 4. Determination of the optimal number of reference genes for normalisation in the endometrium (n = 12) based on their (A) pairwise variation (V) analysis using the geNorm algorithm and (B) accumulated standard deviation (Acc. SD) using the NormFinder algorithm.
(A)
2.4.2. NormFinder Algorithm
The ranking of the reference genes based on their stability values were as follows (starting from the most stable to the least stable): CYC1 > ATP5B > UBC> B2M > TOP1 > GAPDH > SDHA > YWHAZ > ACTB > RN18S1 > EIF4A2 > RPL13A (Table 2).
The lowest Acc. SD (0.041) was obtained using a combination of 10 reference candidates for normalisation (Figure 4). However, the most suitable combination of genes recommended by NormFinder was UBC and ATP5B (combined stability value = 0.056) which as with the fallopian tubes, was different to that obtained using geNorm (Table 2).
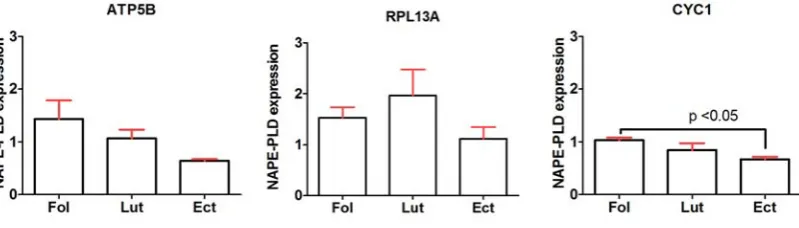
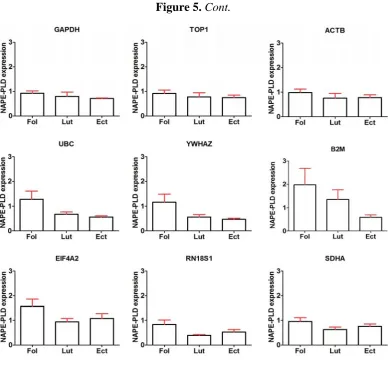
[image:10.595.100.500.596.710.2]2.5. The Effect of Choice of Using Different Reference Genes to Normalise Data for Genes of Interest In order to test the effects of using various reference genes on the gene expression profiles, the relative expression of NAPE-PLD mRNA in the endometrium was calculated using each of the 12 reference genes as internal controls as well as using the recommended combinations of genes from both geNorm and NormFinder. The results of our analysis indicated that depending on the reference gene selected, NAPE-PLD mRNA appeared either unchanged in all three study groups (e.g., GAPDH, TOP1), attenuated in the luteal phase and ectopic pregnancy compared to the follicular phase (e.g., UBC, YWHAZ) or that expression may be increased in the luteal phase compared to the follicular phase or ectopic pregnancy (e.g., RPL13A) (Figure 5). Interestingly, there was a statistically significant increase in NAPE-PLD mRNA expression in the follicular phase compared to the ectopic pregnancy group (p < 0.05; one-way ANOVA) using CYC1 as the internal control. This significance was not observed when using each of the other genes as internal control (Figure 5).
Figure 5.Cont.
2.6. General Discussion of Results
To the best of our knowledge, this is the first study that has evaluated the most commonly used reference genes for normalisation of RT-qPCR data in ectopic pregnancy. The absence of such a study may be due to multiple factors including the possibility that researchers may have relied on extrapolating data from similar studies in other tissues or may be selecting internal control genes without thorough validation. Many studies have shown the variation in stability of reference gene in various tissues [14,15] and we have also shown here that a reference gene which may be deemed more suitable in one tissue type may not be suitable in another tissue type even within the same cohort of patients. Justification of the choice and number of reference genes should therefore be an essential part of RT-qPCR experiments in ectopic pregnancy as recommended by the MIQE guidelines [11].
CYC1, GAPDH and EIF4A2 indicating that these genes are likely to be the most stable for normalisation in ectopic pregnancy studies. However, it is unlikely that a single reference gene would be an ideal internal control and the use of multiple reference genes is therefore recommended to minimise bias resulting from differential expression of one reference gene. On the contrary, a combination of genes is likely to produce more accurate results since the overall variation will be minimised. Similarly, both algorithms produced consistent results with the genes ranked among the lower half of the table i.e., ACTB, SDHA, ATP5B and YWHAZ (Table 1). These genes are therefore likely to be the least suitable for use as reference genes. With regards to the endometrium, UBC and ATP5B were the only genes ranked within the top six by both algorithms suggesting that they were the most stable genes for normalisation in ectopic pregnancy studies utilising healthy non-pregnant women as control groups (Table 2). Despite the individual rankings from the endometrial samples, all the 12 genes evaluated had M values less than 1.5 (geNorm) indicating good stability.
3. Experimental Section
3.1. Ethics Statement
Ethical approval was obtained from the Leicestershire and Rutland local research ethics committee and all research procedures were conducted according to the principles expressed in the Declaration of Helsinki.
3.2. Subjects
Volunteers were recruited from the Women’s Hospital, University Hospitals of Leicester NHS Trust and were either attending as emergencies with a diagnosis of ectopic pregnancy or were non-pregnant volunteers having total abdominal hysterectomy and bilateral salpingoophorectomy (TAH & BSO) for benign gynaecological conditions such as fibroids or dysfunctional uterine bleeding. The non-pregnant were categorised into two groups based on their last menstrual period (LMP) and endometrial histology according to Noyes criteria i.e., follicular phase (days 4–9) and luteal phase (days 20–25). Exclusion criteria included women with a levonorgestrel intrauterine system (Mirena®), on prescription or recreational drugs, or with chronic medical conditions or previous pelvic inflammatory disease (PID). Fallopian tubes and endometrial biopsies were obtained from a total of 12 volunteers [ectopic pregnancy (n = 4), follicular (n = 4) and luteal (n = 4)] after written and informed consent. The choice of non-pregnant women (particularly the luteal phase) as a comparison group is consistent with current practice as it is unethical and difficult to obtain fallopian tubes from women in the first trimester of pregnancy.
3.3. Tissue Collection
Tissue biopsies were collected immediately following TAH & BSO or following salpingectomy for ectopic pregnancy, washed (to remove blood) with sterile 1X phosphate buffered saline (PBS) and placed into sterile polypropylene tubes. Samples were immediately transported to the laboratory in liquid nitrogen and stored at −80 °C for later RNA extraction.
3.4. Isolation of RNA and cDNA Synthesis
Tissues obtained (50 mg) were homogenised in a mortar and total RNA extracted using Qiagen miRNeasy mini kit (50) (Qiagen, Crawley, UK) according to the manufacturer’s instructions. The RNA obtained was treated with DNAse to eliminate contaminating DNA prior to storage at −20 °C for future use. The yield and purity of isolated RNA was determined using a Nanodrop ND-1000 UV spectrophotometer (Nanodrop technologies, Wilmington, DE, USA) and samples selected for RT-qPCR had A260/280 absorbance ratios greater than 1.9. RNA integrity was assessed using an Agilent
bioanalyser 2100 (Agilent Technologies, Wokingham, UK) and samples with RNA integrity number (RIN) of greater than seven were considered suitable for RT-qPCR.
of 20× RT enzyme and 1 µg of total RNA diluted with molecular grade water to a final volume of 9 µL. A No RT reaction (RT-minus) was included to confirm the absence of contaminating DNA. The thermal conditions for reverse transcription were 37 °C for 1 h followed by 95 °C for 5 min before storage at −20 °C for future use.
3.5. Quantitative Real-Time PCR
Experiments were performed using the human geNormTM reference gene selection kit containing validated lyophilised primer sets for 12 reference genes (PrimerDesign, Southampton, UK). All reactions were carried out in a final reaction volume of 20 μL containing 10 μL of 2× SYBR Green PCR Universal Master Mix (Applied Biosystems, Warrington, UK), 300 nM primer mix of reference genes or 900 nM of NAPE-PLD primers (genbank accession number NM_198990), 1 μL of cDNA and 8 μL of molecular grade water. Amplifications were performed starting with 95 °C for 10 min for enzyme activation, followed by 40 cycles of template denaturation step at 95 °C for 15 s, data collection for 60 s at 60 °C followed by extension at 72 °C. RT-minus and no template controls (NTC) containing molecular grade water instead of template mRNA were included with each run. No product was synthesised in the NTC and RT-minus confirming the absence of contaminating DNA. All reactions for the reference genes were performed in triplicate according to the manufacturer’s protocol using ABI PRISM® 7000 system (Applied Biosystems, Warrington, UK). Analysis of dissociation curves for all primers showed a single peak. To calculate the PCR efficiency of primers for NAPE-PLD as the test gene of interest, standard curves were constructed which showed a linear relationship between template quantity and target gene expression. The gradient of the standard curve for the target gene was used to calculate the PCR efficiency according to the formula: Efficiency (E)(%) = (A − 1) × 100 where A = 10[−1/slope of standard curve]. The PCR efficiency for NAPE-PLD was 93.1% with a linear correlation coefficient (R2) of 0.972.
3.6. Software Determination of Reference Genes Stability
For stability comparisons of reference genes, two algorithms were used i.e., geNorm version 3.5 [18] and NormFinder version 0.953 [19] according to their original publications. Data on accumulated standard deviation was obtained from the NormFinder algorithm incorporated into the GenEx software version 5.3.6.170 [20]. Details of the statistical methods used by both geNorm and NormFinder have been described elsewhere [21–23].
3.7. Gene Expression Stability Analysis
i. The highest Cq value was subtracted from all other Cq values for each gene measured. This gave a delta Cq value (ΔCq) with the highest delta Cq value being 0. All other values were less than 0.
ii. To each ΔCq value, the equation (2−ΔCq) was applied. Hence all data were expressed relative to the expression of the least expressed gene. Relative expression values were exported to geNorm and NormFinder for analysis.
3.8. Statistical Analysis
Except otherwise stated, data for the genes of interest were expressed as mean ± standard error of the mean (SEM) or standard deviation (SD) and p values obtained using one-way analysis of variance (ANOVA) followed by appropriate post hoc analysis using GraphPad Prism version 5.00 for Windows [24]. A p value of less than 0.05 was accepted as significant.
4. Conclusions
Altogether, our results suggest that certain genes may be more suitable as reference genes in fallopian tubes or endometrium than others. The current widespread use of RN18S1, GAPDH and β-actin in the absence of appropriate validation should be avoided. Despite the limited sample size, at the very least, it does emphasise the importance of a systematic process being needed to choose an appropriate reference gene, and that the arbitrary selection of internal controls genes may lead to misinterpretation of data.
Acknowledgments
The authors would like to thank Sara-Jane Mason-Birks for patient recruitment and Kate Dudek and Shashi Rana for general laboratory support. This work was funded by grants from the University Hospitals of Leicester NHS Trust and the Medical Research Council (MRC), UK. The funders had to role in the study design, data collection, analysis and interpretation or in the writing of the manuscript.
Conflicts of Interest
The authors declare no conflicts of interest.
References
1. Farquhar, C.M. Ectopic pregnancy. Lancet 2005, 366, 583–591.
2. Cantwell, R.; Clutton-Brock, T.; Cooper, G.; Dawson, A.; Drife, J.; Garrod, D.; Harper, A.; Hulbert, D.; Lucas, S.; McClure, J.; et al. Saving Mothers’ Lives: Reviewing maternal deaths to make motherhood safer: 2006–2008. The Eighth Report of the Confidential Enquiries into Maternal Deaths in the United Kingdom. BJOG 2011, 118, 1–203.
3. Pisarska, M.D.; Carson, S.A. Incidence and risk factors for ectopic pregnancy. Clin. Obstet. Gynecol. 1999, 42, 2–8.
5. Radonic, A.; Thulke, S.; Mackay, I.M.; Landt, O.; Siegert, W.; Nitsche, A. Guideline to reference gene selection for quantitative real-time PCR. Biochem. Biophys. Res. Commun. 2004, 313, 856–862.
6. Huggett, J.; Dheda, K.; Bustin, S.; Zumla, A. Real-time RT-PCR normalisation; strategies and considerations. Genes Immun. 2005, 6, 279–284.
7. Bustin, S.A. Absolute quantification of mRNA using real-time reverse transcription polymerase chain reaction assays. J. Mol. Endocrinol. 2000, 25, 169–193.
8. Bustin, S.A. Quantification of mRNA using real-time reverse transcription PCR (RT-PCR): Trends and problems. J. Mol. Endocrinol. 2002, 29, 23–39.
9. Romanowski, T.; Markiewicz, A.; Bednarz, N.; Bielawski, K.P. Housekeeping genes as a reference in quantitative real-time RT-PCR. Postepy Hig. Med. Dosw. 2007, 61, 500–510.
10. Ginzinger, D.G. Gene quantification using real-time quantitative PCR: An emerging technology hits the mainstream. Exp. Hematol. 2002, 30, 503–512.
11. Bustin, S.A.; Benes, V.; Garson, J.A.; Hellemans, J.; Huggett, J.; Kubista, M.; Mueller, R.; Nolan, T.; Pfaffl, M.W.; Shipley, G.L.; et al. The MIQE guidelines: Minimum information for publication of quantitative real-time PCR experiments. Clin. Chem. 2009, 55, 611–622.
12. Taylor, A.H.; Amoako, A.A.; Bambang, K.; Karasu, T.; Gebeh, A.; Lam, P.M.; Marzcylo, T.H.; Konje, J.C. Endocannabinoids and pregnancy. Clin .Chim. Acta 2010, 411, 921–930.
13. Bambang, K.; Karasu, T.; Gebeh, A.; Taylor, A.; Marczylo, T.; Lam, P.; Willets, J.; Konje, J. From fertilisation to implantation in mammalian pregnancy-modulation of early human reproduction by the endocannabinoid system. Pharmaceuticals 2010, 3, 2910–2929.
14. Feng, X.; Xiong, Y.; Qian, H.; Lei, M.; Xu, D.; Ren, Z. Selection of reference genes for gene expression studies in porcine skeletal muscle using SYBR green qPCR. J. Biotechnol. 2010, 150, 288–293.
15. Hoogewijs, D.; Houthoofd, K.; Matthijssens, F.; Vandesompele, J.; Vanfleteren, J.R. Selection and validation of a set of reliable reference genes for quantitative sod gene expression analysis in Caenorhabditiselegans. BMC Mol. Biol. 2008, 9, doi:10.1186/1471-2199-9-9.
16. Penna, I.; Vella, S.; Gigoni, A.; Russo, C.; Cancedda, R.; Pagano, A. Selection of candidate housekeeping genes for normalization in human postmortem brain samples. Int. J. Mol. Sci. 2011, 12, 5461–5470.
17. Taylor, A.H.; Abbas, M.S.; Habiba, M.A.; Konje, J.C. Histomorphometric evaluation of cannabinoid receptor and anandamide modulating enzyme expression in the human endometrium through the menstrual cycle. Histochem. Cell Biol. 2010, 133, 557–565.
18. geNorm, version 3.5; Center for Medical Genetics, Ghent University: Ghent, Belgium, 2007. 19. NormFinder, version 0.953; Aarhus University Hospital: Aarhus, Denmark, 2005.
20. GenEx software, version 5.3.6.170; MultiD Analyses AB: Göteborg, Sweden, 2011.
21. Vandesompele, J.; de Preter, K.; Pattyn, F.; Poppe, B.; van Roy, N.; de Paepe, A.; Speleman, F. Accurate normalization of real-time quantitative RT-PCR data by geometric averaging of multiple internal control genes. Genome Biol. 2002, 3, RESEARCH0034.1–0034.11.
23. Mehta, R.; Birerdinc, A.; Hossain, N.; Afendy, A.; Chandhoke, V.; Younossi, Z.; Baranova, A. Validation of endogenous reference genes for qRT-PCR analysis of human visceral adipose samples. BMC Mol. Biol. 2010, 11, 39.
24. GraphPad Prism, version 5.00; GraphPad Software: San Diego, CA, USA, 2009.