Self-evaluation vs. objective performance
measures: Evaluation of fidelity, presence and
training transfer in two helicopter simulator
tasks
Thesis submitted in accordance with the requirements of the University of Liverpool for the degree of Master in Philosophy, by Li Ting Wong.
Table of Contents
Abstract ... page 1
Chapter 1: Introduction ...page 2
Chapter 2: Experiment 1
Method ...page 10
Results
2.1.1: Analysis of Objective Performance Measures ………....page 16
2.1.2: Discussion………....page 17
2.2.1: Subjective Self-performance Measures………...page 19
2.2.2: Discussion………page 21
2.3.1: Subjective Measures of Fidelity...…………...……….page 21
2.3.2: Discussion………page 24
2.4.1: Subjective Measures of Training………..………...page 26
2.4.2: Discussion………page 27
Chapter 3: Experiment 2
Method ...page 29
Results
3.1.1: Analysis of Objective Performance Measures...page 34
3.1.2: Discussion………page 35
3.2.1: Subjective Measures of Presence………page 36
3.2.2: Discussion………page 40
3.3.1: Subjective Measures of Fidelity………...page 41
3.3.2: Discussion………page 44
3.4.1: Subjective Measures of Performance and Training………page 46
3.4.2: Discussion………page 50
Chapter 4: Discussion and Conclusions...page 52
Acknowledgements………..page 58
References……….page 59
1
Self-evaluation vs. objective performance measures: Evaluation of fidelity, presence and training transfer in two helicopter simulator tasks
Abstract
Simulations are widely used in aviation, medical and military training. Simulation fidelity is an important element of simulation training development. This study explores the reliability of self-evaluation of fidelity and training transfer in comparison to objective performance measures in two experiments. In Experiment 1, fifteen participants (aged 20-32, mean= 23.1) completed a target-tracking task in the HELIFLIGHT simulator at the University of Liverpool. They then underwent training on a desktop-based helicopter simulator with basic visuals and a realistic turbine rotor noise as their only motion cues before being re-tested in HELIFLIGHT. Motion cue fidelity was manipulated to explore effects on subjective post-training ratings of fidelity and self-performance.
In Experiment 2, eleven participants (aged 22-27, mean= 24.2) performed a hover task in HELIFLIGHT. As in Experiment 1, they then trained on a desktop-simulator before being retested in HELIFLIGHT. Again, cue fidelity was manipulated to explore effects on ratings of fidelity and self-performance, but also on sensation of presence.
2 Chapter 1: Introduction
Simulations are artificial environments that are designed to operationally model the features of the real environment they represent (Wignall, Denstedt, Preminger, Cadeddu, Pearle, Sweet & McDougall, 2008). Nowadays, simulations are widely used in aviation, medical and military training (Bowman & McMahan, 2007). For example, simulations have been used as training tools with the view to transfer of skills into the operating room (Seymour, Gallagher, Roman, O’Brien, Bansal, Andersen & Satava, 2002; Aggarwal, Black, Hance, Darzi & Cheshire, 2006), as well as exploration of aviation handling and manoeuvres (Lee, Sezer-Uzol, Horn & Long, 2005; Casner, Geven & Williams, 2013) and is being invested in by the military as a training tool (Lele, 2013). Simulations can take the form of something as simple as a physical object substituting the real object (for example, a wooden horse in place of a real horse), to an immersive 3D Virtual Reality simulation that affords the sensation of a physical presence in the modelled environment. The flexibility of VR simulations allows the creation of lifelike environments for the purpose of training. However, even VR simulations cannot fully replicate all aspects of the real environment, such as visual details that correspond exactly with the real world, or the stimulation of multiple senses (Gallace, Ngo, Sulaitis & Spence, 2011). Therefore, a key issue is whether the cues present in the simulation can enable transferrable learning between the simulated and real environments (Alexander, Brunyé, Sidman & Weil, 2005).
In the case of virtual reality, fidelity can be defined as “the objective degree
of exactness with which real-world experiences and effects are reproduced by a computing system” (Gerathewohl, 1969, in McMahan, Bowman, Zielinski & Brady, 2012). It is a multifaceted concept that can be broken down into different varieties (Ferwerda, 2003). Simulation development tends to emphasise the importance of
3
example, a driving simulator, with a finely-detailed out-of-window display depicting a realistic driving environment. However, exact replication of a real environment is costly, impractical (Londgridge, Bürki-Cohen, Go & Kendra, 2001), and does not help to identify components of the simulation that most assist training transfer. To emphasise training transfer, simulations should afford high functional fidelity, which is the extent to which procedural skills in the virtual environment mimic those in the real environment. With regards to our hypothetical driving simulator, this would mean that a high-fidelity simulation would behave in the same manner as a real car, and that the performance of tasks undertaken in the simulation should be transferrable to the real world.
If physical and functional fidelity successfully model the real environment, then the features of the simulated environment should cause the user to behave and experience sensations in a manner consistent with the real world. This is known as
psychological fidelity, where the user's perceptions of and reactions to cues in the simulated environment mimic those within the real environment (Duncan, 2006). This aspect of fidelity emphasises comparable levels of the same stress, arousal and emotional responses provoked by the simulation with what would be induced in the real environment (Alexander et al., 2005).
The psychological and emotional impact of a simulation upon the user is closely linked to the sensation of presence, which captures the subjective feelings of 'being there' in the modelled environment (Baños, Botella, Alcañiz, Liaño, Guerrero, & Rey, 2004; Pausch, Proffitt & Williams, 1997). When a person feels a sense of
presence in a simulation, they feel more engaged with the simulation than the physical world around them, and that any of their behaviours are self-perceived as taking place within the simulation rather than the real world (Slater & Wilbur, 1997). Witmer and Singer (1998) postulate that several factors contribute to the level of
presence a person feels in a simulation: control factors, sensory factors, distraction factors and realism factors. In summary, a person would feel a greater sense of
4
Another important aspect of feeling present in simulated environments is
immersion, which as of yet has no fixed definition (Lackey, Maraj, & Barber, 2014). Some argue that immersion should be defined as the technical capability of a system to induce the sensation of presence (Slater & Wilbur, 1997). Others believe that
immersion, like presence should focus on the individual experience the simulation, where a person is mentally and physically involved in the simulated environment (Sherman & Craig, 2003). Despite there being no consensus on the definition of
immersion, they show that the determinants contributing to the sensation of presence rely upon the capability of the simulation to produce a high-fidelity, compelling environment; for example, positive correlations have been found between subjective measures of presence and visual realism (Mania & Robinson, 2004; Slater, Khanna, Mortensen & Yu, 2009). Although it could be argued that greater simulation fidelity is not necessary to induce a sensation of presence (Zimmons & Panter, 2003; Ooms, 2004), the production of a compelling simulated environment can be achieved through the stimulation of multiple senses (including vision, audition, touch and even taste), regardless of whether or not these sensations are realistic or expected in the environment (Gallace et al., 2011; Dinh, Walker, Hodges, Song & Kobayashi, 1999; Sanchez-Vives & Slater, 2005).
5
improvements in task performance (e.g. reaction time) due to the presentation of cues that are congruent (moving in the same direction), spatially-aligned (presented from the same spatial location) and temporally aligned (presented at such times that they would be perceived as simultaneous by the observer) (Harrison, Wuerger & Meyer, 2010; Hancock, Mercado, Merlo & Van Erp, 2013). Therefore, it may be of merit to include congruent auditory motion cues to promote task performance and enhance simulator fidelity (Väljamäe, 2007; Väljamäe, Larsson, Västfjäll & Kleiner, 2008), as well as vestibular cues (Berger, Schulte-Pelkum & Bülthoff, 2010; Meyer, Wong, Timson, Perfect & White, 2012). However, the information in these cues should be both accessible and behave in a manner that is expected – i.e. to correspond with participant behaviour and visual feedback. Therefore the limitations of multisensory cue production should be held in mind. For example, physical limitations in current motion platforms mean that it is not possible to produced sustained acceleration cues, and thus the vestibular cues produced could be described insufficiently realistic (Bürki-Cohen & Go, 2005; Bürki-Cohen, Sparko & Go, 2007). Still, it has been argued that lower-physical fidelity simulations are sufficiently effective training tools and help researchers to identify the contribution of individual cues to task performance (Patrick, 1992; Taylor, Lintern, Hulin, Talleur, Emanuel Jr. & Phillips, 1999), because the simulation is not overloaded with numerous (and possibly redundant) sensory cues (Dahlstrom, Dekker, van Winsen & Nyce, 2009).
6
is preserved if the listener moves his or her head (Wightman & Kistler, 1999; Seeber & Fastl, 2003). Utilising multisensory cues in this manner may promote simulation fidelity and the sensation of presence, thereby encouraging training transfer from simulation to the real world (Hale, Stanney & Malone, 2009).
If a simulation affords the ability to train users in a particular task, then one can explore how skills honed in the simulation transfer to the real world. There are a number of ways to evaluate simulator training outcomes. For example, experts subjectively evaluate trainees on their skills (Hyltander, Liljegren, Rhodin & Lönroth, 2002; Watterson, Beiko, Kuan & Denstedt, 2002) and occasionally, trainee performance is compared with expert performance on identical tasks (Judkins, Oleynikov & Stergiou, 2009). Such comparisons are also used in aviation training, where behavioural measures taken from expert and novice pilots during simulated tasks are used as performance metrics to identify pilot strategies (Kasarskis, Stehwein, Hickox, Aretz & Wickens, 2001). On the other hand, subjective ratings of fidelity, presence or performance are useful if participants or examiners can clearly perceive and are aware of the cues or behaviours to be judged (Watterson et al., 2002; Jeon, Kim, Cabrera & Bassett, 2008). However, they may be limited in their use when probing attitudes to less accessible features of a simulation, such as subtle pitch or amplitude changes in auditory motion cues. Additionally, rating measures are vulnerable to typical shortcomings associated with self-evaluation (Wiggins & O'Hare, 2003). For example, unlike continuously sampled objective measures, subjective data acquisition normally has to take place after the task has been completed. Subjective data therefore cannot reveal real-time changes in attitude and whether participants are influenced by the most recently-occurring events (Riva, Davide & IJsselsteijn, 2003). Furthermore, in the cases of both presence and fidelity there are effects of personal bias and expectation during assessment. This can be undesirable because participants may evaluate simulation features on the basis of previous experience as opposed to their appropriateness for the current task. This suggests that qualitative measures taken from novices are a poor tool for functional and physical fidelity evaluation (Schricker, Franceschini & Johnson, 2001).
7
measures (Schricker et al., 2001; Meehan, Insko, Whitton & Brooks Jr., 2002). A referent is defined as: “a formal representation of reality that is intermediate between reality and the simulation” (Schricker et al., 2001). For example, task performance
can be used as a measure of how well a simulation models an environment in comparison to the real world – the model that affords the best task performance could be considered as having greater fidelity. Some studies have found correlations between subjective presence measures and task performance in the virtual environment (Witmer & Singer, 1998; Sallnäs, Rassmus-Gröhn & Sjöström, 2000). However, there have also been instances where objective task performance does not correspond with subjective presence measures. For example, Mania and Chalmers (2001) presented a 15-minute seminar across four different levels of reality (real world, 3D desktop, 3D head mounted display and audio-only), and tested participants’ recall and sense of presence. It was found that while subjective ratings of presence were highest in the ‘real world’ condition, this did not correspond with
recall performance. Similarly, Durlach, Fowlkes and Metevier (2005) found no systematic relationship between subjective presence ratings and objective performance measures where participants were required to quickly reach out with a virtual hand and accurately touch a virtual target. It could therefore be argued that presence might be better evaluated via subjective assessment rather than via a referent such as task performance.
8 toward a simulated environment.
In consideration of this, two experiments were conducted to explore subjective evaluation of simulation fidelity, sensation of presence and self-performance in comparison to objective self-performance measures. In Experiment One, fifteen naïve participants completed a target-tracking task in the HELIFLIGHT simulator at the University of Liverpool. They then underwent training on a low-fidelity, desktop-based simulator with a realistic turbine rotor noise as their only motion cue. They were re-tested in HELIFLIGHT under the same conditions before training, but with the introduction of an additional ‘substitute’ auditory cue that did not resemble a helicopter turbine. Subjective ratings of fidelity and self-performance were taken after each trial. Continuous objective performance measures were taken throughout: mean of median error and control input. Control input was recorded as control input activity can reveal changes in pilot behaviour not revealed by overall flight path error (Harris, 2011).
Experiment One showed that whilst participants perceived and made use of congruent vestibular cues, they were unable to exploit auditory motion cues to improve task performance. In light of this, Experiment Two explored whether the use of head-tracked HRTFs would enable participants to more effectively localise auditory motion cues. As in Experiment One, Experiment Two further explored the relationship between objective performance data and subjective evaluation of fidelity
9
In consideration of the above literature, the following hypotheses were formed:
1. Subjective measures are a poor tool for fidelity evaluation in comparison to an objective referent such as task performance.
2. Subjective measures are more appropriate for evaluating presence compared to task performance.
3. Low-fidelity simulations are adequate tools for promoting training transfer to higher-fidelity simulations.
10
Chapter 2: Experiment One – Basket-Tracking Task
Method
Ethics Statement
Both experiments have been approved by the University of Liverpool ethics committee (reference PSYC09100027). Written informed consent was acquired from all participants.
Participants
Fifteen participants obtained via opportunity sampling took part in Experiment One (range 19-32 years, mean= 22.6, twelve males). All participants reported normal or corrected-to-normal vision and normal hearing. Some participants had computer game experience and one had flight simulator experience prior to the experiment, but none had prior experience of the specific simulators or task used during this study.
Apparatus and Materials
11
Fig. 1: Visual display in HELIFLIGHT.
Fig. 2: Visual display in the low-fidelity simulator.
The high-fidelity HELIFLIGHT simulator based at the University of Liverpool’s School of Engineering was used during the pre- and post-training tests
[image:13.595.151.487.386.649.2]12
basket (Fig. 1). Auditory stimuli were delivered via loudspeakers in the simulator capsule at 87.5 dB(A) while the pilots wore sound attenuating headphones (Flightcom 4DLX (attenuation – 24dB)). The audio signal consisted of two components, the rotor sound and a turbine sound. Both sounds were continuous loops that were generated under control of a Tucker-Davies RM1 real time processor. The turbine signal pitch and amplitude was modulated in direct proportion to the control input. The rotor playback speed (and pitch) was always constant but the rotor signal amplitude covaried with the control input. The overall signal level varied by 3dB (86 – 89 dB(A)). Vestibular cues were delivered via a Maxcue 600 series motion platform. Platform motion was restricted to vertical movements, which were under the control of the participants. An acceleration signal was used to drive the motion platform. A washout filter was used to deliver motion cues within the restricted simulator workspace. Other features of the capsule included a realistic helicopter control set-up, including a collective lever to the left of the pilot’s seat which was used for vertical movement of the ‘helicopter’. The instrumentation panel
was off during all experiments.
The low-fidelity simulator was computer-based in the Visual Perception Laboratory at the University of Liverpool's Psychology Department. Visuals were presented on a single 17” LCD monitor (Fig. 2). Auditory information was presented
13 Subjective and Objective Evaluation
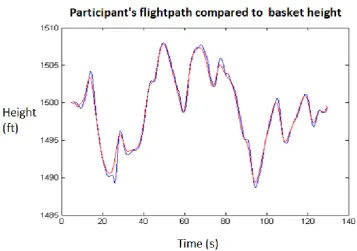
Fig. 3: A participant’s flight path (blue) plotted with the predetermined flight path of the basket (red).
14
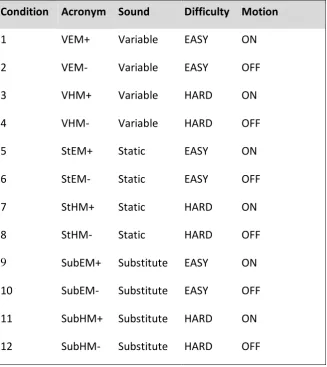
Condition Acronym Sound Difficulty Motion
1 VEM+ Variable EASY ON
2 VEM- Variable EASY OFF
3 VHM+ Variable HARD ON
4 VHM- Variable HARD OFF
5 StEM+ Static EASY ON
6 StEM- Static EASY OFF
7 StHM+ Static HARD ON
8 StHM- Static HARD OFF
9 SubEM+ Substitute EASY ON
10 SubEM- Substitute EASY OFF
11 SubHM+ Substitute HARD ON
[image:16.595.115.443.72.440.2]12 SubHM- Substitute HARD OFF
Table 1: Flying conditions used in the post-training task
15 Q1) I found the task easy.
Q2) I performed well at this task.
Q3) I felt in control of the helicopter.
Q4) The experience in the simulator seemed real.
Q5) The simulator sounded like a helicopter.
Q6) I feel that training helped me to improve my performance on this task.
Friedman tests were performed on ratings for all scale items. Where Friedman tests were found to be significant (p≤ .05), Wilcoxon Signed Ranks tests
16 Results
2.1.1 - Analysis of Objective Performance Measures
Participants completed a tracking task in the HELIFLIGHT simulator, where they were required to control the vertical height of the helicopter in order to refuel a tanker. The tanker moved in a predetermined vertical path which made the task challenging. After two hours' training on a low-fidelity desktop simulator, participants were retested in HELIFLIGHT. The post-training task included additional test trials using a substitute turbine to which participants had not been previously exposed.
A 2×2×2×2 repeated-measures ANOVA was performed on the objective performance measure (median error) across training, auditory cue, difficulty and motion cue. Levels of the factor 'Training' were completion of the task before or after the training session. Levels of the factor 'Auditory cue' included the variable turbine and static turbine. The variable and static turbines were designed to sound like a helicopter, but only the former contained auditory motion information. Easy or hard 'Difficulty' indicated the damping setting on the simulator which eased or impeded control. 'Motion cue' was either present or absence, depending on whether or not the motion platform of the simulator was active.
There was a significant main effect of training, where performance was worse before training compared to after (pre-training mean error= 0.65ft, SE= 0.14; post-training mean error= 0.35ft, SE= 0.05), F(1,14)= 76.32, p< .001. There was also a significant main effect of motion, where participants performed better with motion (mean error= 0.45ft, SE= 0.09) compared to without motion (mean error= 0.55ft, SE= 0.10), F(1,14)= 6.77, p= .0099. There was a significant main effect of difficulty, where participants performed better under 'easy' conditions (mean error= 0.44ft, SE= 0.08) compared to 'hard' (mean error= 0.56ft, SE= 0.11), F(1,14)= 12.01, p= .0006. There was no main effect of auditory cue, and there were no significant interactions.
17
to explore differences in post-training performance between the variable, static and substitute turbine conditions. There was no significant difference in performance between variable turbine (mean error= 0.32ft, SD= 0.22) and static turbine conditions (mean error= 0.37ft, SD= 0.29), t(59)= 2.22, p= .031. There was also no significant difference between the static turbine and substitute turbine conditions (mean error= 0.31ft, SD= 0.17), t(59)= 2.16, p= .035, or between the variable and substitute turbine conditions, t(59)= 0.14, p= .887.
A repeated-measures ANOVA was also performed on median control input. There was a significant main effect of training, where control input was greater before training (mean= 0.62in, SE= 0.18) compared to after training (mean= 0.37in, SE= 0.07), F(1,14)= 35.77, p< .001. There was a significant main effect of motion, where control input was smaller for conditions with vestibular cues (mean= 0.44in, SE= 0.11) compared to without (mean= 0.55in, SE= 0.13), F(1,14)= 5.86, p= .016. There was also a significant main effect of difficulty, where control input was smaller for ‘easy’ conditions (mean= 0.45, SE= 0.10) compared to ‘hard’ (mean=
0.54, SE= 0.13), F(1,14)= 4.36, p= .038. There was no main effect of auditory cue on control input, and there were no significant interactions.
To explore influences the type of auditory cue may have had on post-training task behaviour, Bonferroni-corrected t-tests (adjusted alpha= 0.0167) were again used to examine post-training median control input under the three auditory conditions. There were no significant differences in control input between the variable turbine (mean = 0.35in, SD= 0.27) and static turbine conditions (mean= 0.38in, SD= 0.29), t(59)= 1.39, p= .169, the variable turbine and substitute turbine conditions (mean= 0.35in, SD= 0.27), t(59)= 0.14, p= .888, or the static and substitute turbine conditions, t(59)= 1.30, p= .198.
2.1.2 – Discussion
18
training transfer from the low-fidelity simulator to the high-fidelity simulator (Tracey & Lathan, 2001; Longridge et al., 2001; Gurusamy, Aggarwal, Palanivelu & Davidson, 2008). In contrast to the findings of Bürki-Cohen and Go (2005) and Bürki-Cohen et al., (2007), participants performed significantly better with simulator motion cues than without. However, it is important to note that improved performance was found in transfer between simulators, and it is rarely found that the use of motion platforms in flight simulators transfers to improved performance in
real aircraft (McCauley, 2006). The physical limitations of current motion platforms means the fidelity of simulated motion cues poorly reflects what pilots would experience in the real world. It should therefore not be expected that improved performance between the low- and high-fidelity simulators automatically indicates training transfer to a real aircraft.
It was expected that the presentation of congruent, temporally- and spatially-aligned motion cues in multiple domains would facilitate task performance (Harrison et al., 2010; Hancock et al., 2013). Participants performed better with vestibular cues compared to without, suggesting that vestibular cues successfully converged with visual tracking information (Chen, DeAngelis & Angelaki, 2011). Although human responses are slower to vestibular-kinaesthetic information alone compared to visual information, small temporal disparities between visual and vestibular motion information do not necessarily prevent cue integration (Barnett-Cowan, Meilinger, Vidal, Teufel, & Bülthoff, 2012; Butler, Campos & Bülthoff, 2015). This may explain why participants were able to use vestibular cues to the advantage of task performance in spite of the in-built time delay in the flight simulator dynamics.
19
exhibited more familiarity with audio-visual pairs to which they had previously been exposed in comparison with novel pairs from the same stimulus set.
This finding demonstrated the ability of individuals to form multisensory associations without being aware of the learning process; a concept that was used during training on the low-fidelity simulator, where participants were passively exposed to the variable turbine whilst practicing the tracking task. Although participants were not expressly instructed to attend to the changing pitch and amplitude of the turbine cue, it was thought that with prolonged exposure they would form associations between the visual indication of helicopter height and the behaviour of the auditory motion cue. However, participants did not seem to learn to integrate the changes in pitch and amplitude with visual or vestibular cues enough to influence tracking performance. As the target-tracking task was highly visual, it may be the case that the addition of auditory motion cues conferred little benefit to tracking performance. This finding contrasts with the idea that auditory motion cues can enhance the sensation of self-motion in virtual reality (Väljamäe et al., 2008).
2.2.1 – Subjective Self-performance Measures
Q1) I found the task easy.
Q2) I performed well at this task.
Q3) I felt in control of the helicopter.
20
one would expect to find an inverse correlation between subjective ratings and objective performance error measures. Friedman tests were used to test for significant differences in mean ratings across flying conditions (turbine, motion and difficulty). Where Friedman tests were found to be significant (p< .05), Bonferroni- corrected Wilcoxon Signed Ranks tests (adjusted alpha= 0.0167) were used to explore differences within flying conditions.
For Q1, “I found the task easy”, a Friedman test showed no significant
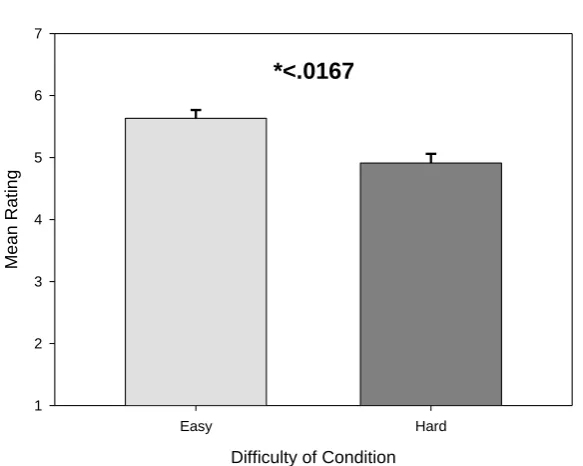
differences in ratings across flying conditions, χ2(11)= 16.56, p= .121. For Q2, “I performed well at this task”, there were differences in mean self-performance rating
between flying conditions, χ2(11)= 32.31, p= .001, where performance was rated as better in ‘easy’ (mean= 5.63, SD= 1.25) compared to ‘hard’ conditions (mean= 4.91,
SD= 1.41), Z= -3.72, p< .001 (Fig. 4). For Q3, there were no significant differences in perceived control across flying conditions, χ2(11)= 19.02, p= .061.
Mean Ratings for "I performed well at this task."
Difficulty of Condition
Easy Hard
M
ea
n
Rat
in
g
1 2 3 4 5 6 7
[image:22.595.127.419.399.632.2]*<.0167
21
2.2.2 - Discussion
The aim of scale items 1-3 was to explore participants' self-ratings of performance. Analysis of subjective data showed that participants did not rate the difficulty of the tracking task any differently under easy or hard conditions. They also did not report any differences in perceived control across easy or hard conditions. However, objective performance data showed that participants did indeed perform better under easy conditions. When asked to rate their performance, participants' responses reflected objective performance data. Variation in ratings for these items suggests that careful wording is required when requesting participants to self-evaluate their performances. Although participants reliably evaluate their tracking performance after task completion, judgement of task difficulty and simulator control could be more consistently assessed by examiners during completion of the task (Watterson et al., 2002; Jeon et al., 2008; Riva et al., 2003).
2.3.1 – Subjective Measures of Fidelity
Q4) The experience in the simulator seemed real.
Q5) The simulator sounded like a helicopter.
22
behaviour. Vestibular cues were also manipulated, where they were either present (motion platform switched on) or absent (motion platform off).
Subjective data from two items of the scale were compared with objective performance data to assess participants' ability to evaluate simulator and audio cue fidelity. Since the fidelity of the simulation was modified by systematically manipulating auditory and vestibular cues, it was expected that fidelity ratings would consistently vary with cue type. Q4 referred to the overall fidelity of the helicopter simulation (physical fidelity, visual fidelity and auditory fidelity) whilst Q5 focused only on the auditory fidelity of the simulation. It was expected that exposure to the high-fidelity turbine during training would enable participants to form comparative fidelity judgements of the static and substitute turbines. As for items 1-3, Friedman tests were used to explore significant differences in ratings across flying conditions.
For Q4 - “The experience in the simulator seemed real”, a Friedman test found significant differences in ratings across trials, χ2(11) = 44.37, p< .001. Bonferroni-corrected (adjusted alpha= 0.0167) Wilcoxon Signed Ranks tests showed that the simulation was rated as more realistic in conditions with vestibular cues (mean= 5.45, SD= 1.29) compared to without (mean= 4.56, SD= 1.50), Z= -4.52, p<
.001 (Fig. 5). There was no significant difference in ratings between difficulty conditions, Z= -1.13, p= .257. There was no significant difference in ratings between the variable and static turbine conditions, Z= -0.86, p= .392. There were also no significant differences in ratings between the variable and substitute turbine conditions, Z= -1.01, p= .313, or between the static turbine and substitute turbines,
23
Motion Conditions
Motion On Motion Off
M
ea
n
R
at
ing
1 2 3 4 5 6 7
Mean Ratings for "The experience in the simulator seemed real."
[image:25.595.161.439.108.312.2]*<.0167
Fig. 5: Participants rated the realism of their experience as being significantly different between motion conditions. Error bars are SEs.
24
Auditory Cue Type
Variable Static Substitute
M
ea
n
Rat
in
g
1 2 3 4 5 6 7
Mean Ratings for "The simulator sounded like a helicopter."
[image:26.595.123.422.70.343.2]*<.0167
Fig. 6: Mean ratings for turbine fidelity across the three auditory cue conditions. Error bars are SEs.
2.3.2 – Discussion
Scale items exploring subjective fidelity were worded in an attempt to probe attitudes to fidelity without being overly technical and confusing. “The experience in the simulator seemed real” aimed to encompass as many aspects of simulator fidelity as possible, whereas “The simulator sounded like a helicopter” aimed to capture
25
Three different auditory cues were presented throughout the post-training tasks: a rotor-turbine sound combination where rotor amplitude co-varied with control input (variable turbine); the same sound combination but without any variance (static turbine); and a saxophone tuning note whose amplitude co-varied in the same fashion as that of the variable turbine (substitute turbine). The variable turbine was designed to sound like a real helicopter turbine and changed in pitch and amplitude in concordance with helicopter height. The static turbine also sounded like a helicopter turbine, but did not vary with helicopter height. The substitute turbine’s saxophone note sounded unlike a helicopter turbine, but its pitch and amplitude, like that of the variable turbine, adjusted with helicopter height. It was expected that trained participants would show significant variation in attitudes to these turbines. These expectations were partly reflected by subjective rating data, where participants rated the variable turbine as more realistic compared to the static turbine. However, not only does this contradict objective tracking data (which showed no significant difference in performance across the turbine conditions), participants did not report the substitute turbine as sounding any less realistic than the others.
26
2.4.1 - Subjective Measures of Training
The training component of this study involved all 15 participants undertaking 2 hours of training on a low-fidelity, desktop-based simulator in a laboratory. The low-fidelity simulator lacked vestibular cues but used identical flight dynamics to those in the HELIFLIGHT simulator. For each participant, the training session was split into 15-minute blocks where only ‘realistic’, variable turbine was presented. Task difficulty alternated between easy and hard between trials (4 easy trials, 4 hard trials).
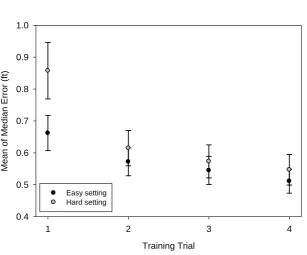
Training Performance: Mean of Median Error Across All Trials
Training Trial
1 2 3 4
M
ean
of
M
edian
E
rr
or (f
t)
0.4 0.5 0.6 0.7 0.8 0.9 1.0
[image:28.595.111.419.344.599.2]Easy setting Hard setting
Fig. 7: Training performance of all 15 participants. Error bars are SEs.
Participants' task performance improved over training (Fig. 7). T-tests showed that participants performed significantly better in the fourth hard training trial (mean error= 0.54ft, SD= 0.18) compared to the first (mean error= 0.85ft, SD= 0.33), t(14)= 5.52, p<.001, and participants also performed significantly better in the
27
fourth easy trial (mean error= 0.51ft, SD= 0.14) compared to the first (mean error= 0.66ft, SD= 0.21), t(14)= 3.04, p= .0087. However, absolute performance improvement over easy training trials was not a significant predictor of training ratings in equivalent post-training trials, R2= .0605, p= .377. Similarly, absolute performance improvement over hard training trials was not a significant predictor of training ratings in equivalent post-training trials, R2= .001, p= .907. For the post-training task, a Friedman test showed that there were no significant differences in training ratings across flying condition, χ2(11) = 9.84, p= .545.
2.4.2 - Discussion
Participants were asked to judge the usefulness of training to explore if training with the low-fidelity simulator would transfer to the high-fidelity simulator, regardless of whether post-training conditions matched training conditions. If participants were good at judging training usefulness, one would expect to see higher subjective ratings only for conditions that both included the variable turbine and excluded vestibular cues (which were equivalent to the training conditions). Objective training data showed rapid improvement in task performance. Despite being exposed to the variable turbine throughout training, there was no evidence to suggest that they thought this helped to improve performance. Participants also did not think training was any more useful in 'easy' compared to 'hard' conditions, but consistently performed better in easy conditions post-training. Additionally, ratings of training were not affected by the presence or absence of motion cues, even though tracking performance was significantly better with vestibular cues and participants were trained without a motion platform.
28
that perceived usefulness of training would not concur with objective measures of performance.
Summary
Experiment One showed that the presence of congruent vestibular cues afforded improved task performance in a vertical tracking task, but participants were unable to use auditory motion cues to improve their task performance. Their subjective ratings of auditory fidelity also did not reflect the importance of either physical fidelity or functional fidelity in the simulated environment. Improvements in participants’ task performance transferred from the basic simulation to high-fidelity simulation, but participants were poor at evaluating the usefulness of training, where ratings were inconsistent with performance across flying conditions.
Publication in PLoS ONE
29 Chapter 3: Experiment Two – Hover Task
Experiment Two further explored the use of multisensory motion cues in simulated flying tasks. As in Experiment One, auditory and vestibular motion cues were included in the simulated environment. In light of the results of Experiment One, auditory motion cues were this time presented in the form of HRTFs with head tracking, in order to afford each individual participant more ability to localise sounds. As well as exploring the concepts of fidelity and task performance, Experiment Two also considered participants’ subjective evaluation of presence and how it related to their task performance.
Method
Participants
Eleven participants obtained via opportunity sampling took part in Experiment Two (range 22-27 years, mean= 24.2, nine males). All participants reported normal or corrected-to-normal vision and normal hearing. Some participants had computer game experience, some had prior experience of the specific simulators used during this study (but not of the activity performed within this experiment), and one was a fully-trained helicopter pilot.
Apparatus and Materials
30
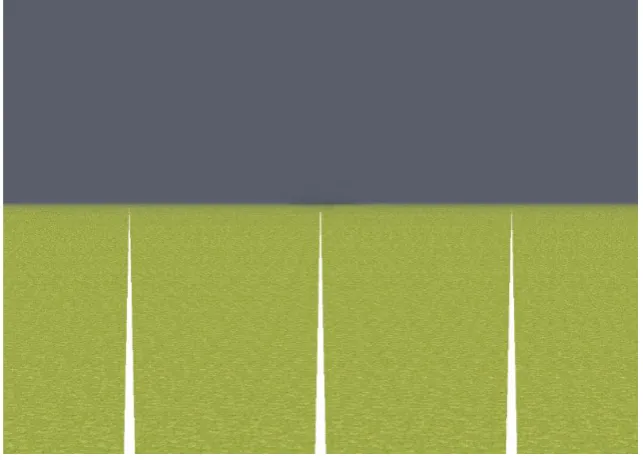
participants were required to follow a target moving from side-to-side along a predetermined horizontal path. This horizontal movement was intended to simulate the disturbance of the helicopter along the yaw axis from 0 degrees.
As in Experiment One, the HELIFLIGHT simulator was used during the pre- and post-training tests. The flight dynamics model (see Appendix) was restricted to movements along the yaw axis. Control input was delivered via rudder pedals in the cockpit. The input gain was constant in all experiments (N0tr = 4.8). In order to simulate wind disturbance along the yaw axis, a turbulence scale factor of 1.5 was used.
[image:32.595.134.456.410.640.2]Visual information consisted of white radial lines extending to the horizon on a green 'grass' background with a radial line every 15 degrees. Each of these lines was visually identical to prevent the task from being too easy. At the start of each test point, the helicopter was level at 0 degrees along the yaw axis (Fig. 8).
Fig. 8: Visual display for the hover task.
31
headphones (Flightcom 4DLX (attenuation – 24dB)). The cue was a continuous loop generated by the Tucker-Davis RM1 real time processor. Cue amplitude and horizontal position were modulated in direct proportion to the control input. The overall signal level varied by 3dB (86 – 89 dB(A)). In this experiment, vestibular motion cues were restricted to rotational movements along the yaw axis.
Objective and Subjective Evaluation
The objective of both the training and post-training tasks was to maintain a heading of zero degrees in opposition to simulated wind disturbance along the yaw axis. Participants were required to make use of any available cues (visual, motion or auditory) to determine their position relative to the target heading. As well as a control input-to-response latency of 75ms, each radial line on the display was visually identical, ensuring that the task was complex. The disturbance of the helicopter along the yaw axis was predetermined by the computer.
The simulation of binaural auditory cues using head-related transfer functions (HRTFs) commonly results in difficulties with sound localisation when cues are presented in front of or behind a participant (Cho et al., 2006). This is because the artificial auditory cues usually do not correspond with an individual's own transfer functions. Delivering HRTFs in in correspondence with a head tracking device optimises directional reproduction (Wightman & Kistler, 1999; Seeber & Fastl, 2003). Accurate detection of one's position along the yaw axis should be further enhanced with congruent vestibular cueing. However, a person's sensitivity to movement along the yaw axis is influenced by the frequency of the turn; the thresholds for high-frequency turns (eg. 5Hz) are lower than those for low-frequency turns (eg. 0.05Hz) (Grabherr, Nicoucar, Mast & Merfeld, 2008). Additionally, the aforementioned limitations of current motion platforms mean that the sensation of acceleration cannot be sustained indefinitely before 'washout' occurs.
32
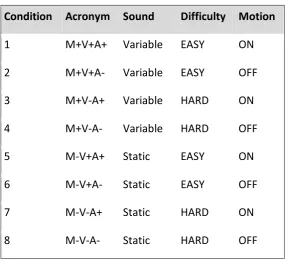
[image:34.595.134.425.232.492.2]input was used as a measure of participants' behavioural response throughout the task. As in Experiment One, data were sampled for each test point at a frame rate of 10ms and a sampling interval of 5 frames, giving around 3000 samples for each 2.5 minute-long test point. The design used for the pre- and post-training tests is as follows. The conditions were presented in a quasi-random order to each participant (Table 2):
Condition Acronym Sound Difficulty Motion
1 M+V+A+ Variable EASY ON
2 M+V+A- Variable EASY OFF
3 M+V-A+ Variable HARD ON
4 M+V-A- Variable HARD OFF
5 M-V+A+ Static EASY ON
6 M-V+A- Static EASY OFF
7 M-V-A+ Static HARD ON
8 M-V-A- Static HARD OFF
Table 2: Flying conditions used in the pre- and post-training tasks of Experiment 2.
33
constraints of testing. Responses were given on a scale of 1 to 7, where 1 indicated strong negative attitude (eg. “Not at all”) with the statement and 7 indicated strong positive attitude (eg. “Very much”). The items were presented in the same order each
time:
Q1) How completely were all of your senses engaged?
Q2) How much did the auditory aspects of the environment involve you?
Q3) How aware were you of events occurring in the real world around you?
Q4) How well could you localize sounds?
Q5) How involved were you in the virtual environment experience?
Q6) Did the simulator sound like a helicopter?
Q7) Did your experience seem real?
Q8) How visually realistic was the simulator?
Q9) How realistically did the simulator move?
Q10) How realistic was the environment in which you were flying?
Q11) Did you find training useful for this task?
Q12) Did you perform well in this task?
Q13) Could you easily control the helicopter's movement?
Q14) Did you find the task easy?
Q15) How well could you predict the helicopter's movements?
Friedman tests were performed on ratings for all scale items. Where Friedman tests were found to be significant (p≤ .05), Wilcoxon Signed Ranks tests
34 Results
3.1.1 – Analysis of Objective Performance Measures
Participants completed a hover task in the HELIFLIGHT simulator, in which they were required to correct their position along the yaw axis towards a central heading whilst their path was 'disturbed' by simulated turbulence (also along the yaw axis). After undergoing an hour's training on the low-fidelity desktop simulator, they were retested in HELIFLIGHT.
To compare performance before and after training, a 2×2×2×2 repeated-measures ANOVA was performed on the proportion of data points spent within 5˚ from the central heading, across training (before or after training), visual cue (present or absent), vestibular cue (present or absent) and auditory cue (variable or static). There was a significant main effect of training, where participants spent a greater proportion of time within 5˚ from the central heading after training (mean= 45.3%,
SE= 0.018) compared to before training (mean= 40.3%, SD= 0.029), F(1,10)= 10.29,
p= .0094. There was also a main effect of visual cue, where participants spent a significantly greater proportion of time within 5˚ of the central heading when visuals
were on (mean= 77.5%, SD= 0.045) compared to off (mean= 8.1%, SD= 0.003),
F(1,10)= 245.63, p<.001. There were no significant main effects of vestibular cue or auditory cue.
There was a significant interaction between training and visual cue, F(1,10)= 30.86, p<.001. Before training, performance was better in visuals-on conditions (mean= 72.7%, SE= 0.057) compared to visuals-off (mean= 7.9%, SD= 0.003). After training, performance was also better in visuals-on conditions (mean= 82.3%, SE= 0.036) compared to visuals-off (mean= 8.2%, SE= 0.004).
35
compared to without (mean= 21.04in, SE= 2.00), F(1,10)= 11.87, p= .006. There were no significant main effects of vestibular cue or training.
There was a significant interaction between vestibular and auditory cues,
F(1,10)= 5.20, p= .024. In motion conditions, control input was greater when the variable auditory cue was used (mean= 18.53in, SE= 1.57) compared to when the static auditory cue was used (mean= 17.04in, SE= 3.34). Likewise, in non-motion conditions control input was greater when variable audio was used (mean= 21.12, SE= 1.16) compared to static audio (mean= 12.85, SE= 1.79).
There was also a significant interaction between visual and auditory cues,
F(1,10)= 10.99, p= .001. In visuals-on conditions, control input was smaller when the variable auditory cue was used (mean= 13.71in, SE= 0.93) compared to when the static cue was used (mean= 13.75in, SE= 0.99). During visuals-off conditions, however, control input was greater when the variable auditory cue was used (mean= 25.94in, SE= 1.65) compared to the static (mean= 16.14in, SE= 3.57).
3.1.2 – Discussion
36
Fastl, 2003). Although there was no main effect of vestibular cue, analysis showed an interaction between vestibular and auditory cues. This suggests that motion cues presented in multiple modalities are perceptible enough to influence task behaviour, and supports the merits of motion platforms in training simulations.
3.2.1 – Subjective Measures of Presence
After gaining familiarity with the task and simulator during the pre-training and training sessions, participants' subjective attitudes to experimental cues were evaluated using a 15-item scale. This scale was completed by each participant after every post-training trial to record subjective measures of presence, fidelity and performance.
Q1) How completely were all of your senses engaged?
Q2) How much did the auditory aspects of the environment involve you?
Q3) How aware were you of events occurring in the real world around you?
Q4) How well could you localize sounds?
Q5) How involved were you in the virtual environment experience?
A selection of items from Witmer and Singer's (1998) Presence Scale was used to explore participants' feelings of presence, or “being there” (Pausch et al., 1997). The chosen items were included as they were highly related to this experiment, but were limited in number due to the time constraints of the study. For each question, Friedman tests were conducted across flying condition to reveal differences in ratings. Where Friedman tests were found to be significant (p≤ .05), Wilcoxon Signed Ranks tests were used to further explore these differences.
Bonferroni-corrected (adjusted alpha= 0.0167) Wilcoxon Signed Ranks tests showed that participants rated their senses as being engaged more when visual cues were present (mean= 5.11, SD= 1.37) as opposed to absent (mean= 3.91, SD= 1.06),
37
participants felt that the auditory aspects of the environment involved them more in auditory motion cue conditions (mean= 4.89, SD= 1.78) than static auditory cue conditions (mean= 3.57, SD= 1.86), Z= -3.18, p= .001 (Fig. 10). Participants rated themselves as having less awareness of the real world around them when visual cues were present (mean= 5.13, SD= 2.09) as opposed to absent (mean= 5.84, SD= 1.58),
Z= -3.02, p= .003; Bonferroni-adjusted alpha= 0.0167 (Fig. 11). Ratings showed that they felt more able to localise sounds when there was an auditory motion cue (mean= 4.34, SD= 1.89) compared to static auditory cue (mean= 3.11, SD= 1.65), Z= -2.87, p= .004 (Fig. 12). All three experimental cues (Bonferroni-adjusted alpha = 0.0167) significantly affected ratings of feeling involved in the virtual environment experience, where participants felt more involved with visual cues (mean= 4.95, SD= 1.26) versus without (mean= 4.00, SD= 1.61), Z= -3.23, p= .001, with vestibular cues (mean= 4.75, SD= 1.28) versus without (mean= 4.20, SD= 1.69), Z= -2.74, p= .006, and with auditory motion cues (mean= 4.84, SD= 1.27) versus static auditory cues (mean= 4.11, SD= 1.66), Z= -3.03, p= .002 (Fig. 13).
Mean Ratings for "How completely were all your senses engaged?"
Flying Condition
Visuals On/Off Motion On/Off Variable/Static Audio
M
ean R
ating
1 2 3 4 5 6 7
[image:39.595.160.456.430.660.2]*<.0167 *<.0167
38
Mean Ratings for "How much did the auditory aspects of the environment involve you?"
Auditory Condition
Variable Audio Static Audio
M
ean R
ating
1 2 3 4 5 6 7
[image:40.595.121.473.104.332.2]*<.05
Fig. 10: Mean ratings of engagement for auditory aspects of the environment. Participants found the variable auditory cue to be more engaging compared to static audio. Error bars are SEs.
Mean Ratings for "How aware were you of events occurring in the real world around you?"
Flying Condition
Visuals On/Off Motion On/Off Variable/Static Audio
M
ean R
ating
1 2 3 4 5 6 7
[image:40.595.77.410.453.681.2]*<.0167
39
Mean Ratings for "How well could you localize sounds?"
Auditory Condition
Variable Audio Static Audio
M
ea
n
Ratin
g
1 2 3 4 5 6 7
[image:41.595.166.461.103.328.2]*<.05
Fig. 12: Participants felt they could localise sounds more in conditions using the variable auditory cue compared to static. Error bars are SEs.
Mean Ratings for "How involved were you in the virtual environment experience?
Flying Condition
Visuals On/Off Motion On/Off Variable/Static Audio
M
ea
n
Rat
ing
1 2 3 4 5 6 7
*<.0167 *<.0167 *<.0167
[image:41.595.132.455.459.691.2]40
3.2.2 – Discussion
Items from Witmer and Singer's (1998) Presence scale were used to explore the effect of experimental cues on ratings of presence. Visual and auditory cues were a strong factor in the rating of presence, which is reflected in objective control input behavioural measures. The ratings of presence increased with the number of cues present, supporting the idea that multisensory cues enhance the sensation of presence (Gallace et al., 2011). Given that visual cues were highly important to the task, it was expected that their presence or absence would significantly influence both task performance and presence ratings. Even when visual cues were present, however, they were not realistic enough to mimic the real world. All the same, participants gave higher ratings of presence for conditions with visual cues than without, which suggests that even basic visual representations are sufficient to improve a sensation of presence (Dinh et al., 1999). If presence depended on the use of highly-realistic computer graphics, one would not expect a significant difference in ratings between visual conditions. It may be that participants' responses were made within the context of the experiment rather than comparing their expectations of the real world to the virtual one (Usoh, Catena, Arman & Slater, 2000).
The findings also agree with previous studies that found spatialised auditory cues significantly contribute to the sensation of presence (Hendrix & Barfield, 1996), especially when the auditory cue contained motion information that was relevant to the task (Bormann, 2008). Participants' sensation of presence seemed to be enhanced by the use of binaural HRTFs, but only when the auditory cue acted as a moving sound source (Nykänen, Zedigh & Mohlin, 2013). This corresponds with control input data, which showed that participants' task behaviour significantly differed between variable and static auditory cue conditions. Participants also felt more involved in the virtual environment experience in conditions with vestibular cues, which did not have a significant effect on task performance. This contrasts with the findings in Experiment One, where vestibular cues significantly improved task
41
vestibular cues influence task behaviour and further supports the idea that multisensory sensory cues enhance the sensation of presence.
3.3.1 – Subjective Measures of Fidelity
Items for subjective fidelity measures were adapted from the scale used in Experiment One, reworded to fit the style of items taken from Witmer and Singer's (1998) Presence scale.
Q6) Did the simulator sound like a helicopter?
Q7) Did your experience seem real?
Q8) How visually realistic was the simulator?
Q9) How realistically did the simulator move?
Q10) How realistic was the environment in which you were flying?
Participants significantly rated the simulator as sounding like a helicopter
more in auditory motion cue conditions (mean= 4.25, SD= 1.60) compared to static auditory cue conditions (mean= 3.68, SD= 1.70), Z= -2.86, p= .004 (Fig. 14). Only visual cues affected whether participants felt their experience seemed real, where they felt it was more real with visual cues (mean= 3.70, SD= 1.27) than without (mean= 2.78, SD= 1.68), Z= -2.94, p= .003; Bonferroni adjusted alpha= 0.0167 (Fig. 15). They similarly rated the visual realism of the simulator as greater with visual cues (mean= 3.88, SD= 1.60) compared to without (mean= 3.27, SD= 2.02), Z= -2.36, p= .019 (Fig. 16). They also felt that the simulator moved more realistically
with vestibular cues (mean= 4.25, SD= 1.77) than without (mean= 2.48, SD= 1.91),
42
Mean Ratings for "Did the simulator sound like a helicopter?"
Auditory Condition
Variable Audio Static Audio
M
ea
n
Ratin
g
1 2 3 4 5 6 7
[image:44.595.144.436.74.334.2]*<.05
Fig. 14: Ratings for simulator sound fidelity. Although the white pulsed noise used did not resemble a helicopter turbine, participants thought the variable cue sounded more like a helicopter than the static
cue. Error bars are SEs.
Mean Ratings for "Did your experience seem real?"
Flying Condition
Visuals On/Off Motion On/Off Variable/Static Audio
M
ea
n
Ratin
g
1 2 3 4 5 6 7
*<.0167
[image:44.595.123.421.441.705.2]43
Mean Ratings for "How visually realistic was the simulator?"
Visual Condition
Visuals On Visuals Off
M
ea
n
Ratin
g
1 2 3 4 5 6 7
[image:45.595.166.461.142.365.2]*<.05
Fig. 16: Ratings for the visual realism of the simulation. Error bars are SEs.
Mean Ratings for "How realistically did the simulator move?"
Motion Condition
Motion On Motion Off
M
ea
n
Ratin
g
1 2 3 4 5 6 7
*<.05
[image:45.595.169.459.463.688.2]44
Mean Ratings for "How realistic was the environment in which you were flying?"
Flying Condition
Visuals On/Off Motion On/Off Variable/Static Audio
M
ean R
ating
1 2 3 4 5 6 7
[image:46.595.94.415.126.356.2]*<.0167
Fig. 18: Ratings for the realism of the environment in the simulator. There was a significant difference in ratings between visual conditions. Error bars are SEs.
3.3.2 – Discussion
45
sensation of presence and fidelity in a simulation (Hendrix & Barfield, 1996; Nykänen et al., 2013; Väljamäe et al., 2008).
It has been suggested that simulator motion platforms are limited in their capacity to provide congruent acceleration cues (Bürki-Cohen et al., 2007). It could be argued that the auditory and vestibular cues used in this experiment are low in
functional fidelity as they did not contribute to improvement in task performance after training (Perfect et al., 2014). Nevertheless, participants judged the movement of the simulator as being more realistic when vestibular cues were present. Here, there is a discrepancy between what participants subjectively felt was realistic about the simulated cues, and how the cues affected their task performance. In contrast to arguments made by Schricker et al., (2001), subjective ratings motion fidelity could be a more sensitive measure compared to an objective referent like task performance. On the other hand, this depends on one’s definition of fidelity; if the fidelity of a cue was defined as the extent to which it improves task performance, then the vestibular cues used in this experiment would be considered low-fidelity. If the fidelity of a cue was defined by participants’ subjective interpretation of what is realistic, then the vestibular cues could be considered high-fidelity.
46
3.4.1 – Subjective Measures of Performance and Training
As in Experiment One, participants underwent training on a low-fidelity simulator. The objective performance measure used was also mean of median error. As seen in Figure 19, performance rapidly improved after the first trial, with significant improvement in performance between the first (mean= 4.09ft, SD= 4.46) and fourth trials (mean= 0.77ft, SD= 0.43), t(10)= 2.43, p= .036.
Training Performance: Mean of Median Error for each trial
Training Trial
0 1 2 3 4 5
[image:48.595.119.428.258.492.2]M ea n of M ed ian E rr or ( ft) (ti c k s p laced on a l og 10 s c ale ) 0.1 1 10
Fig. 19: Training performance of all 11 participants. Error bars are SEs.
47
Q11) Did you find training useful for this task?
Q12) Did you perform well in this task?
Q13) Could you easily control the helicopter's movement?
Q14) Did you find the task easy?
Q15) How well could you predict the helicopter's movements?
Participants rated training as being more useful in conditions with visual cues (mean= 5.36, SD= 1.14) than without (mean= 3.31, SD= 2.16), Z= -4.97, p<.001; Bonferroni-adjusted alpha= 0.0167. There were no significant differences in ratings between motion conditions or auditory cue conditions (Fig. 20). Similarly, participants rated their performance as being better with visual cues (mean= 4.43, SD= 1.02) than without (mean= 2.23, SD= 1.16), Z= -5.62, p<.001; Bonferroni-adjusted alpha= 0.0167, with no significant differences in ratings between motion conditions or auditory cue conditions (Fig. 21). They also felt that they could more easily control the simulator’s movement with visual cues (mean= 4.97, SD= 0.88) compared to without (mean= 2.61, SD= 1.48), Z= -5.41, p<.001; Bonferroni-corrected alpha= 0.0167 (Fig. 22). Participants found the task easier with visual cues (mean= 4.50, SD= 1.11) compared to without (mean= 2.20, SD= 1.36), Z= -5.50,
48
Mean Ratings for "Did you find training useful for this task?"
Flying Condition
Visuals On/Off Motion On/Off Variable/Static Audio
M
ea
n
Ratin
g
1 2 3 4 5 6 7
[image:50.595.123.420.78.337.2]*<.0167
Fig. 20: Mean ratings for training usefulness. There was a significant difference between visual conditions. Error bars are SEs.
Mean Ratings for "Did you perform well in this task?"
Flying Condition
Visuals On/Off Motion On/Off Variable/Static Audio
M
ea
n
Ratin
g
1 2 3 4 5 6 7
*<.0167
[image:50.595.123.420.415.679.2]49
Mean Ratings for "Could you easily control the helicopter's movement?"
Flying Condition
Visuals On/Off Motion On/Off Variable/Static Audio
M
ea
n
Rat
in
g
1 2 3 4 5 6 7
[image:51.595.159.454.106.338.2]*<.0167
Fig. 22: Mean ratings for how well participants felt they could control the simulator. There was a significant difference between visual conditions. Error bars are SEs.
Mean Ratings for "Did you find the task easy?"
Flying Condition
Visuals On/Off Motion On/Off Variable/Static Audio
M
ea
n
Ratin
g
1 2 3 4 5 6 7
[image:51.595.166.461.448.688.2]*<.0167
50
Mean Ratings for "How well could you predict the helicopter's movements?"
Flying Condition
Visuals On/Off Motion On/Off Variable/Static Audio
M
ean R
ating
1 2 3 4 5 6 7
[image:52.595.118.411.107.333.2]*<.0167
Fig. 24: Mean ratings for how easily participants could control the simulator. There was a significant difference between visual conditions. Error bars are SEs.
3.4.2 – Discussion
As in Experiment One, participants demonstrated rapid performance improvement during training on the low-fidelity simulator. Training transferred from the low-fidelity simulator to HELIFLIGHT (Section 3.1.1). Again, participants were asked to judge the usefulness of training to explore whether subject self-ratings co-varied with objective performance data. In contrast to Experiment One, participants reliably judged their self-performance in line with objective performance data. As the most accessible feature of the simulation, it is to be expected that participants judged visual cues as being the most important factor influencing their performance.
51
cue (Experiment 1). In spite of this, control input data showed that participants were more responsive to the variable auditory cue in Experiment Two compared to Experiment One (Section 3.1.1). Although the auditory motion cue did not offer improvement in performance or influence explicit ratings of performance, participants appear to have implicitly modified their task behaviours in response to the cue (Väljamäe et al., 2008; Väljamäe, 2009).
52 Chapter 4: Discussion and Conclusions
VR simulations are increasingly used to explore the concepts of fidelity and presence, as well as the effects of these constructs on training transfer from simulations to the real world. One can take steps to painstakingly replicate the physical and visual features of the simulated vehicle, but there is little focus on how realistic the user perceives the simulation to be, which may not be solely influenced by photorealistic replication. Are low-fidelity simulators effective training devices? Also, how do we measure the degree to which the user engages with the simulation captured by the concepts of fidelity, presence and performance? In light of this, two simulator-based experiments were conducted to explore how post-trial subjective ratings which evaluated the constructs of fidelity, presence and self-performance could be compared with objective, continuously-sampled task performance measures.
Previous literature has claimed that qualitative measures taken from novices are a poor tool for functional and physical fidelity evaluation, and that using an objective metric, such as task performance, as a referent for fidelity is more reliable (Schricker et al., 2001; Meehan et al., 2002). However, this idea has not been wholly supported by the findings of this study. In Experiment 1, there was some agreement between objective task performance and subjective ratings of simulator fidelity. Participants felt that the presence of motion cues made the experience in the simulator more realistic, which corresponded with better task performance with motion cues compared to without. This is an instance where subjective and objective measures of fidelity are correlated. Furthermore, an advantage of subjective evaluation is the relative ease with which data can be collected. These factors support the argument that subjective measures of fidelity may be as valuable as objective measures.