White Rose Research Online URL for this paper:
http://eprints.whiterose.ac.uk/109662/
Version: Accepted Version
Article:
Baker, Daniel H orcid.org/0000-0002-0161-443X and Meese, Tim S (2007) Binocular
contrast interactions : dichoptic masking is not a single process. Vision Research. pp.
3096-107. ISSN 0042-6989
https://doi.org/10.1016/j.visres.2007.08.013
[email protected] https://eprints.whiterose.ac.uk/ Reuse
This article is distributed under the terms of the Creative Commons Attribution-NonCommercial-NoDerivs (CC BY-NC-ND) licence. This licence only allows you to download this work and share it with others as long as you credit the authors, but you can’t change the article in any way or use it commercially. More
information and the full terms of the licence here: https://creativecommons.org/licenses/
Takedown
If you consider content in White Rose Research Online to be in breach of UK law, please notify us by
Binocular contrast interactions:
Dichoptic masking is not a single process
Daniel H. Baker & Tim S. Meese
School of Life and Health Sciences, Aston University, Birmingham, B4 7ET, UK
: [email protected]
Abstract
To decouple interocular suppression and binocular summation we varied the relative phase of mask and target in a 2IFC contrast‐masking paradigm. In Experiment I, dichoptic mask gratings had the same orientation and spatial frequency as the target. For in‐phase masking, suppression was strong (a log‐log slope of ~1) and there was weak facilitation at low mask contrasts. Anti‐phase masking was weaker (a log‐log slope of ~0.7) and there was no facilitation. A two‐stage model of contrast gain control (Meese, Georgeson and Baker, 2006, J. Vis, 6: 1224‐1243) provided a good fit to the in‐phase results and fixed its free parameters. It made successful predictions (with no free parameters) for the anti‐phase results when (A) interocular suppression was phase‐ indifferent but (B) binocular summation was phase sensitive. Experiments II and III showed that interocular suppression comprised two components: (i) a tuned effect with an orientation bandwidth of ~±33° and a spatial frequency bandwidth of >3 octaves, and (ii) an untuned effect that elevated threshold by a factor of between 2 and 4. Operationally, binocular summation was more tightly tuned, having an orientation bandwidth of ~±8°, and a spatial frequency bandwidth of ~0.5 octaves. Our results replicate the unusual shapes of the in‐phase dichoptic tuning functions reported by Legge (1979, Vis Res, 69: 838‐847). These can now be seen as the envelope of the direct effects from interocular suppression and the indirect effect from binocular summation, which contaminates the signal channel with a mask that has been suppressed by the target.
Keywords
: dichoptic masking, grating contrast, phase, orientation, spatial frequency,
binocular summation
1 Introduction
Contemporary studies of spatial contrast vision have focused on contrast gain control but with little attention to binocular interactions. Presumably, this was because the gain control circuitry was supposed to be cortical (e.g. Heeger, 1992) and assumed to lie after binocular combination. However, recent single‐cell studies (Truchard et al, 2000; Sengpiel & Vorobyov, 2005; Li, Peterson, Thompson, Duong & Freeman, 2005, Li, Thompson, Duong, Peterson & Freeman, 2006) and psychophysics (Meese & Hess, 2005; Ding & Sperling, 2006; Baker, Meese & Summers, 2007) have pointed to monocular processes and binocular interactions (Meese et al, 2006) that are fundamental to spatial contrast vision.
1.1 A model of binocular interactions
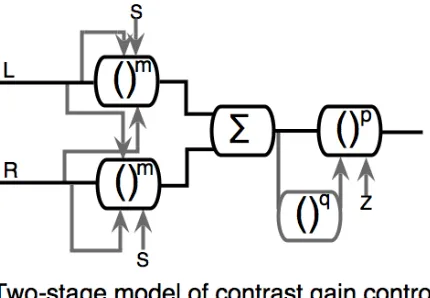
Figure 1: Schematic diagram of the two‐stage model of Meese et al. (2006). The left and right channels (L and R) pass through a stage of monocular excitation and binocular suppression (Stage 1), followed by binocular summation and a second stage of contrast gain control (stage 2). S denotes summation, and grey arrows indicate divisive suppression.
eyes (Meese et al, 2006), (ii) the wide range of facilitation found using binocular pedestals with unbalanced contrasts across the eyes (up to 18dB; a factor of 8); Baker, Meese & Georgeson, 2007), (iii) the unusually steep psychometric functions produced by dichoptic masks (Meese et al, 2006), (iv) the potent masking found at high dichoptic mask contrasts (Legge, 1979; Maehara and Goryo, 2005; Meese et al., 2006), and (v) the low levels of facilitation (~4dB; a factor of 1.6) at lower dichoptic mask contrasts (Levi et al., 1980; Blake and Levinson, 1977; Meese et al., 2006).
The model (Fig 1) includes an early stage of suppression where monocular contrast is controlled by binocular signals in a divisive gain pool (Meese et al, 2006). The excitatory exponent is slightly greater than unity (~1.3) and is placed before binocular summation. This accounts for the slightly sublinear levels of binocular summation that are typical for horizontal gratings (Meese et al, 2006; Baker, Meese & Summers, 2007) across a wide range of spatio‐temporal frequencies (Georgeson & Meese, 2005). Binocular summation of left and right channels takes place before a second stage of contrast gain control (see Baker, Meese & Georgeson, 2007, for further discussion).
In the model, Weber’s law behaviour emerges for dichoptic masking (a log‐log slope of ~1) owing to the combination of two factors. The first, termed the direct effect, is divisive interocular suppression of the signal in the target eye by the contrast in the mask eye. This produces masking with a log‐log slope of around 0.7 (Meese et al, 2006). The second, termed the indirect effect, is less obvious. It occurs because when dichoptic mask contrast is greater than a few percent, the target contrast is strongly suppressed, and must be set quite high for
this to be overcome. This causes substantial interocular suppression of the mask from the target, thus further reducing the overall output after binocular summation. Thus, the direct effect is due to masking of the target by the mask, and the indirect effect is due to masking of the mask by the target.
1.2 Motivations
[image:3.612.200.415.71.220.2]1994; Meese & Holmes, 2002; Meese & Hess, 2004), including binocular phase (Foley & Chen, 1999), it seems unlikely that this stimulus parameter will be critical. This view is also supported by physiological evidence for broad suppressive tuning (DeAngelis et al., 1994; Freeman et al, 2002; Sengpiel & Vorobyov, 2005; Sengpiel et al 2006; Li et al, 2005, 2006; Priebe & Ferster, 2006) including phase‐insensitivity for cross‐orientation interocular suppression (Sengpiel, Blakemore & Harrad, 1995). Thus, we aimed to decouple the hypothetical effects of direct and indirect dichoptic masking by controlling the relative phase of mask and target and subsequent binocular summation (we elaborate the details of this in section 3.1.1).
Our second aim was to explore the spatial tuning of the dichoptic effects. Spatial frequency (Legge, 1979) and orientation (Harrad and Hess, 1992; Levi et al., 1980) tuning functions have been reported in previous psychophysical studies, but were sparsely sampled and were measured and analyzed before contemporary treatments of contrast gain control had emerged. In the case of spatial frequency tuning, Legge (1979) reported unusual masking functions with broadly tuned skirts (>>1 octave), but a more tightly tuned central region around the target frequency. No explanation was offered for the shapes of these tuning functions.
2 Methods
2.1 Equipment
All stimuli were displayed on a Clinton Monoray monitor running at 120Hz (mean luminance 110cd/m2), using a ViSaGe framestore (Cambridge
Research Systems Ltd., Kent, UK) controlled by a PC. Dichoptic presentation was achieved using either ferro‐electric shutter goggles (CRS FE‐1) or a carefully calibrated mirror stereoscope (Stereoscope Version 2 described by Blake, 2004). A subjective method of calibration was used for each observer whereby the angles of the mirrors were adjusted such that fusion was effortless. The goggles attenuated the monitor luminance by 0.9 log units, so for consistency across equipment, neutral density filters (also 0.9 log units) were used with the stereoscope. Mean luminance at the eye was thus 14cd/m2. The goggles were used for
observer LP in Experiments II and III only, otherwise the stereoscope was used. Gamma correction was performed using lookup tables, ensuring luminance linearity over the full range of
contrasts used. This was confirmed by further photometric readings from the locations on the monitor where stimuli were displayed.
2.2 Stimuli
Narrow‐band targets (~0.4 octaves) were circular patches of 1cpd horizontal sinusoidal grating. In Experiment I, the mask was the same as the target and had either the same or opposite spatial phase (referred to as ‘in‐phase’ and ‘antiphase’). In Experiments II and III, the mask varied in spatial frequency and orientation respectively. In all experiments, mask and target gratings were spatially modulated by a raised cosine envelope. This had a central plateau diameter of 3° and blurred boundaries of 1°. Thus, the stimuli had an overall diameter of 5° and a full‐width at half‐ height of 4° (see Fig 1a in Meese et al, 2006 for an illustration of the stimulus). Mask and target gratings were always presented to different eyes (dichoptic presentation).
In addition to manipulating the relative phases of mask and target, the absolute phase of the entire stimulus was randomized from trial to trial to homogenize local luminance adaptation. The phase was selected from four sine‐phases (0, 90, 180, 270°) relative to a dark central fixation point that was visible throughout. The phase was the same in each of the 2IFC intervals (see below).
Contrast is expressed both as a percentage and in decibels (dB), defined as
20log
10(
C
%)
, whereC% is Michelson contrast in percent, defined as 100 LMAX‐LMIN
LMAX+LMIN, where L is luminance.
2.3 Procedure
Observers were seated in a darkened room, with their head in a support that had either the goggles or the stereoscope attached to it. The viewing distance was either 57cm (stereoscope) or 114cm (goggles). When the goggles were used, mask and target patches were displayed centrally against a background of mean luminance (110 cd/m2).
When the stereoscope was used, the centres of the mask and target patches were 12° apart on the display screen, each in the centre of a circular aperture (9° diameter). Mean luminances were 110 cd/m2 and <0.1 cd/m2 within and outside the
apertures respectively. The luminances at the eye were 14 cd/m2 and <0.01 cd/m2, respectively. The
(see also the Equipment subsection).
A two‐interval forced‐choice (2IFC) masking paradigm was used in which stimuli were displayed for 200ms, with a 500ms interstimulus interval (ISI). One interval contained both mask and target, and the other interval contained only the mask. Each interval was marked by a beep, and observers indicated which interval contained the target using a mouse. The tone of a subsequent beep indicated the correctness of each response.
A pair of interleaved ‘3‐down, 1‐up’ staircases selected stimulus levels for targets in the left and right eyes for each condition (Cornsweet, 1962; Wetherill and Levitt, 1965). In Experiment I, conditions were blocked by (i) relative phase between mask and target, and (ii) mask contrast, which ranged from 0% to 45% (33dB). Thus, a single experimental session measured sensitivity for each eye for a single mask contrast in a single phase with the target. This consisted of approximately 95 trials, which took around 5 minutes to complete.
In Experiments II and III the mask contrast was always 32% (30dB). The spatial frequency and orientation of the mask were interleaved within each experimental session, and were blocked
across the eye tested. This produced experimental sessions around 15 minutes in length. Baseline detection thresholds (0% mask contrast) were also recorded.
The experiments were conducted initially with a sampling scheme of 0.5 octaves for mask spatial frequency (over ±2 octaves) and 15 deg. for mask orientation (over ±90 deg). They were subsequently repeated with a sampling scheme of 1/8 octaves (over ±0.5 octaves) and 3 deg (over ±15 deg).
Experiments were repeated 4 times, and the data were pooled across target eye and replication (n = 8) before performing probit analysis (Finney, 1971) to estimate a threshold (at the 75% correct point) and standard error at each mask contrast.
2.4 Observers
Two observers completed all experiments. These were DHB (author, 24, male) and LP, a 24‐year old female undergraduate optometry student. LP was psychophysically naïve, and was not aware of the aims of the experiment. Both observers were emmetropic and had no abnormalities of binocular vision.
3 Results
3.1 Experiment I
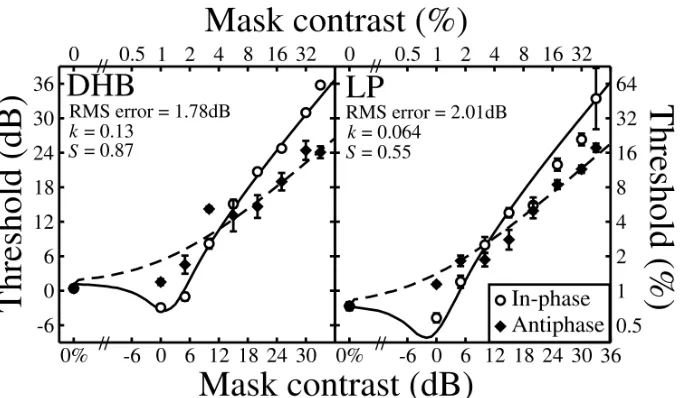
Figure 2 shows contrast masking functions for both observers. The in‐phase results are in good agreement with findings reported elsewhere (Levi et al, 1979, 1980; Meese et al., 2006). There is a shallow region of facilitation at low contrasts, and strong masking at high contrasts, which
approximates Weber’s law (slope of ~1). The antiphase results are rather different. There is no evidence of facilitation at low contrasts, and the masking function is shallower (slope of ~0.7) at the higher contrasts (see figure caption for details). These different slopes mean that masking was reduced by as much as 12dB (a factor of 4) when the mask‐phase was shifted from in‐phase to antiphase.
Figure 2: Dichoptic contrast‐masking functions. Mask and target gratings were either in‐phase (open circles), or out of phase by 180° (filled diamonds). Different panels are for different observers. Error bars show ±1SE of the probit fit to the thresholds. Solid curves are two‐parameter fits of the two‐stage model, as described in the text. The dashed curves are predictions (no free parameters) constrained by the in‐phase fits and with binocular summation disabled across phase in the model. Root‐mean‐square (RMS) errors (insets) are those calculated across both functions. The slopes of best fitting linear regressions (on double‐log axes) to the six highest mask contrasts were 1.15 and 0.53 (DHB) and 1.03 and 0.84 (LP) for the in‐phase and antiphase conditions respectively.
3.1.1 Modeling
For simplicity we assume that the observer is able to identify the mechanism(s) that carry the target, or a constant set of mechanisms, which always contains the relevant mechanism(s). With this, and an assumption of additive noise, we can treat the noise as late. We consider this further in the Discussion (Section 4.5).
The first stage for the left eye of the two‐stage model of contrast gain control (Meese et al, 2006) is:
stage
1
LEFT=
L
mS
+L
+
R
, (1)
where m is the stage 1 exponent, S is the stage 1 saturation constant, and L and R are the contrasts in the left and right eyes for gratings with the same spatial frequency and orientation as each other. There is an equivalent expression for the right eye.
When the mask and target have the same phase, stage 2 is given by:
stage2
in−phase=
(stage1
TARGET+
stage
1
MASK)
pZ
+
(stage
1
TARGET+
stage1
MASK)
q(2)
where p and q are stage 2 exponents, and Z is the stage 2 saturation constant. In the experiments here, the mask and target components were always presented to different eyes. Thus, we have replaced the earlier references to eye of origin with references to MASK and TARGET components. Equation 2 is the two‐stage model of Meese et al (2006) (Fig 1), expressed with specific notation for the in‐phase stimulus condition here.
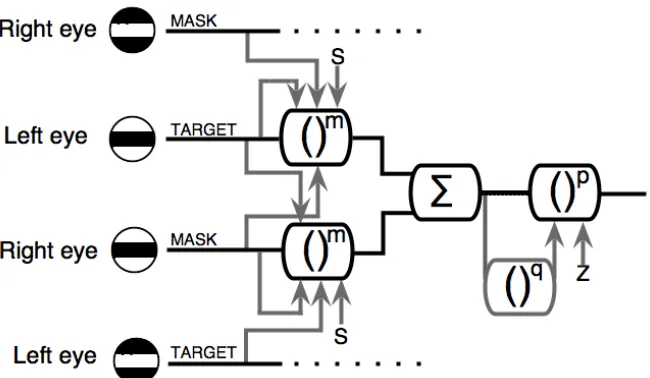
When the mask and target are in anti‐phase there is no excitatory convergence (Bacon, 1976; Simmons, 2005), and so stage 2 of the detecting mechanism is given by:
stage2
antiphase=
(stage1
TARGET)
pZ
+
(stage1
TARGET)
q . (3)
Note that in this case there are no MASK terms in the second stage; interactions can take place only at stage 1, where interocular suppression remains intact (see Fig 3).
[image:6.612.139.480.77.276.2]
Figure 3: Schematic diagram of the two‐stage model (Fig 1) extended to accommodate masking from dichoptic antiphase gratings. In the experiments there was only one target grating and one mask grating and these were always presented to different eyes.
The stimulus is detected when the response difference across the two stimulus intervals is greater than a criterion value k. Note that the
MASK contrast has the same values across the two intervals, whereas the TARGET contrast is zero in the null interval, and an unknown quantity in the target interval. The model equations were solved numerically for this unknown quantity.
To reduce the number of free parameters in the model we used four of the parameter values from Meese et al. (2006) (m = 1.28, p = 7.99, q = 6.59, Z = 0.076)1. The two remaining free parameters, k and
S, provided good control of individual differences (sensitivities) and were adjusted using a downhill simplex algorithm (Nelder and Mead, 1965) to fit the in‐phase data for each observer. The fits are shown by the solid curves in Figure 2. Having set all of the model parameters, we made deterministic predictions for the antiphase results. These are shown by the dashed curves in Figure 2. They account for several features of the data including the following. 1) There is no facilitation for the antiphase condition. 2) Masking occurs at lower mask contrasts for the antiphase condition than the in‐phase condition. 3) The masking function is shallower for the antiphase condition. 4) The two masking functions cross over at intermediate mask contrasts. As all of these effects were achieved without having to introduce a free parameter to control the weight of interocular
1
The model parameters in Meese et al (2006) were derived by fitting to data averaged across three observers (DHB, DJH and RJS). Of these, only DHB participated in the present study.
suppression (i.e. the suppressive weights were unity for both the in‐phase and antiphase conditions), the implication is that the suppressive process at stage 1 is not phase sensitive. On the other hand, the antiphase results required that binocular summation did not occur between mechanisms with opposite spatial phase, indicating that the excitatory summation stage of the model is phase dependent. Note that this implies that the suppression at stage 2 is also phase specific.
These results provide good support for the hypothesis that dichoptic masking is caused by two distinct processes, one of which is phase sensitive, the other not. We take advantage of this to measure the spatial tuning of binocular summation and interocular suppression in the next two experiments.
3.2 Experiment II: Spatial frequency tuning of dichoptic masking
[image:8.612.129.489.78.256.2]
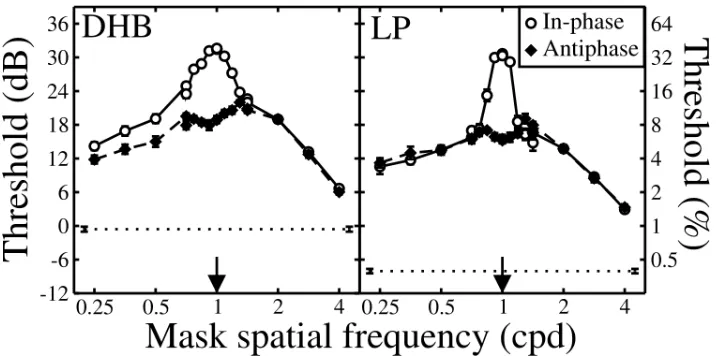
Figure 4: Dichoptic spatial frequency tuning functions. Mask and target gratings were either in‐phase (open circles), or out of phase by 180° (filled diamonds). All stimuli were horizontal. The spatial frequency of the target was 1 cpd (arrows). The horizontal dotted line shows the baseline detection threshold (0% mask contrast), and error bars show ±1SE of the probit fit.
The in‐phase results are consistent with those of Legge (1979), where a sharp peak was found at the target spatial frequency. However, the antiphase condition did not produce this peak, and had its maximum at a spatial frequency a little higher than the target frequency. The masking had a very a broad bandwidth, extending over the full ±2 octaves tested.
The results are strikingly similar across observers, though threshold elevation from the mask is typically greater for LP than DHB. For DHB, the two functions did not quite superimpose at low mask frequencies, whereas for LP they did. The cause of this difference is not clear, but it could be due to different detection strategies, or slight
differences in the phase‐tuning of the observers’ suppressive gain pool in this region.
[image:8.612.124.490.507.687.2]
3.3 Experiment III: Orientation tuning of dichoptic masking
Figure 5 shows the orientation tuning functions for both observers. The pattern of results is similar to that found for spatial frequency masking (Experiment II): the in‐phase function has a sharp peak at the target orientation, whereas the antiphase function does not. When the masks differ in orientation by more than 15°, the in‐phase and antiphase functions converge. Both functions are symmetrical about the target orientation.
The masking functions had very similar forms for both observers, though the overall level of masking was greater for LP than DHB (as in Experiment II). This extends earlier findings of individual differences in the magnitude of cross‐orientation dichoptic masking (Meese and Hess, 2004; Baker
et al., 2007b).
3.3.1 Bandwidths of the effects
To summarize the binocular interactions we fitted descriptive functions to the data consisting of a tuned component (a Gaussian) and a non‐tuned component (a fixed, or DC level). This was done with the following four‐parameter function:
y
=
Me
−(x−R)2/ 2σ2+
δ
, (4)where σ is the standard deviation of a Gaussian, M is the amplitude of the Gaussian, R is the lateral offset of the function and δ is the vertical elevation
from zero (a DC component). For orientation suppression, the masking functions were symmetrical about the target orientation and so the parameter R was fixed at zero. For binocular summation, there was little evidence of a DC component and so the parameter δ was fixed at
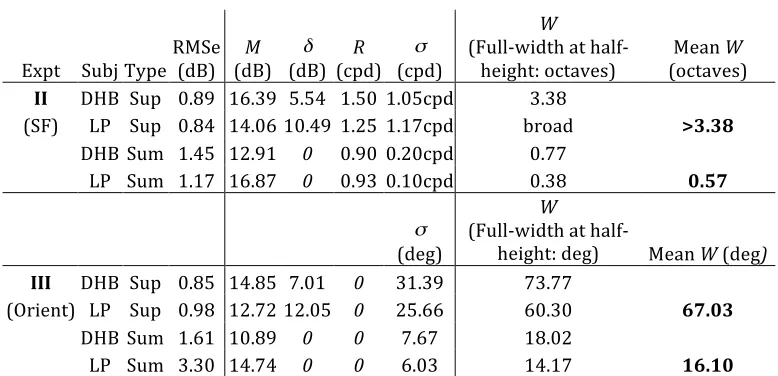
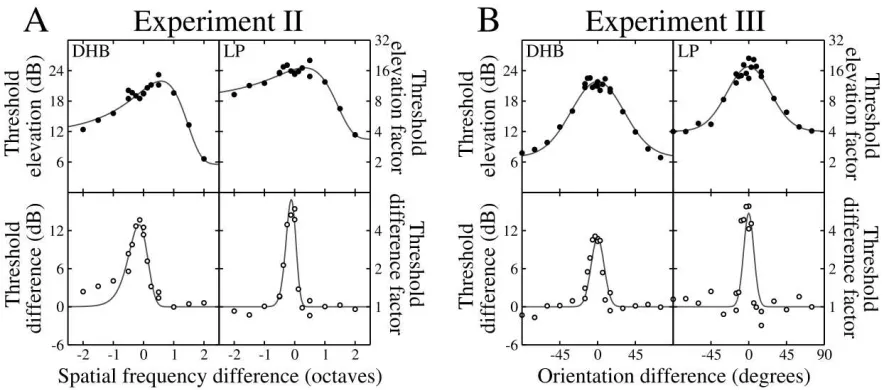
zero. For suppression, Equation 4 was fitted directly to the anti‐phase threshold‐elevation functions, which provided an estimate of suppressive pooling without contamination by binocular summation. For binocular summation, Equation 4 was fitted to the difference between the in‐phase and anti‐phase masking functions, to remove the effects of interocular suppression. In all cases, the equation was expressed in dB. The fitting was done using a downhill simplex algorithm (Nelder & Mead, 1965) to produce the best fits in the least‐squared sense (on a log scale). The fits are shown in Fig 6 and the parameter values are shown in Table 1. Note the distinct asymmetry to the spatial frequency masking functions when plotted on the conventional log spatial frequency axes here.
The bandwidth (full‐width at half‐height) of the tuned (Gaussian) component of Equation 4 is given by W and averaged across the two observers in Table 1. The spatial frequency bandwidth of tuned suppression was over three octaves (see table caption for details), but for summation it was only 0.57 octaves. The average orientation bandwidth for tuned suppression was 67°, but for binocular summation was only 16°.
Expt Subj Type RMSe (dB)
M
(dB)
δ
(dB)
R
(cpd)
σ
(cpd)
W
(Full‐width at half‐ height: octaves)
Mean W
(octaves)
II DHB Sup 0.89 16.39 5.54 1.50 1.05cpd 3.38
(SF) LP Sup 0.84 14.06 10.49 1.25 1.17cpd broad >3.38
DHB Sum 1.45 12.91 0 0.90 0.20cpd 0.77 LP Sum 1.17 16.87 0 0.93 0.10cpd 0.38 0.57
σ
(deg)
W
(Full‐width at half‐
height: deg) Mean W (deg)
III DHB Sup 0.85 14.85 7.01 0 31.39 73.77 (Orient) LP Sup 0.98 12.72 12.05 0 25.66 60.30 67.03
DHB Sum 1.61 10.89 0 0 7.67 18.02 LP Sum 3.30 14.74 0 0 6.03 14.17 16.10
[image:9.612.112.501.436.624.2]
Table 1: Parameter values and RMS errors for the fits of Equation 4 to the results from Experiments II and III. Parameters are as described in the text. Italicized values were fixed at 0. ‘Sup’ indicates suppression and ‘Sum’ indicates binocular summation. The suppressive octave bandwidth could not be expressed for observer LP as the linear half height extended below 0cpd.
[image:10.612.86.528.67.262.2]
Figure 6: Data and descriptive curve fitting from Experiments II and III. Upper panels are for the antiphase condition and lower panels are for the difference between the in‐phase and antiphase conditions. Smooth curves are the best fits of Equation 4, as described in the text (see also Table 1). Note that the spatial frequency axis is logarithmic, whereas the fitted Gaussian was linear on this dimension.
4 Discussion
Three experiments were performed to explore the phase, orientation, and spatial frequency tuning of dichoptic masking. Experiment I investigated the effects of changing the phase‐relation between mask and target from in‐phase to antiphase. This eliminated facilitation at low mask contrasts, and produced weaker masking at high mask contrasts. Our modelling suggests that the antiphase arrangement measures interocular suppression directly, without any additional masking from binocular summation (see section 4.6). Experiments II and III measured spatial frequency and orientation tuning for dichoptic masking, both in‐phase and in antiphase. This revealed broadly tuned and untuned components of suppression and a narrowly tuned component of summation.
Our results are consistent with the framework offered by our two‐stage model of contrast gain control (Meese et al, 2006) and rule out at least one candidate model of dichoptic masking: that of a peak‐picker or MAX rule. On this model, the observer selects the 2IFC interval containing the largest monoptic response (Baker, Meese, Mansouri & Hess, 2007). Thus, the target is detected when the activity in a monoptic target channel exceeds that of the monoptic mask channel. This means that the target contrast must be a little higher than the mask contrast2. In fact,
2
The presence of interocular suppression is irrelevant when considering the MAX rule amongst monocular signals because its action is effectively balanced across the eyes
the upper limb of the in‐phase masking function is consistent with this (open circles in Fig 2) but the antiphase results are not, since the target thresholds are lower than the mask contrasts (solid diamonds in Fig 2). Thus, a MAX rule does not work in general for the data here
4.1 Summation Bandwidths
We draw caution in treating the narrow summation bandwidths as estimates of the underlying filters because of the complicating factors that arise when spatially extensive stimuli are used (here, five grating cycles) with phase‐ sensitive systems. Bergen & Wilson (1979) showed that spatial probability summation can lead to an underestimation of the bandwidth of the detecting mechanism, and it is reasonable to suppose that similar problems might arise for the suprathreshold summation here. Thus, we view the narrow bandwidth for binocular summation as a functional summary of the psychophysical effects measured with large field gratings.
However, the narrow bandwidths that have emerged do have the benefit of providing a clear visual distinction between the within‐channel summation process and the broader cross‐channel suppressive processes. They also bear striking similarities with the bandwidths for binocular fusion measured in other studies where spatially extensive stimuli were used. For example,
Blakemore (1970) presented vertical gratings (3°x2.25°, 0.5‐15cpd) to the two eyes that differed in their spatial frequency. Observers reported a strong perception of depth that depended on the interocular spatial frequency ratio. When this occurred, observers saw a grating of a single spatial frequency, and did not experience binocular rivalry. This fusion took place over a limited range of spatial frequency ratios spanning about 0.5 octaves: very similar to the estimate here. Kertesz and Jones (1970) measured the range of interocular orientation differences over which observers could fuse two lines (10.5° arc) with different orientations. Observers reported strong fusion over a 10° range of orientations, in the absence of rotational eye movements, which were carefully measured. This small range in orientation difference is in rough correspondence with the ±8° orientation bandwidth of binocular summation found here.
Thus, it is plausible that the factors limiting dichoptic masking through binocular summation here are similar to those limiting binocular fusion and stereoscopic perception of depth in these other studies (regardless of the details of how depth is computed; see Howard & Rogers, 1995, p260).
4.2 Suppression
The broad tuning for the suppressive pooling here is consistent with previous psychophysical work using monoptic and binocular masks, (Burbeck & Kelly, 1981; Phillips & Wilson, 1984; Ferrerah & Wilson 1985; Lehky, 1985). In those studies, masking was most severe and most broadly tuned at low target spatial frequencies. Early work attributed these effects to broader bandwidths of the detecting mechanisms, but it is now clear that at least part of the explanation lies in the greater influence of the suppressive gain pool at low spatial frequencies (Meese & Holmes, 2007). In a recent study (Baker, Meese & Summers, 2007) we concluded that two different pathways support cross‐orientation suppression, one within‐eye (monoptic) and the other between eyes (dichoptic). Both of these pathways have their influence before binocular summation, and while the model here can accommodate these at a single site, we have speculated that they might impact in sequence (Baker et al 2007b). In any case, the bandwidth of the monocular route to cross‐ orientation suppression (not considered here) may be even broader than that of the dichoptic route (see Baker et al2007b).
Our modeling here suggests two components to interocular suppression. We have described one as broadly tuned (~67°, > 3 octaves) and the other as untuned, though we cannot rule out the possibility that some very broad tuning might have been found for the ‘untuned’ component had we extended the experiment to higher mask spatial frequencies. Our results do not indicate whether these two components are the envelope of a single process or the confluence of two different effects. Either is possible, though it is easy to see potential cortical substrates for the latter. The tuned effect, could arise from a weighted pool of oriented complex cells, consistent with early views on contrast gain control (Heeger, 1992). The untuned effect could arise from non‐oriented (isotropic) inhibitory complex cells such as those found in layer 4 of primary visual cortex in cats (Hirsch et al, 2003; Martinez et al, 2005). It might also be related to the isotropic suppressive process that has been reported in cats when the complicating factor of binocular excitation is avoided (Sengpiel, Freeman & Blakemore, 1995). This has been done by (i) recording from strabismic cats (Sengpiel et al, 1994; 2006) and (ii) by using a mask spatial frequency that is very different from that preferred by the target cell (Sengpiel et al, 1995). On the other hand, the process investigated by Sengpiel and his colleagues requires that the target mechanism is stimulated before the onset of the mask, whereas the onset of mask and target here were simultaneous. An isotropic suppression process has also been reported by Medina, Meese and Mullen (2007) for isoluminant binocular gratings. How this relates to interocular suppression is not yet clear but it shares other characteristics (spatio‐temporal dependencies) with dichoptic but not monoptic cross‐orientation suppression (Baker et al, 2007d).
4.3 Further comparisons with stereopsis
!
The study here was motivated by an interest in the binocular combination of contrast. This prompted the use of horizontal gratings to reduce the possibility of binocular mis‐registration. Although these stimuli are poor candidates for driving stereoscopic depth mechanisms, there are some relevant comparisons to be made with results on stereopsis. Mansfield and Parker (1993) used a masking paradigm to measure the orientation tuning of stereopsis. They used random dot stereograms filtered in orientation and spatial frequency as targets. Filtered noise patterns that were uncorrelated across eyes were used as masks. They found that contrast thresholds for depth identification were markedly tuned for orientation, with a bandwidth of 65° (averaged over observer and peak spatial frequency of the mask/target filter). This is very similar to the bandwidth for interocular suppression estimated above (67°). Furthermore, Mansfield and Parker also found an untuned suppressive component similar to that reported here. This tended to be stronger at the lower spatial frequencies (consistent with Meese & Holmes, 2007) but, curiously, was also strongest for targets that were filtered horizontally. In general, these results indicate that similar suppressive processes underlie dichoptic masking and stereo masking, and suggest that common mechanisms might be involved. Other results involving the disparity selectivity of masking also point to suppressive interactions between different disparity channels (Tyler & Kontsevich, 2005).
Several studies have considered the role of interocular contrast differences in stereopsis, typically finding that disparity thresholds are greatly affected by a contrast difference between the eyes (Legge & Gu, 1989; Schor & Heckmann, 1989; Simmons, 1998), particularly for narrowband low spatial frequency stimuli (Halpern & Blake, 1988; Cormack, Stevenson & Landers, 1997; Hess, Liu & Wang, 2003). It is plausible that such effects are mediated by processing modules of the type investigated here.
4.4 Further comparisons with singlecell physiology
Several studies have investigated binocular interactions in cat in the context of contemporary models of contrast gain control (Walker et al, 1998; Truchard et al, 2000; Li et al, 2005; Sengpiel & Vorobyov, 2005). Of particular relevance here, Sengpiel and Vorobyov (2005) stimulated striate cells with an optimal grating in the dominant eye,
and gratings of variable orientation in the other eye. Activation increased when the dichoptic grating was within about ±20° of the cell’s optimal orientation (summation) and reduced at more distant orientations (suppression). The summation was unaffected by the introduction of bicuculline (a GABA antagonist), whereas suppression from orthogonal gratings was diminished. These findings suggest that GABA‐mediated intracortical inhibition was responsible for the suppression but that summation is mediated by a different (excitatory) mechanism. Further experiments in cats (Sengpiel & Vorobyov, 2005; Li et al, 2005) and in humans (Baker, Meese & Summers, 2007) found that the potency of dichoptic cross‐ orientation suppression was much reduced by adapting to the mask, which also points to a cortical locus for this effect (Ohzawa et al, 1985; Duong & Freeman, 2007). This all suggests a plausible cellular basis for the processes reported here.
Although there are strong parallels between the human psychophysics (Baker et al, 2007b) and the single‐cell physiology of cats (Li et al, 2005; Sengpiel & Vorobyov, 2005), models of these two operational levels have not fully converged. Truchard et al (1998) recorded from binocular cells in cats that were stimulated by parallel gratings in each eye. They concluded that the binocular summing device is linear but that contrast gain control occurs both before and after excitatory convergence. This is broadly consistent with the scheme of our two‐stage model (Fig 1). However, their analysis suggested that interocular suppression made, at most, a weak contribution to the overall gain control. One possibility is that the relatively weak interocular suppression in Truchard et al’s model is part of the isotropic (and phase‐independent) suppression reported here and in cat physiology (Sengpiel et al, 1994; Sengpiel, Freeman & Blakemore, 1995; Sengpiel, Blakemore & Harrad, 1995; Walker et al, 1998; Sengpiel & Vorobyov, 2005; Li et al, 2005). But this still leaves the tuned component of suppression here without a specific physiological analogue. More generally, it is difficult to reconcile the substantial contributions of interocular suppression for parallel gratings in the models here (Fig 1) and elsewhere (Kontsevich & Tyler, 1994; Meese & Hess, 2004; Ding & Sperling, 2006; Baker et al, 2007a; see also section 4.2) with the evidence for weak interocular suppression in striate cortex (Truchard et al, 1998; Macknik & Martinez‐Conde, 2004).
There are also other differences between the psychophysics and the behaviour of binocular cells in primary visual cortex. For example, studies in cat (Ohzawa & Freeman, 1995; Truchard et al, 1998) and monkey (Smith et al, 1997a, 1997b) have found numerous binocular cells for which responses are considerably greater when stimulated with two eyes than with one, as to be expected if the signals are summed. But perceived contrast (Baker et al, 2007a) and contrast discrimination thresholds (Legge, 1984; Meese et al, 2006) change very little in these circumstances. In the psychophysical model (Fig 1) this is because the binocular advantage is substantially diminished by corresponding interocular suppression. Another problem arises because physiological models of binocular cells (Ohzawa & Freeman, 1985; Truchard et al, 1998) propose linear combination of contrast across the eyes before rectification (Smith et al, 1997b) or in a push‐pull arrangement after rectification (Read, Parker & Cumming, 2002). This explains the modulatory effects that are found in binocular cells when the phase of a grating in one eye is varied relative to that in the other. When the relative phases are 180° (i.e. antiphase), cancellation is substantial and can be complete (i.e. the binocular response is reduced to zero). If these cells were to drive performance in the antiphase conditions here, then the implication is that the observer’s task is to select the 2IFC interval with the lower overall contrast. The subjective reports of both observers confirmed that this visual cue (contrast reduction by an antiphase target) was not available to them. Instead, the task was one of detecting the interval in which “something else” appeared in addition to the mask grating. Thus, it seems unlikely that binocular striate cells (of the type described above at least) are directly linked with the observer’s decision variable in the experiments here and elsewhere (Baker et al, 2007a).
There are several factors that could be important for the discrepancies between psychophysical behaviour and single‐cell activity. First, the present study was conducted at detection threshold for the target, whereas the physiological work typically investigates suprathreshold interactions. Second, the physiology reviewed above pertains to single units in primary visual cortex (mainly area 17 in cat), whereas the psychophysical study here applies to the entire behaving system. Thus, the analysis here might relate to populations rather than individual cells (Anderson & Movshon, 1989) and in any case, might involve other areas higher in the visual
hierarchy (Tse et al, 2005). Third, there could be species differences (cat vs humans). For example, it is reported that ocular dominance columns shower greater segregation (i.e. less binocular summation) in primate than cat, indicating detailed differences of binocular organization (see Smith et al, 1997).
4.5 Channel uncertainty and facilitation
Earlier (Section 3.1.1) we made the simplifying model assumption that the observer monitors the same set of mechanisms in the different conditions. But when the mask is a pedestal, this is not necessarily the case (Pelli, 1985; Tyler & Chen, 2000). When the pedestal is above its own detection threshold, the phase of the pedestal provides a clear indication of the phase of the target in both in‐phase and antiphase conditions. However, when the pedestal is below detection threshold, this cue is not available and the target could have any one of the four absolute phases (see Methods) in both of the conditions. Thus, if the observer used the pedestal to reduce extrinsic phase‐uncertainty this could reduce the number of mechanisms monitored by a factor of four. According to Tyler & Chen (their Table 1), this would reduce detection thresholds by a factor of 1.44 (3.18 dB), which is consistent with the level of dichoptic facilitation estimated in Experiment I (3.34 dB for DHB and 2.05 dB for LP). Meese et al (2006) measured dichoptic masking under similar conditions and found dichoptic facilitation of 4.1 dB (a factor of 1.6) averaged across three observers. Thus, reduction of phase uncertainty is a viable account of dichoptic facilitation.
Tyler & Chen, 2000). However, if this account is to be preferred then it poses problems for the more widespread suggestion that reduction of uncertainty is responsible for the facilitation in monoptic and binocular dipper functions (Pelli, 1985). This is typically in the order of ~9dB (a factor of 2.8), which requires that the pedestal must reduce uncertainty by a factor of ~1000 (Tyler & Chen, 2000). It remains a challenge to devise a plausible model where the reduction of uncertainty is 143 times greater when the pedestal and target are placed in the same eye compared to when they are in different eyes.
However, one problem remains for the antiphase condition of our deterministic model. When the pedestal contrast is close to detection threshold, it cannot be identified reliably. This is likely to lead to confusions between target and mask across the 2IFC intervals. Our model (Section 3.1.1) does not suffer from these confusions and so might be expected to overestimate performance in this low contrast antiphase dichoptic mask region. In fact, if anything, it slightly underestimates performance in this region (solid diamonds at a mask contrast of 0dB in Fig 2). This nuance of psychophysical behaviour remains unresolved, but if low levels of phase insensitive binocular summation were present around detection threshold (Georgeson & Meese, 2007) this might accommodate the result.
4.6 Two main contributions to dichoptic masking
The results of this study support our hypothesis that there are two very different contributions to dichoptic masking when the mask and target gratings are very similar in orientation, spatial frequency and phase. A direct effect comes from interocular suppression of the target by the mask, and is responsible for a log‐log masking slope of ~0.7. An indirect effect arises from interocular suppression of the mask by the target, and increases the masking slope to ~1. Note that in the model here, the effect of binocular summation is to contaminate the target channel with a mask that is suppressed by the target at stage 1. This diminishes the overall response in the target interval, and masking occurs3. Thus, in contrast to
earlier models (Legge, 1984b), binocular summation between the target and the dichoptic mask is not responsible for driving the binocular response into compression (which would also produce masking). For example, when pq > 1 (as it
3
The indirect effect of dichoptic masking here is an example of a more general idea referred to by Meese and Summers (2007) as dilution masking.
is here; see section 3.1.1) sensitivity is in fact enhanced by stage 2 because the overall exponent (pq) (see Eq 2) accelerates the contrast‐response.
A key feature of our model is that all types of masking involve a component of suppression (and late additive noise). This general approach contrasts with other models in which masking is attributed to multiplicative noise that grows with the contrast of the mask (Kontsevich, Chen & Tyler, 2002; McIlhagga & Peterson, 2006; Solomon, 2007). That type of model has not been developed to handle binocular interactions, but the results here pose a challenge as we describe below.
4.7 Multiplicative noise
multiplicative noise remains plausible (Itti, Koch & Baun, 2000; Chirimuuta & Tolhurst, 2005).
5 Summary
To investigate the processes underlying dichoptic masking for grating stimuli we extended Legge’s (1979, 1984) earlier work to include a condition where the mask and target are in antiphase. This showed that binocular summation is phase sensitive and interocular suppression is not. More importantly, the results confirmed our hypothesis that there are two functional components to conventional (in‐phase) dichoptic masking: (i) interocular suppression from the mask on the target and (ii) contamination of the target with a weakened mask component due to binocular summation. We manipulated target and dichoptic mask phase to decouple the effects of suppression and summation so as to measure their bandwidths independently. This showed that the spatial tuning for suppression is much broader than for summation. It also showed that there are two components to suppression: one tuned, the other untuned. The results are consistent with our two‐ stage model of contrast gain control involving late additive noise. They pose a challenge to models that attribute contrast masking solely to multiplicative noise.
6 Acknowledgements
This work was supported by a grant from the UK Engineering and Physical Sciences Research Council (GR/S74515/01) awarded to Tim Meese
and Mark Georgeson. The authors thank Mark Georgeson and two anonymous reviewers for their constructive comments.
7
Appendix
A:
Extrinsic
phase
uncertainty is not a factor
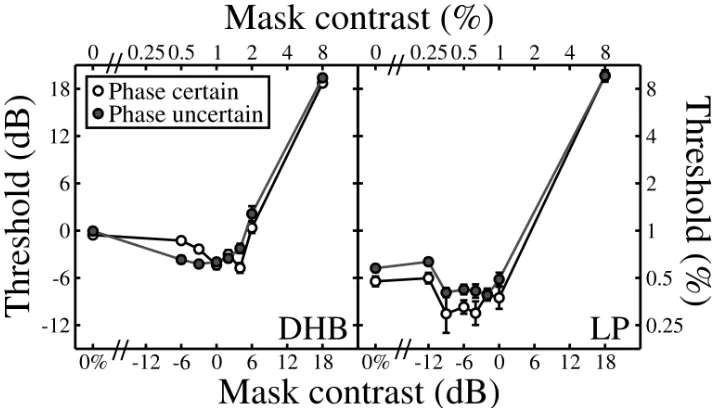
We performed a control experiment using the same methods and stimuli as in the main experiments. Dichoptic masking was measured for mask and target stimuli that always had the same phase under two conditions of extrinsic uncertainty. In a phase uncertain condition (solid symbols, Fig A1), the absolute phase was randomized (across phases of 0°, 90°, 180° and 270°) on a trial‐by‐trial basis in exactly the same way as in the main experiment. In a phase certain condition (open symbols, Fig A1), blocks of trials were performed where the absolute phase was fixed at one of the four phases used. The beginning of each block began with a high contrast target stimulus (24dB; 16%) that provided a clear indication of the target (and mask) phase. Its contrast was subsequently controlled by a staircase (see main methods).
The maximum level of pedestal facilitation was 4.19dB (DHB) and 4.11dB (LP) (factors of ~1.6) for the phase certain condition, and 4.18dB (DHB) and 3.43dB (LP) (factors of 1.6 and 1.5 respectively) for the phase uncertain condition. Clearly, extrinsic phase uncertainty is not responsible for dichoptic pedestal facilitation.
[image:15.612.128.487.496.700.2]
8 References
Anderson, P. A. and Movshon, J. A. (1989) Binocular combination of contrast signals.
Vision Research, 29, 1115‐1132.
Bacon, J. H. (1976). The interaction of dichoptically presented spatial gratings, Vision Res 16: 337–
344.
Baker, D. H., Meese, T. S. and Georgeson, M. A. (2007a). Models of binocular contrast discrimination predict binocular contrast matching, Spatial Vis 20: 397‐413.
Baker, D. H., Meese, T. S. and Summers, R. J. (2007b). Psychophysical evidence for two routes to suppression before binocular summation of signals in human vision,
Neuroscience, 146: 435‐448.
Baker, D. H., Meese, T. S., Mansouri, B. and Hess, R.F. (2007c). Monoptic, dichoptic and binocular masking in strabismic amblyopia, Perception,
36(S): 302.
Baker, D. H., Meese, T. S., Patel, K. and Sarwar, W. (2007d) Interocular suppression is scale invariant, but ipsiocular suppression is weighted by flicker speed. Perception (in press; ECVP abstract).
Bergen, J. R., Wilson, H. R. and Cowan, J. D. (1979). Further evidence forSaw four mechanisms mediating vision at threshold: sensitivities to complex gratings and aperiodic stimuli, J Opt Soc Am, 69: 1580‐1587.
Blake, R. (2004) Blake Lab Stereoscopes. http://psych‐
s1.psy.vanderbilt.edu/faculty/blaker/Stereosco pe/stereoscope.html
Blake, R. and Levinson, E. (1977). Spatial properties of binocular neurones in the human visual system, Exp Brain Res 27: 221–232.
Blakemore, C. (1970). A new kind of stereoscopic vision, Vision Res 10: 1181–1199.
Burbeck, C. A. and Kelly, D. H. (1981). Contrast gain measurements and the transient/sustained, J Opt Soc Am A, 71: 1335‐1342.
Campbell, F. and Green, D. G. (1965). Monocular versus binocular visual acuity, Nature
208: 191–192.
Chirimuuta, M. & Tolhurst, D. J. (2005) Does a Bayesian model of V1 contrast coding offer a neurophysiological account of human contrast discrimination? Vision Research, 45, 2943‐
2959.
Cormack, L. K., Stevenson, S. B. andLanders, D. D. (1997). Interactions of spatial frequency and unequal monocular contrasts in stereopsis.
Perception 26:1121‐1136.
Cornsweet, T. N. (1962). The staircase‐method in psychophysics, American Journal Of Psychology
75: 485–491.
DeAngelis, G. C., Freeman, R. D. and Ohzawa, I. (1994). Length and width tuning of neurons in the cat’s primary visual cortex, J Neurophysiol,
71: 347‐374.
Ding, J. and Sperling, G. (2006). A gain‐control theory of binocular combination, Proc Natl Acad Sci U.S.A., 103: 1141‐1146.
Duong, T. and Freeman, R. D. (2007) Spatial frequency specific contrast adaptation originates in the primary visual cortex. Journal of Neurophysiology, in press.
Eriksen, C. W. (1966). Independence of successive inputs and uncorrelated error in visual form perception, J Exp Psychol 72: 26–35.
Ferrera, V. P. and Wilson, H. R. (1985). Spatial frequency tuning of transient non‐oriented units, Vision Res, 25: 67‐72.
Finney, D. J. (1971). Probit Analysis, Cambridge University Press.
Georgeson, M. A. and Meese, T. S. (2005). Binocular summation at contrast threshold: a new look,
Perception 34(S): 141.
Foley, J. M. (1994). Human luminance pattern‐ vision mechanisms: masking experiments require a new model, J Opt Soc Am A, 11: 1710‐
1719.
Foley, J. M. and Chen, C. –C.(1999) Pattern detection in the presence of maskers that differ in spatial phase and temporal offset: threshold measurements and a model. Vision Research,
39, 3855‐3872.
Freeman, T. C., Durand, S., Kiper, D. C. and Carandini, M. (2002). Suppression without inhibition in visual cortex, Neuron, 35: 759‐
771.
Georgeson, M. A. and Meese, T. S. (2005). Binocular summation at contrast threshold: a new look,
Perception, 34(S): 141.
Georgeson, M. A. and Meese, T. S. (2007). Binocular combination at threshold: temporal filtering and summation of signals in separate ON and OFF channels. Perception (in press; ECVP abstract).
Green, M. and Blake, R. (1981). Phase effects in monoptic and dichoptic temporal integration: flicker and motion detection, Vision Res
21: 365–372.
Halpern, D. L. and Blake, R. R. (1988). How contrast affects stereoacuity. Perception 17:
483‐495.
Harrad, R. A. and Hess, R. F. (1992). Binocular integration of contrast information in amblyopia, Vision Res 32: 2135–2150.