On The Use Of Text Classification Methods For Text
Summarisation
Thesis submitted in accordance with the requirements of the University of Liverpool for the degree of Doctor in Philosophy
by
Matias Fernando Garcia-Constantino
Dedication
Acknowledgement
First and foremost, I am very grateful to my first supervisor Prof. Frans Coenen, for all his patience, constant support, excellent advice and encouragement throughout my four-year study. Without him, the successful completion of this thesis would not have been possible. It has been a privilege to have worked with him.
I also want to thank my second supervisors from the Veterinary Science School, Dr. Alan Radford and Dr. P-J Noble, for their support and advice regarding the Veterinary Science data used in my research. Special thanks also to Dr. Christian Setzkorn for his useful opinions and advice.
I would also like to acknowledge my family and friends for all their love, motivation and support that has helped me to carry on through my PhD studies. Particular thanks go to: my parents Patricia Constantino Casas and Mat´ıas Garc´ıa Ruiz have always supported and encouraged me in all my plans and decisions; my uncle Dr. Fernando Constantino Casas and my friends Dr. Simon Holgate, Dr. Luis Carlos Molina F´elix, Dr. Stalin Mu˜noz Guti´errez and Dr. Omar Baqueiro Espinosa for all their advice and support. I would also like to thank: Dr. Rolando Medell´ın Gasque, which was also doing his PhD but one year ahead, for his friendship, patience and support; my colleague Dr. Stephanie Chua for all her support; my colleague Agneau Belanyek for his friendship and support; and my girlfriend Sarah Cullen, for all her love, support and inspiration.
Abstract
Contents
Dedication i
Acknowledgement ii
Abstract iii
Contents iv
List of Figures x
List of Tables xi
1 Introduction 1
1.1 Overview . . . 1
1.2 Motivation . . . 3
1.3 Research question and issues . . . 5
1.4 Problem definition . . . 6
1.5 Research Methodology . . . 6
1.6 Contributions . . . 7
1.7 Organisation of the thesis . . . 8
1.8 Publications . . . 9
1.9 Summary . . . 11
2 Literature Review 12 2.1 Introduction . . . 12
2.2 Data Mining and the Knowledge Discovery in Databases (KDD) process 12 2.3 Questionnaire Data Mining (QDM) . . . 14
2.3.1 Overview of QDM approaches . . . 15
2.3.2 QDM approaches directed at closed-ended questions (tabular data) 16 2.3.3 QDM approaches directed at open-ended questions (free text) . . 17
2.3.4 QDM approaches directed at both closed-ended and open-ended questions (tabular data and free text) . . . 19
2.4.1 Feature Selection in Text Classification . . . 21
2.4.1.1 Information Gain (IG) . . . 21
2.4.1.2 Chi-squared (χ2) statistic . . . 22
2.4.1.3 Correlation Feature Selection (CFS) . . . 23
2.4.1.4 Feature Weighting with Term Frequency-Inverse Docu-ment Frequency (TF-IDF) . . . 23
2.4.1.5 Feature selection methods used . . . 24
2.4.2 Relevant Text Classification algorithms . . . 25
2.4.2.1 Bayesian Classifiers . . . 25
2.4.2.2 Decision Trees . . . 26
2.4.2.3 Rule Learners . . . 26
2.4.2.4 Nearest Neighbour Techniques . . . 27
2.4.2.5 Support Vector Machines (SVM) . . . 27
2.4.3 Evaluation measures for Text Classification . . . 28
2.4.3.1 Confusion Matrix . . . 28
2.4.3.2 Accuracy . . . 28
2.4.3.3 Precision . . . 29
2.4.3.4 Recall/Sensitivity . . . 29
2.4.3.5 Specificity . . . 29
2.4.3.6 Area Under the ROC Curve (AUC) . . . 29
2.5 Text Summarisation . . . 30
2.5.1 Categorisation of Text Summarisation techniques . . . 30
2.5.2 Relevant Text Summarisation approaches . . . 33
2.5.2.1 Techniques based on lexical chains . . . 33
2.5.2.2 Techniques based on sentence extraction and ranking . 34 2.5.2.3 Other techniques . . . 35
2.5.3 Text Summarisation approaches that use Text Classification meth-ods . . . 36
2.5.4 Evaluation measures for Text Summarisation . . . 36
2.6 Summary . . . 37
3 Evaluation Data Sets and Data Preprocessing 38 3.1 Introduction . . . 38
3.2 Data Preprocessing . . . 40
3.2.1 Tabular Data . . . 40
3.2.2 Free Text . . . 41
3.3 Small Animal Veterinary Surveillance Network (SAVSNET) . . . 43
3.3.1 Description of the SAVSNET data set . . . 43
3.3.1.1 SAVSNET-840-4-FT . . . 44
3.3.1.3 SAVSNET-971-3-FT . . . 45
3.3.1.4 SAVSNET-971-3-TD+FT . . . 45
3.3.1.5 SAVSNET-917-4H . . . 45
3.3.2 Preprocessing of the SAVSNET data set . . . 47
3.4 OHSUMED . . . 53
3.4.1 Description of the OHSUMED data set . . . 54
3.4.1.1 OHSUMED-CA-3187-3H (Cardiovascular Abnormalities) 55 3.4.1.2 OHSUMED-AD-3393-3H (Animal Diseases) . . . 55
3.4.2 Preprocessing of the OHSUMED data set . . . 56
3.5 Reuters-21578 . . . 59
3.5.1 Description of the Reuters-21578 data set . . . 59
3.5.1.1 Reuters-21578-LOC-2327-2H . . . 60
3.5.1.2 Reuters-21578-COM-2327-2H . . . 61
3.5.2 Preprocessing of the Reuters-21578 data set . . . 61
3.6 Summary . . . 63
4 Using Standard Classification Techniques for Text Summarisation 67 4.1 Introduction . . . 67
4.2 Methodology . . . 68
4.2.1 Classification . . . 68
4.2.2 Summary Generation . . . 69
4.3 Experiments and Results . . . 70
4.3.1 SAVSNET-840-4 . . . 71
4.3.2 SAVSNET-971-3 . . . 75
4.3.3 SAVSNET-917-4H . . . 77
4.3.3.1 SAVSNET-917-1L . . . 77
4.3.3.2 SAVSNET-917-2L . . . 77
4.3.3.3 SAVSNET-917-3L . . . 79
4.3.3.4 SAVSNET-917-4L . . . 79
4.3.4 OHSUMED-CA-3187-3H . . . 81
4.3.4.1 OHSUMED-CA-3187-1L . . . 81
4.3.4.2 OHSUMED-CA-2570-2L . . . 81
4.3.4.3 OHSUMED-CA-834-3L . . . 83
4.3.5 OHSUMED-AD-3393-3H . . . 85
4.3.5.1 OHSUMED-AD-3393-1L . . . 85
4.3.5.2 OHSUMED-AD-569-2L . . . 85
4.3.5.3 OHSUMED-AD-292-3L . . . 86
4.3.6 Reuters-21578-LOC-2327-2H . . . 88
4.3.6.1 Reuters-21578-LOC-2327-1L . . . 88
4.3.7 Reuters-21578-COM-2327-2H . . . 90
4.3.7.1 Reuters-21578-COM-2327-1L . . . 90
4.3.7.2 Reuters-21578-COM-2327-2L . . . 90
4.3.8 Evaluation Summary . . . 92
4.4 Text Summarisation . . . 94
4.5 Discussion . . . 105
4.6 Summary . . . 106
5 Classifier Generation Using Secondary Data (CGUSD) for Text Sum-marisation 107 5.1 Introduction . . . 107
5.2 The Classifier Generation Using Secondary Data (CGUSD) Methodology 108 5.2.1 Secondary data set generation . . . 110
5.2.2 Classification . . . 112
5.3 Secondary data sets used . . . 113
5.3.1 MEDLINE (Medical Literature Analysis and Retrieval System Online) . . . 113
5.3.1.1 SAVSNET . . . 114
5.3.1.2 OHSUMED . . . 114
5.3.2 RCV1 (Reuters Corpus Volume 1) . . . 115
5.3.2.1 Reuters-21578 . . . 115
5.4 Experiments and Results . . . 115
5.4.1 SAVSNET-840-4-FT . . . 117
5.4.2 SAVSNET-971-3-FT . . . 118
5.4.3 SAVSNET-917 . . . 119
5.4.3.1 SAVSNET-917-1L . . . 119
5.4.4 OHSUMED-CA-3187 . . . 119
5.4.4.1 OHSUMED-CA-3187-1L . . . 120
5.4.4.2 OHSUMED-CA-2570-2L . . . 120
5.4.4.3 OHSUMED-CA-834-3L . . . 122
5.4.5 OHSUMED-AD-3393 . . . 123
5.4.5.1 OHSUMED-AD-3393-1L . . . 123
5.4.5.2 OHSUMED-AD-569-2L . . . 123
5.4.5.3 OHSUMED-AD-292-3L . . . 124
5.4.6 Reuters-21578-LOC-2327-2H . . . 125
5.4.6.1 Reuters-21578-LOC-2327-1L . . . 125
5.4.6.2 Reuters-21578-LOC-2327-2L . . . 125
5.4.7 Reuters-21578-COM-2327-2H . . . 127
5.4.7.1 Reuters-21578-COM-2327-1L . . . 127
5.6 Summary . . . 129
6 Using a Semi-Automated Rule Summarisation Extraction Tool (SARSET) for Text Summarisation 131 6.1 Introduction . . . 131
6.2 The SARSET Methodology . . . 133
6.2.1 Problem definition . . . 133
6.2.2 Classifier Generation Using SARSET (Semi-Automated Rule Sum-marisation Extraction Tool) . . . 134
6.2.3 Phrase identification and generation of phrase variations (Step 1) 134 6.2.4 Identification of questionnaires covered by identified phrases (Step 2) . . . 136
6.2.5 Rule generation (Steps 3 and 4) . . . 137
6.2.6 Continuation of the process or exit (Step 5) . . . 139
6.2.7 Applying classification rules to unseen documents . . . 139
6.3 Experiments and Results . . . 140
6.3.1 SAVSNET-840-4-FT . . . 141
6.3.2 SAVSNET-971-3-FT . . . 142
6.3.3 SAVSNET-917 . . . 142
6.3.3.1 SAVSNET-917-1L . . . 142
6.3.3.2 SAVSNET-917-2L . . . 143
6.3.3.3 SAVSNET-917-3L . . . 143
6.3.3.4 SAVSNET-917-4L . . . 144
6.3.4 OHSUMED-CA-3187 . . . 144
6.3.4.1 OHSUMED-CA-3187-1L . . . 144
6.3.4.2 OHSUMED-CA-2570-2L . . . 145
6.3.4.3 OHSUMED-CA-834-3L . . . 145
6.3.5 OHSUMED-AD-3393 . . . 145
6.3.5.1 OHSUMED-AD-3393-1L . . . 146
6.3.5.2 OHSUMED-AD-569-2L . . . 146
6.3.5.3 OHSUMED-AD-292-3L . . . 146
6.3.6 Reuters-21578-LOC-2327-2H . . . 147
6.3.6.1 Reuters-21578-LOC-2327-1L . . . 147
6.3.6.2 Reuters-21578-LOC-2327-2L . . . 147
6.3.7 Reuters-21578-COM-2327-2H . . . 148
6.3.7.1 Reuters-21578-COM-2327-1L . . . 148
6.3.7.2 Reuters-21578-COM-2327-2L . . . 148
6.4 Discussion . . . 149
7 Text Summarisation Using Hierarchical Text Classification 154
7.1 Introduction . . . 154
7.2 Methodology . . . 157
7.2.1 Problem definition . . . 157
7.2.2 Hierarchical Classification . . . 158
7.2.3 Summary Generation . . . 160
7.3 Hierarchical data sets used . . . 160
7.3.1 SAVSNET-917-4H . . . 160
7.3.2 OHSUMED-CA-3187-3H . . . 161
7.3.3 OHSUMED-AD-3393-3H . . . 162
7.3.4 Reuters-21578 . . . 162
7.3.4.1 Reuters-21578-LOC-2327-2H . . . 163
7.3.4.2 Reuters-21578-COM-2327-2H . . . 163
7.4 Experiments and Results . . . 164
7.4.1 SAVSNET-917-4H . . . 169
7.4.2 OHSUMED-CA-3187-3H . . . 169
7.4.3 OHSUMED-AD-3393-3H . . . 170
7.4.4 Reuters-21578-LOC-2327-2H . . . 170
7.4.5 Reuters-21578-COM-2327-2H . . . 170
7.4.6 Text Summarisation . . . 171
7.4.6.1 SAVSNET . . . 171
7.4.6.2 OHSUMED . . . 171
7.4.6.3 Reuters-21578 . . . 172
7.5 Discussion . . . 172
7.6 Summary . . . 181
8 Conclusions and Future Work 182 8.1 Summary . . . 182
8.2 Main Findings and Contributions . . . 185
8.3 Future Directions . . . 188
Bibliography 191
A Distribution of records per class with respect to the evaluation data
sets used 201
B Additional Experimental Results 211
List of Figures
2.1 Goals of Data Mining . . . 13
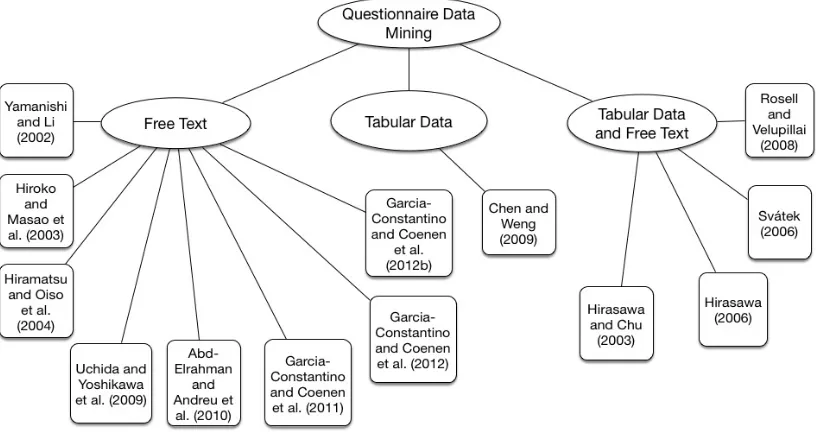
2.2 Questionnaire Data Mining relevant approaches. . . 16
2.3 Text Classification. . . 20
2.4 Input factors to be considered for text summarisation . . . 31
2.5 Purpose factors to be considered for text summarisation . . . 31
2.6 Output factors to be considered for text summarisation . . . 32
3.1 Example fragment of raw questionnaire data in CSV format. . . 48
3.2 Example fragment of preprocessed free text merged with tabular attributes. 52 3.3 Example fragment of tabular questionnaire data in CSV format. . . 54
3.4 Example of raw OHSUMED data. . . 57
3.5 Example of partially preprocessed OHSUMED data. . . 59
3.6 Example fragment of raw Reuters-21578 data. . . 64
3.7 Two example preprocessed Reuters-21578 records. . . 65
4.1 Standard Classification Technique for Text Summarisation. . . 73
5.1 Classifier Generation Using Secondary Data (CGUSD) for Text Sum-marisation. . . 109
6.1 The SARSET methodology. . . 135
6.2 Main window of SARSET. . . 136
6.3 Validation window of SARSET. . . 137
6.4 Inspection of documents. . . 138
7.1 Hierarchy of classes. . . 158
7.2 Single-parent hierarchy . . . 158
List of Tables
2.1 Example of a binary confusion matrix . . . 28
3.1 Number of records per class in SAVSNET-840-4-FT. . . 44
3.2 Number of records per class in SAVSNET-971-3-FT. . . 45
3.3 Number of records per class in SAVSNET-917-1L. . . 46
3.4 Number of records per class in SAVSNET-917-2L. . . 46
3.5 Number of records per class in SAVSNET-917-3L. . . 46
3.6 Number of records per class in SAVSNET-917-4L. . . 46
3.7 Example fragment of raw questionnaire data in tabular form. . . 49
3.8 Number of classes per level in the OHSUMED-CA-3187-3H hierarchy. . 55
3.9 Number of classes per level in the OHSUMED-AD-3393-3H hierarchy. . 56
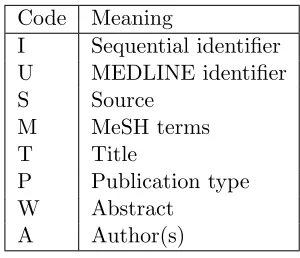
3.10 Field definitions for OHSUMED data set. . . 58
3.11 Number of classes per level in the Reuters-21578-LOC-2327-2H hierarchy. 61 3.12 Number of classes per level in the Reuters-21578-COM-2327-2H hierarchy. 61 3.13 Comparison of data sets and their usage in relation to the proposed methods. . . 66
4.1 Example of rules for generating summaries. . . 70
4.2 Classification results for the SAVSNET-840-4 data set with Chi-squared. 74 4.3 Classification results for the SAVSNET-840-4 data set with CFS. . . 74
4.4 Classification results for the SAVSNET-971-3 data set with Chi-squared. 76 4.5 Classification results for the SAVSNET-971-3 data set with CFS. . . 76
4.6 Classification results for the SAVSNET-917-1L data set with Chi-squared and CFS. . . 78
4.7 Classification results for the SAVSNET-917-2L data set with Chi-squared and CFS. . . 78
4.8 Classification results for the SAVSNET-917-3L data set with Chi-squared and CFS. . . 80
4.9 Classification results for the SAVSNET-917-4L data set with Chi-squared and CFS. . . 80
4.11 Classification results for the OHSUMED-CA-2570-2L data set with
Chi-squared and CFS. . . 82
4.12 Classification results for the OHSUMED-CA-834-3L data set with Chi-squared and CFS. . . 84
4.13 Classification results for the OHSUMED-AD-3393-1L data set with Chi-squared and CFS. . . 84
4.14 Classification results for the OHSUMED-AD-569-2L data set with Chi-squared and CFS. . . 87
4.15 Classification results for the OHSUMED-AD-292-3L data set with Chi-squared and CFS. . . 87
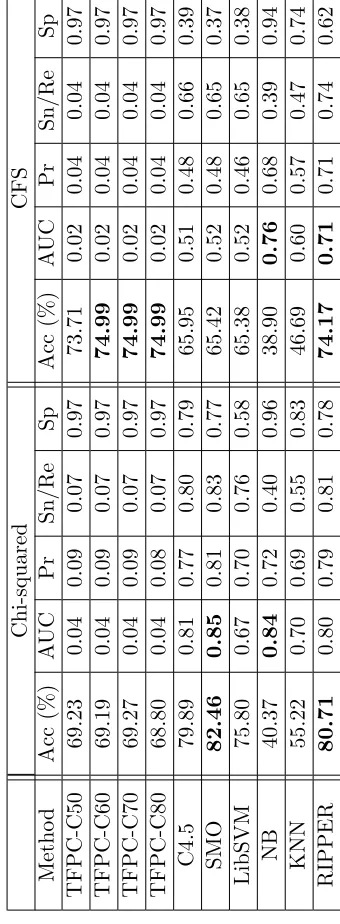
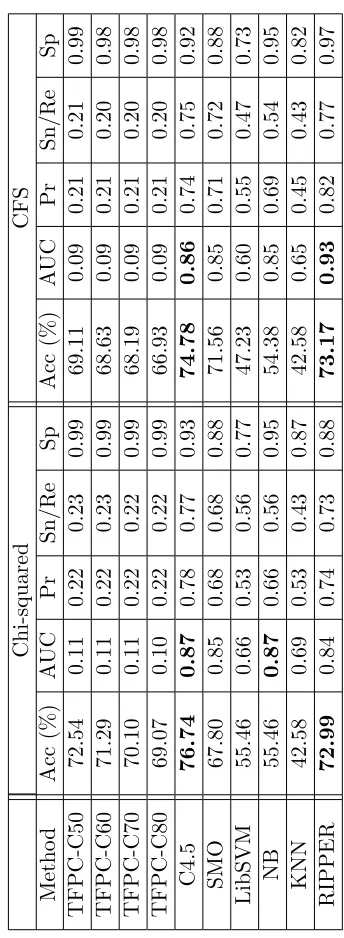
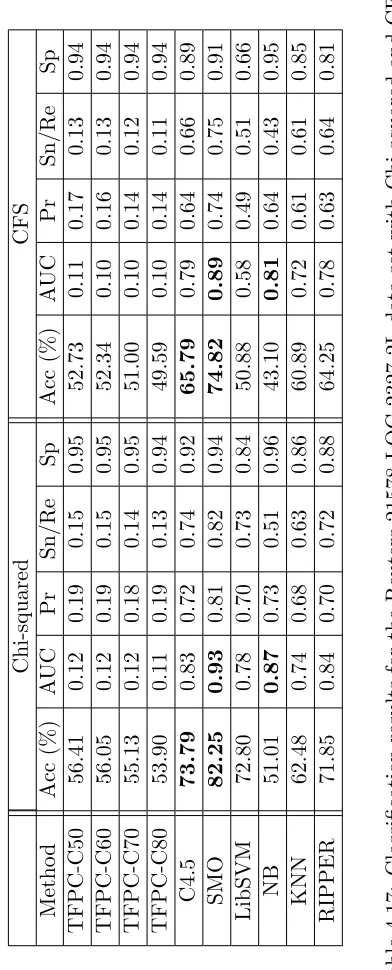
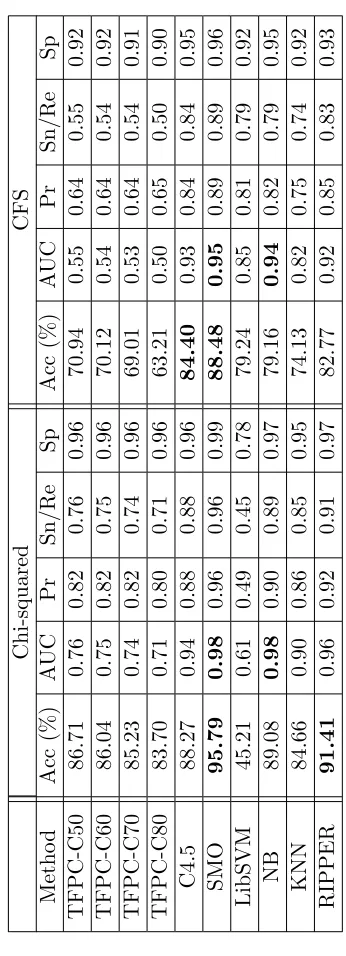
4.16 Classification results for the Reuters-21578-LOC-2327-1L data set with Chi-squared and CFS. . . 89
4.17 Classification results for the Reuters-21578-LOC-2327-2L data set with Chi-squared and CFS. . . 89
4.18 Classification results for the Reuters-21578-COM-2327-1L data set with Chi-squared and CFS. . . 91
4.19 Classification results for the Reuters-21578-COM-2327-2L data set with Chi-squared and CFS. . . 91
4.20 Best classification techniques and results. . . 93
4.21 Examples of summaries generated using standard classification techniques. 96 5.1 Statistical details for primary and secondary data sets used. . . 117
5.2 SAVSNET-840-4-FT primary and secondary data sets (k= 419). . . 117
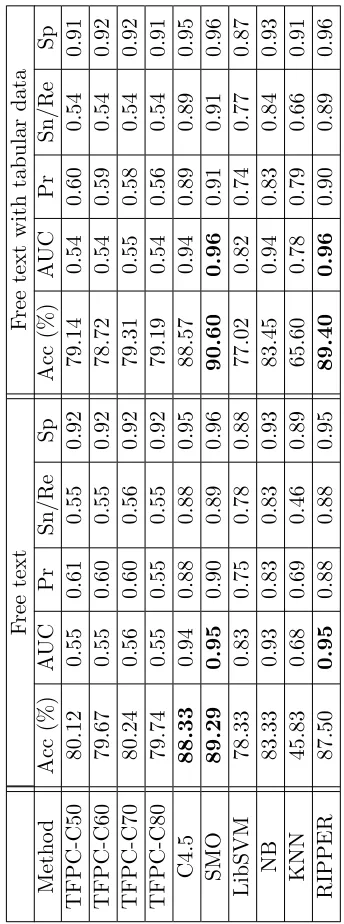
5.3 Classification results for the SAVSNET-840-4-FT data set. . . 118
5.4 SAVSNET-971-3-FT primary and secondary data sets (k= 429). . . 118
5.5 Classification results for the SAVSNET-971-3-FT data set. . . 119
5.6 SAVSNET-917-1L primary and secondary data sets (k = 429). . . 119
5.7 Classification results for the SAVSNET-917-1L data set. . . 120
5.8 OHSUMED-CA-3187-1L primary and secondary data sets (k= 2,339). . 120
5.9 Classification results for the OHSUMED-CA-3187-1L data set. . . 120
5.10 OHSUMED-CA-2570-2L primary and secondary data sets (k= 386). . . 121
5.11 Classification results for the OHSUMED-CA-2570-2L data set. . . 122
5.12 OHSUMED-CA-834-3L primary and secondary data sets (k= 446). . . 122
5.13 Classification results for the OHSUMED-CA-834-3L data set. . . 122
5.14 Classification results for the OHSUMED-AD-3393-1L data set. . . 123
5.15 Classification results for the OHSUMED-AD-569-2L data set. . . 124
5.16 OHSUMED-AD-292-3L primary and secondary data sets (k = 292). . . 124
5.17 Classification results for the OHSUMED-AD-292-3L data set. . . 125
5.20 Classification results for the Reuters-21578-LOC-2327-2L data set. . . . 127
5.21 Reuters-21578-COM-2327-1L primary and secondary data sets (k= 600). 127 5.22 Classification results for the Reuters-21578-COM-2327-1L data set. . . . 128
5.23 Best classification techniques and results. . . 129
6.1 Classification results for the SAVSNET-840-4-FT data set. . . 142
6.2 Classification results for the SAVSNET-971-3-FT data set. . . 142
6.3 Classification results for the SAVSNET-917-1L data set. . . 143
6.4 Classification results for the SAVSNET-917-2L data set. . . 143
6.5 Classification results for the SAVSNET-917-3L data set. . . 143
6.6 Classification results for the SAVSNET-917-4L data set. . . 144
6.7 Classification results for the OHSUMED-CA-3187-1L data set. . . 144
6.8 Classification results for the OHSUMED-CA-2570-2L data set. . . 145
6.9 Classification results for the OHSUMED-CA-834-3L data set. . . 145
6.10 Classification results for the OHSUMED-AD-3393-1L data set. . . 146
6.11 Classification results for the OHSUMED-AD-569-2L data set. . . 146
6.12 Classification results for the OHSUMED-AD-292-3L data set. . . 147
6.13 Classification results for the Reuters-21578-LOC-2327-1L data set. . . . 147
6.14 Classification results for the Reuters-21578-LOC-2327-2L data set. . . . 148
6.15 Classification results for the Reuters-21578-COM-2327-1L data set. . . . 148
6.16 Classification results for the Reuters-21578-COM-2327-2L data set. . . . 149
6.17 Best classification results. . . 150
7.1 Classification results for SAVSNET-917-4H using SMO. . . 166
7.2 Classification results for OHSUMED-CA-3187-3H using SMO. . . 166
7.3 Averaged accuracy and AUC results for SAVSNET-917-4H using SMO, C4.5 and RIPPER. . . 168
7.4 Averaged accuracy and AUC results for OHSUMED-CA-3187-3H using SMO, C4.5 and RIPPER. . . 168
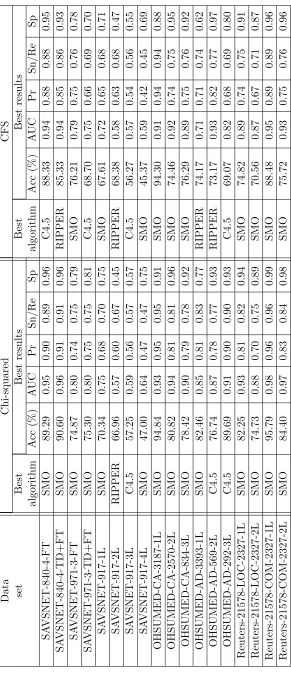
7.5 Averaged accuracy and AUC results for Reuters-21578-LOC-2327-2H us-ing SMO, C4.5 and RIPPER. . . 168
7.6 Averaged accuracy and AUC results for Reuters-21578-COM-2327-2H using SMO, C4.5 and RIPPER. . . 168
7.7 Best classification techniques and results. . . 173
7.8 Overall classification results for the proposed approaches. . . 177
A.1 Number of records per class in 4 and in SAVSNET-840-4-TD+FT (k= 352). . . 201
A.3 Number of records per class in SAVSNET-917-1L (k = 536). . . 202
A.4 Number of records per class in SAVSNET-917-2L (k = 604). . . 202
A.5 Number of records per class in SAVSNET-917-3L (k = 573). . . 202
A.6 Number of records per class in SAVSNET-917-4L (k = 411). . . 202
A.7 Number of records per class in OHSUMED-CA-3187-1L (k= 2,339). . . 203
A.8 Number of records per class in OHSUMED-CA-2570-2L (k= 525). . . . 203
A.9 Number of records per class in OHSUMED-CA-834-3L (k= 299). . . . 203
A.10 Number of records per class in OHSUMED-AD-3393-1L (k= 2,112). . . 204
A.11 Number of records per class in OHSUMED-AD-569-2L (k = 194). . . . 205
A.12 Number of records per class in OHSUMED-AD-292-3L (k = 133). . . . 205
A.13 Number of records per class in Reuters-21578-LOC-2327-1L (k= 1,021). 206 A.14 Number of records per class in Reuters-21578-COM-2327-1L (k= 966). 206 A.15 Number of records per class in Reuters-21578-LOC-2327-2L (k= 743). . 207
A.16 Number of records per class in Reuters-21578-COM-2327-2L (k= 508). 209 B.1 Classification results for SAVSNET-917-4H using SMO. . . 212
B.2 Classification results for SAVSNET-917-4H using C4.5. . . 212
B.3 Classification results for SAVSNET-917-4H using RIPPER. . . 213
B.4 Classification results for OHSUMED-CA-3187-3H using SMO. . . 213
B.5 Classification results for OHSUMED-CA-3187-3H using C4.5. . . 214
B.6 Classification results for OHSUMED-CA-3187-3H using RIPPER. . . 214
B.7 Classification results for OHSUMED-AD-3393-3H using SMO. . . 215
B.8 Classification results for OHSUMED-AD-3393-3H using C4.5. . . 215
B.9 Classification results for OHSUMED-AD-3393-3H using RIPPER. . . . 216
B.10 Classification results for Reuters-21578-LOC-2327-2H using SMO. . . . 217
B.11 Classification results for Reuters-21578-LOC-2327-2H using C4.5. . . 218
B.12 Classification results for Reuters-21578-LOC-2327-2H using RIPPER. . 219
B.13 Classification results for Reuters-21578-COM-2327-2H using SMO. . . . 220
B.14 Classification results for Reuters-21578-COM-2327-2H using C4.5. . . . 220
Chapter 1
Introduction
1.1
Overview
In the last decades there has been a dramatic increase in the number of computer users, mainly because of the popularization of the Internet and the feasibility of automating office processes using dedicated software. This has led to a constant growth in the amount of computer readable text produced, stored and handled; despite the fact that text information is still widely used in printed paper format. Almost all the printed text information that has been produced over the last twenty years, across the world, has been created using “word processing” software of some form. The motivation for wanting text to be summarised vary according to the field of study and the application of interest; however, it is very clear that, in all cases, what is being pursued is the idea of presenting the text content in a coherent but reduced form.
The focus of the work described in this thesis is the summarisation of the free text found in questionnaires using text classification methods. In the context of this thesis the term “free text” refers to “free form” text that is not restricted by (for example) some database schema; thus the text commonly found in literature, newspaper articles and so on. Questionnaires are a useful and common research tool, used in many fields of study, for collecting information from groups of respondents. Questionnaires contain a series of questions that can either be closed-ended or open-ended [72]. In the case of closed-ended questions the respondents choose an answer from a given set of options; the answers are then stored in a tabular format. On the other hand, in the case of open-ended questions the respondents formulate their own answers in their own words by writing text, therefore the answers are stored in a free text format. Although the classic way in which questionnaires are presented to respondents is in written form, nowadays the use of electronic based questionnaires is also common because of the automated processing advantages offered (no need to first transcribe or scan answers into an electronic format).
The construction of the questionnaire will take into account the nature of the relevant data that needs to be garnered from the respondents; because, as Gillham [35] states:
“good research cannot be built on poorly collected data”. The analysis of the information gathered using questionnaires has usually been done using statistical techniques. The extraction of “deeper” information and patterns from questionnaire data (both tabular and free text), beyond straightforward statistical analysis, can be achieved using data mining. The term data mining refers to the extraction or discovery of knowledge from large amounts of data [41]. Knowledge in this context means useful or strategic information that was unexpected or not clearly seen at first.
This thesis is focused on the analysis of the free text element frequently included in questionnaires; because, while extracting meaning from the tabular part of ques-tionnaires is relatively straightforward, extracting meaning from the free text part still presents a challenge especially when we consider that, in most cases, the texts are short, unstructured and contain misspelled words, poor grammar, and abbreviations and acronyms related to a specific domain. Unstructured text refers to text that is not organised in a predefined structure. There are a number of alternative ways in which the extraction of useful information from text can be conducted. For example, using Natural Language Processing (NLP) [65] or Information Retrieval (IR) [6] techniques. However, given the inherent characteristics of questionnaire free text data, as men-tioned above, these approaches are unlikely to produce an appropriate result, because as Mitchell et al. [75] noted: “With unmoderated mark schemes, the system gener-ates a number of marking errors when faced with unexpected but allowable responses, synonyms and phraseology”. Additionally, Soderland [96] stated: “Unfortunately, stan-dard natural language processing (NLP) extraction techniques expect full, grammatical sentences, and perform poorly on the choppy sentences fragments that are often found on web pages”. The approach proposed in this thesis is founded on the concept of text classification.
extracted knowledge.
With respect to the work described in this thesis text summarisation is conceived of as a form of text classification in that the classes assigned to text documents can be viewed as an indication (summarisation) of the main ideas of the original free text but in a coherent and reduced form. Coherent because the class names that are typically used to label text documents tend to represent a synthesis of the topic with which the document is concerned. Reduced because the use of class labels leads to a succinct articulation of the content of the original text. It is acknowledged that a summary of this form is not as complete or as extensive as what some observers might consider to be a summary; but, if we assign multiple class labels to each document (questionnaire free text) then this comes nearer to what might be traditionally viewed as a summary. It is important to note that although they are intended for different forms of appli-cation, text summarisation (as envisioned in this thesis) and text classification share a common purpose, namely to derive meaning from free text (either by producing a summary or by assigning labels). Thus this thesis presents a study of the use of text classification methods for text summarisation with respect to the unstructured free text part of questionnaire data. Four classification summarisation techniques are investi-gated: (i) using standard classification techniques, (ii) using secondary data to generate classifiers to be applied to primary data, (iii) using a semi-automated rule summari-sation extraction tool that requires user interaction, and (iv) using a hierarchical text classification approach to generate the desired summaries. These techniques will be extensively described and analysed in their respective chapters later in this thesis.
The remainder of this introductory chapter is organised as follows. Section 1.2 presents the motivations for the work presented in this thesis. The research question and the related issues are described in Section 1.3. Section 1.4 presents a formal defi-nition of the problem addressed by the research presented in this thesis. The research methodology that was followed is presented in Section 1.5. The contributions of the work, with respect to data mining and related areas of research, are presented in Section 1.6. Section 1.7 gives a general overview of the organisation of this thesis. A number of publications by the author are listed in Section 1.8. Finally, a summary of the chapter is presented in Section 1.9.
1.2
Motivation
The main motivation for the research presented in this thesis, as already noted, is the desire to extract meaning from the free text element frequently found in questionnaire data. A number of related motivations are identified:
on-line questionnaire data, much of it in free text format. To keep up with the increasing amount of questionnaire data there is a corresponding desire to auto-mate the analysis of this data. The autoauto-mated analysis of the free text element of questionnaire data remains a challenge.
2. Fast Analysis: The desire of public and private institutions to speed up the process of gathering and analysing information (e.g. opinion about politicians, customer satisfaction with a certain product, medical condition prevalence, etc.) to improve decision making requires automated processes, so as those proposed in this thesis.
3. Resource Reduction: Reducing resources required for the analysis of the free text element in questionnaires, for example through the use of domain experts, is clearly desirable.
4. Enhance Analysis: The potential for the application of much more sophis-ticated analysis techniques (such as opinion and sentiment mining, and brand reputation mining), directed at specific aspects found in questionnaire free text, will require some form of preliminary processing of this text (such as text sum-marisation).
5. Integrated Analysis: Related to (4), the potential for integrating information extracted from the free text part of questionnaires with the tabular element of questionnaires, or additional datasets, would further facilitate enhanced analysis.
6. No Previous Investigation: To the best knowledge of the author, the gener-ation of text summaries using text classificgener-ation techniques has not been widely investigated in the literature, and thus appropriate investigation is warranted.
7. Diversity of Application: The observation that text summarisation, as envi-sioned in this thesis, has potential benefits in the context of a variety of application domains such as medicine, marketing, national security and finance, among oth-ers. The main benefits would be: (i) to provide a greater insight to data that will help in decision making and (ii) to help to fulfil the objectives with respect to the application domain. In some cases unexpected trends could be discovered.
is of particular importance in lessening the so called “information load” [25] of the information age; thus, for example, speeding up the process of decision making.
1.3
Research question and issues
Given the above, the research question to which this thesis is directed is: “can relevant information be extracted, in the form of a summary, from the free text element often
found in questionnaires using text classification techniques; while at the same time
taking into account that such text is usually sparse, unstructured and contains misspelled
words, poor grammar, and abbreviations and acronyms related to a specific domain?”. There are five related research issues associated with the provision of an answer to this research question:
1. Inherent characteristics of the free text part of questionnaires: As al-ready noted above, the free text part of questionnaires typically features: a lack of structure, misspelled words, poor grammar, use of abbreviations and acronyms, and use of negation. The first issue to be addressed was thus how best to overcome this limitation.
2. Robust classification techniques: With respect to the research presented in this thesis, robustness refers to the case when the generation of comprehensive summaries using text classification techniques will require recourse to a consider-able number of classes (unlike more traditional text classification applications). Thus a large number of classes is to be expected, and therefore any proposed solution to the above research question must be able to satisfactorily deal with this.
3. Mechanism for generating the desired summaries from class labels: The generation of summaries from class labels assigned to the free text part of questionnaires will require an effective mechanism whereby class labels can be used for this purpose.
4. Unbalanced data: In the context of the anticipated mechanisms for generating text summaries it is expected that in some cases a significant number of examples per class may not be available, in other cases there will be a large number of records with respect to some classes (classes that represent common occurrences). Therefore, the input data can be expected to be unbalanced. Any proposed classification technique for text summary generation must therefore be able to deal with unbalanced data.
necessary to identify questionnaire summarisation techniques that can operate with small numbers of records (examples).
Overall the work described in this thesis can be said to be directed at two principal objectives as follows:
1. The extraction of relevant information from the free text element of question-naires.
2. The realization of mechanisms to achieve text summarisation using text classifi-cation methods.
1.4
Problem definition
In general the techniques presented in this thesis are directed at the summarisation of free text from questionnaire returns, although its applicability can be extended to other types of free text. In the context of Questionnaire Data Mining the input is a collection ofnquestionnaires,Q={q1, q2, . . . , qn}, where each questionnaire comprises
a tabular component and a free text component, qi = {T ablei, T exti} (where i is a
numeric questionnaire identifier). The tabular component, in turn, comprises a subset of a global set of m attribute-value pairsA ={a1, a2, . . . , am}; thus T ablei ⊂A. The
objective is then to summarise the free text element of the questionnaires in terms of a sequence ofplabels (classes),{c1, c2, . . . , cp}, using a set ofkrules,R={r1, r2, . . . , rk},
to prepend or append domain-specific text to the class labels.
1.5
Research Methodology
fourth technique investigated was founded on the concept of hierarchical text classifi-cation. The idea being that a hierarchical approach would be a good way of addressing the large number of classes issue.
So that the proposed techniques could be evaluated a number of data sets were used:
• SAVSNET (Small Animal Veterinary Surveillance Network)
- SAVSNET-840-4-FT
- SAVSNET-840-4-TD+FT
- SAVSNET-971-3-FT
- SAVSNET-971-3-TD+FT
- SAVSNET-917-4H
• OHSUMED
- OHSUMED-CA-3187-3H (Cardiovascular Abnormalities)
- OHSUMED-AD-3393-3H (Animal Diseases)
• Reuters-21578
- Reuters-21578-LOC-2327-2H (Locations)
- Reuters-21578-COM-2327-2H (Commodities)
(Details of these data sets will be presented later in this thesis.) In all cases the free text was typically preprocessed as follows: (i) convert to lower case; (ii) remove numbers, symbols and stop words (common words that are not significant for the text classification/summarisation process), (iii) apply stemming (using an implementation of the Porter Stemming algorithm [106]) and (iv) feature selection. The evaluation metrics used were overall Accuracy, Area Under the receiver operating Curve (AUC), Precision, Sensitivity/Recall and Specificity.
1.6
Contributions
The main contribution of the research work presented in this thesis is the use of text classification methods for text summarisation. As noted earlier, there is little reported work on extracting meaning, in the form of summaries, from free text by using text classification methods. More specifically the work described makes the following con-tributions:
2. A demonstration of the benefits of the usage of classification for summarisation that addresses the issues associated with the nature of the free text element of questionnaire data, which tends to be unstructured and includes misspellings, abbreviations and domain specific terminology.
3. An investigation into the use of secondary data to support free text classification and specifically questionnaire free text summarisation.
4. An investigation into the incorporation of domain experts into the text classifi-cation summarisation process.
5. A hierarchical classification mechanism to provide text summarisation with re-spect to questionnaire data.
6. Implementations of a number of approaches to generating summaries from the free text element of questionnaire data, namely: (i) standard classification techniques, (ii) use of secondary data, (iii) semi-automated summary generation (requires end user involvement) and (iv) hierarchical classification for text summarisation.
7. An investigation into the SAVSNET [83] questionnaire data collections.
8. Supporting investigations using the OHSUMED and Reuters data collections.
1.7
Organisation of the thesis
1.8
Publications
A number of papers and technical reports were produced as part of the research de-scribed in this thesis:
1. M. F. Garcia-Constantino. Technical report of the text summarisa-tion of the free text secsummarisa-tion of quessummarisa-tionnaires related to Veterinary practice. Department of Computer Science, University of Liverpool. Technical report, 2010. In this technical report a number of text summarisa-tion approaches were reviewed taking into account their possible applicasummarisa-tion in summarising the free text of questionnaires related to a specific domain area, in this case Veterinary Science. At the end of the report the most likely effective text summarisation techniques, to be used in this context, are presented. A significant portion of the material in this report is utilised in Chapter 2 of this thesis.
2. M. F. Garcia-Constantino, F. Coenen, P. Noble, A. Radford, C. Set-zkorn, and A. Tierney. An Investigation Concerning the Generation of Text Summarisation Classifiers using Secondary Data. Proceedings. Machine Learning and Data Mining in Pattern Recognition, Lecture Notes in Computer Science 6871 Springer 2011, pp387-398. This paper addressed the issue where it was desired to summarise the free text element of questionnaires, but no suitable training data was available. Text summarisation classifiers are generated using secondary data and then applied to the primary data for the purpose of text summarisation. The primary data source was real questionnaire data. The secondary data was extracted from an online biblio-graphic database of biomedical information. Material presented in this paper has been incorporated in Chapter 5 of this thesis.
work chapter of this thesis (Chapter 2).
4. M. F. Garcia-Constantino and F. Coenen. A Survey on Question-naire Data Mining. Department of Computer Science, University of Liverpool. Technical report, 2011. This technical report gives a general background, literature review and a categorisation of questionnaire data mining techniques. It also discussed the relevant data mining techniques based on the part of the questionnaire to be mined (tabular, free text or both). A significant portion of the material in this report is utilised in Chapter 2 of this thesis.
5. M. F. Garcia-Constantino, F. Coenen, P. Noble, A. Radford, and C. Setzkorn. A Semi-Automated Approach to Building Text Summarisa-tion Classifiers. Proceedings. Machine Learning and Data Mining in Pattern Recognition. Lecture Notes in Computer Science. Springer 2012. In this paper a semi-automated summarisation extraction technique to generate text summarisation classifiers was presented. A realisation of this tech-nique, SARSET (Semi-Automated Rule Summarisation Extraction Tool), was also presented and evaluated using real questionnaire data. The motivation for the work was the observation that the generation of rule-based classifiers from the SAVSNET data might benefit from the intervention of domain experts. Material presented in this paper has been incorporated in Chapter 6 of this thesis.
6. M. F. Garcia-Constantino, F. Coenen, P. Noble, A. Radford, and C. Setzkorn. A Semi-Automated Approach to Building Text Summarisa-tion Classifiers. Journal of Theoretical and Applied Computer Science. Vol. 6, No. 4, pp. 7-23, 2012. This paper is a continuation and extension of the previous paper about the SARSET technique (paper number 5 in this list). Additional data sets and classification methods were used for the purpose of eval-uation and comparison with respect to SARSET. Material presented in this paper has been incorporated in Chapter 6 of this thesis.
8. M. F. Garcia-Constantino, F. Coenen, P. Noble and A. Radford. Free Text Summarisation of Structured and Unstructured Free Text Us-ing Hierarchical Classification. In preparation. This unpublished paper presents an investigation into the summarisation of structured and unstructured free text using hierarchical text classification. This paper extends the technique presented in the previous paper concerning the hierarchical classification tech-nique used for text summarisation. Apart from SMO, three other classification techniques are also considered, namely: (i) C4.5, (ii) Naive Bayes and (iii) RIP-PER. Material presented in this paper has been incorporated in Chapter 7 of this thesis.
1.9
Summary
Chapter 2
Literature Review
2.1
Introduction
This chapter presents a review of the relevant background knowledge with respect to the research addressed in this thesis. Section 2.2 presents the concept of Data Mining and the KDD (Knowledge Discovery in Databases) process in order to give an overview of the foundations of the research and of the state of the art with respect to techniques typically used to extract useful information from data. Section 2.3 describes the ex-traction of useful information from questionnaires using data mining techniques, places the Questionnaire Data Mining research domain within the data mining landscape and introduces the idea of mining tabular and textual information from questionnaires. In Section 2.4 feature selection techniques for text classification are reviewed as well as the most relevant approaches and evaluation measures. Section 2.5 describes existing work on text summarisation and the evaluation measures used, and it also provides a review of a number of text summarisation approaches that use text classification methods but in a different manner to that described in this thesis. Finally, a summary of the chapter is presented in Section 2.6.
2.2
Data Mining and the Knowledge Discovery in Databases
(KDD) process
Data mining refers to the extraction or discovery of knowledge from large amounts of data [41]. Knowledge in this context means useful or strategic information, that was unexpected or not clearly observable in the first instance, which can be used for decision making. KDD is defined by Fayyad et al. [27] as the “non-trivial process of identifying valid, novel, potentially useful, and ultimately understandable patterns in
(vii) knowledge presentation. It is beyond the scope of this thesis to describe each step of the KDD process, thus, the rest of this section concentrates on the data mining step within the overall KDD process only.
Goals of Data M ining
V erif ication
Discovery
P rediction
Description
Figure 2.1: Goals of Data Mining
The goals of data mining, according to Fayyad et al. [27], are shown in Figure 2.1. In the case of verification, a certain hypothesis is required to be validated by the system; whereas, discovery is directed at the identification of patterns. Discovery is divided into prediction and description; while in the former the patterns discovered by the system are used to predict future outputs, in the latter they are used to provide human understandable descriptions. The data mining goals pursued by the research described in this thesis can be said to be directed at both prediction and description.
Despite the fact that many researchers [27, 41, 85] identify different data mining areas of concern (classification, regression, clustering, association, summarisation, de-pendency modelling), three of these can be identified as the most dominant:
• Classification: The supervised process of finding a model (classifier) based on labeled or pre-classified “training data” in order to be able to predict the classes to which unlabelled data belongs [41].
• Association: The unsupervised process of finding frequently occurring itemsets in data so as to produce what are called “association rules” of the formA⇒ B, where A and B are non-overlapping itemsets. To measure how interesting or relevant a rule is, support and confidence measures are typically used [41].
• Clustering: The unsupervised process whereby data is grouped into clusters based on the similarities between the items that comprise the data. The similar-ities are typically defined according to some distance function (such as Euclidean distance) [41].
As stated in Chapter 1, the approaches presented in this thesis utilise text classification methods for the purpose of text summarisation. Therefore, the data mining technique which is of greatest significance with respect to this thesis is classification.
as a part of another domain because it is addressing a specific issue (for example, opinion mining can be argued to be akin to text mining); furthermore, a domain can be the result of combining two domains (for example, spatio-temporal data mining is derived from spatial data mining and temporal data mining). The most significant data mining domains within the overall context of data mining can be considered to be: spatial, text, temporal, spatio-temporal, audio, video, multimedia (audio and video), opinion, data stream, graph and web mining. The data mining domain of interest with respect to the research described in this thesis is text mining.
According to Hanet al. [41], text mining is concerned with the discovery of “ knowl-edge from semistructured text data using methods such as keyword-based association
analysis, document classification, and document clustering”. Similar to this descrip-tion are the definidescrip-tions of Roiger and Geatz [85], and Hotho et al. [52], which can be summarised as defining text mining as “the extraction of useful patterns from free text by using algorithms and methods from the machine learning and statistics fields”. Related areas that have contributed to the improvement of text mining approaches are: Natural Language Processing (NLP), Information Retrieval (IR) and Information Extraction (IE).
Natural Language Processing (NLP) is defined by Joshi [65] as: “the study of mathe-matical and computational modelling of various aspects of language and the development
of a wide range of systems”. Hotho et al. [52] define Information Retrieval (IR) as: “the finding of documents which contain answers to questions and not the finding of answers itself”. Hotho et al. [52] also state that the goal of Information Extraction (IE) is: “extraction of specific information from text documents”.
Text mining is a broad area of research filled with different approaches and tech-niques to address the challenges imposed by particular problems. In the context of the research described in this thesis, the classification and summarisation of the textual element of questionnaires are of interest. Thus the research presented in this thesis can also be considered to fall within the areas ofQuestionnaire Analysis andQuestionnaire Data Mining when applied to questionnaires that contain free text (questionnaires can of course be comprised entirely of closed-ended questions). In Section 2.3 the rela-tionship between Questionnaire Data Mining and Text Mining is considered in more detail. Text classification and text summarisation are considered in Sections 2.4 and 2.5 respectively.
2.3
Questionnaire Data Mining (QDM)
from a target group of respondents. The analysis of responses is typically conducted in order to aid and improve some decision making process.
Many different data types can be identified within both the tabular and the free text element of questionnaires. Chen and Weng [14] note that questionnaire tabu-lar data typically includes more data types than those that are usually encountered in data mining (nominal/boolean, ordinal, quantitative). Based on Marshall’s [72] categorisation of possible types of tabular data that can result from a questionnaire, Chen and Weng [14] defined seven possible types of tabular data: (i) nominal (cate-gories), (ii) multiple-choice (lists), (iii) quantitative (numbers), (iv) ordinal (ranks), (v) fuzzy ordinal (linguistic ranks), (vi) multiple-choice ordinal (multiple-ranks) and (vii) multiple-choice fuzzy ordinal (multiple-linguistic ranks). On the other hand, while it is clear that the free text part of a questionnaire contains text, in many cases there are numerical or other types of data mixed within the text that might, during the pre-processing, either be considered to be noise and thus removed or considered relevant and be identified ready for further analysis. The pre-processing of the tabular and free text part of questionnaires is extensively covered in Chapter 3.
An interesting trend in questionnaire data mining research is that most of the proposed techniques have been developed in Japan. A possible reason is the popularity of the Kansei Engineering method [78] in Japan. This method aims at the design and production of products based on the feelings and impressions of consumers. The favoured mechanisms for gathering consumer feedback is through questionnaires and surveys, either written or electronically-based, to which statistical and, more recently, data mining techniques have been applied to extract useful information.
While the extraction of useful information from the tabular part of questionnaires is straightforward (for example using well established data mining techniques), extracting useful information from the free text part is more challenging because, as already noted, this kind of text is usually sparse, unstructured and typically contains misspelled words, poor grammar, and abbreviations and acronyms related to a specific domain.
2.3.1 Overview of QDM approaches
57, 77, 79, 88, 87, 101, 102, 109], the review presented here only considers research that has been published at English language venues. The covered approaches are explained and discussed in more detail in the following sections. The approaches proposed by the author that appear in Figure 2.2 are extensively discussed in Chapters 5, 6 and 7.
Figure 2.2: Questionnaire Data Mining relevant approaches.
2.3.2 QDM approaches directed at closed-ended questions (tabular data)
2.3.3 QDM approaches directed at open-ended questions (free text) Mining the answers to open-ended questions (free text) can be done by applying estab-lished text analysis approaches, for example, we can attempt to use Natural Language Processing (NLP) [65] or Information Retrieval (IR) [6] techniques. However, given the unstructured nature of questionnaire free text data these approaches are difficult to ap-ply, and thus unlikely to produce an effective result. There are a number of approaches focused specifically on mining the free text part of questionnaires. It should be noted that, with respect to the analysis of the questionnaires designed to support the Kansei Engineering method in Japan, the free text is in Japanese, a language whose word representation and text structure is very different from that of English, thus requiring a very different form of analysis.
can learn the criterion from text that has previously been tagged as indicating an in-tention. Reproducibility refers to the consistency of the judgement evaluation carried out by human subjects. Effectiveness refers to the ability of achieving the same results without using the criterion. The machine learning methods used were the Maximum Entropy Method (MEM) and Support Vector Machines (SVMs).
Hiramatsu et al. [45] presented a system to support the analysis of open-ended questions by extracting only atypical or unexpected opinions present in the answers. The system classified opinions as typical oratypical. Hiramatsuet al. emphasized the significance of open-ended questions by noting that they reflect directly the opinions of the respondents (unlike closed-ended questions). Typical opinions were defined in terms of: (i) the similarity of the answers in closed-ended and in open-ended questions, (ii) the existence of such opinions in an “opinion base” holding all the opinions given in previous applications of the questionnaire and (iii) the relevance of opinions regarding the domain of the questionnaires. Atypical opinions were simply defined as being opinions not considered as typical. Three methods to extract atypical opinions were presented: (i) according to the ratio of typical word combinations in the sentences making up an answer (the basic method), (ii) based on the keyword distance obtained after identifying keywords in the opinions and comparing them with words contained in a “typical word” database and (iii) based on the use of delimiters to split sentences containing opinions into phrases. From the results of the experiments carried out to compare the three methods, Hiramatsu et al. found that the third method provided the most effective result.
The approach proposed by Uchidaet al. [104], based on co-occurrence analysis, is a semi-automated system for extracting the keywords from the free text element of ques-tionnaires and visualising the relationship among sentences. A text mining technique called the Hierarchical Keyword Graph (HK Graph) technique was used to extract the keywords and to represent them in a hierarchical structure. In the HK Graph tech-nique the free text was first divided into words, keywords were then identified by human users. Next the co-occurrence between the selected keywords and other words in the text was calculated; words with the highest co-occurrence values were extracted and represented as a hierarchical graph structure. A set of statistical techniques, known as Multi Dimensional Scaling (MDS), was used to interactively cluster the respondents (people who answered the questionnaires) in a visual space according to the similarity between the extracted keywords, in order to visualise the relationship among the ex-tracted keywords from each cluster, and therefore the tendencies of the opinions given by the respondents.
included in the Wordstat software1. The questionnaires were pre-processed by organis-ing the text and by correctorganis-ing misspelled words. The free text interpretation included the manual identification of categories and subcategories relevant to the domain to in-crease the resolution of the analysis. A “keywords” list and an “excluded words” list were created to identify words relevant to the domain as opposed to significant words defined in terms of their linguistic value. A co-occurrence text mining algorithm was then applied automatically.
2.3.4 QDM approaches directed at both closed-ended and open-ended questions (tabular data and free text)
Four approaches addressing questionnaire mining by combining tabular data and free text can be identified from within the literature [46, 47, 86, 100]. In [47], Hirasawa and Chu presented an automated method based on Probabilistic Latent Semantic Indexing (PLSI) [51] to extract useful information from documents with both fixed (tabular) and free (free text) formats, such as questionnaires, by representing both the tabular data and the free text as matrices, merging them, weighting their contents and clustering them according to similarity measures. The clusters were then analysed using statistical techniques and knowledge was extracted from them. PLSI is based on the Latent Semantic Indexing (LSI) model in which each document and query vector are mapped in order to reduce the dimension of the vector space by using Single Value Decomposition (SVD). Hirasawa and Chu noted that the performance of their method was dependent on the structure of the documents subject to the analysis.
In [46] Hirasawa presented two algorithms: one for processing both tabular data and free text, and another for extracting important sentences from questionnaire data. The algorithms were combined with statistical techniques, thus forming an automated method for extracting useful information from questionnaires. In a similar way as in [47], PLSI was used not only to cluster the questionnaires, but also to classify them if desired. Important sentences were extracted from the free text using one of the proposed algorithms, and statistical techniques such as multiple linear regression were applied to the tabular data. The outputs of the clustering and classification processes were combined separately with the outputs of the extracted sentences from the free text and with the outputs of the statistical techniques applied to the tabular data to extract useful information.
In the approach presented by Sv´atek [100], the objective was to use both the tabular data and the free text part of questionnaires to build a domain ontology to discover as-sociation rules in questionnaire tabular data. An ontology is a set of concepts and their relationships within a domain. Sv´atek stated that the text found in both the tabular and free text part of questionnaires can be used as ontology components (e.g. classes,
1
relations and instances). In this context, the ontologies were used as a mechanism for both: (i) semi-automatically focusing the mining process and (ii) for assisting in the interpretation of the discovered knowledge. Two case studies were presented where the ontology design process was conducted manually, it is suggested that a tool based on POS (Part-Of-Speech) tagging might be implemented to support the technique.
The fourth identified dual questionnaire mining approach was that of Rosell and Velupillai [86], who proposed a semi-automated system aimed at the generation of hy-pothesis from questionnaire data by applying text clustering to the free text element and classification to the tabular element. While the text clustering process was semi-automated, the evaluation of the clusters generated against the classified tabular data was automated. The method comprised four steps: (i) clustering the free text, (ii) identifying interesting clusters, (iii) exploring the content of the clusters and (iv) for-mulating hypotheses. The free text was represented as a text-by-word matrix using the vector space model. An algorithm, the Relative Clustering Algorithm, was used to construct a cluster of the words related to a text cluster in order to be used as a description of the cluster. Tabular data was used as a way of categorising the clusters generated for the free text.
2.4
Text Classification
Text classification can also be referred to as text categorisation; however, in this thesis the term text classification is used throughout. According to Fragoudis et al. [28], text classification is “the task of assigning one or more predefined categories to natural language text documents, based on their contents”. The survey presented by Sebastiani [90] indicated that using machine learning techniques for automated text classification has more advantages than the approaches that rely on domain experts to manually define a classifier. In this survey the problems that are discussed are: document repre-sentation, classifier construction and classifier evaluation. Similar to the classification applied within the context of the mining of tabular data, the approaches in text clas-sification can be divided according to whether the texts have a single label or multiple labels associated with them as shown in Figure 2.3.
T ext Classif ication
Single−labelled
Binary classif ication
M ulti−class classif ication
M ulti−labelled
In single-labelled text classification a document can only be related to one specific label. In binary text classification each document is assigned to either a specific pre-defined category (single label) or to the complement of that category [90]. As noted by Wang [105], this type of text classification can be considered as a two-class (positive or negative) approach. On the other hand, multi-class classification refers to the situation where each document is assigned a category from a set ofnclasses (wheren >2). Multi-labelled text classification refers to the case in which a document can be associated with more than one label. In the subsections below the following topics related to text classification are considered: feature selection, algorithms, evaluation measures and approaches.
2.4.1 Feature Selection in Text Classification
Feature selection refers to the process of selecting relevant features from text where typically each term (word/phrase) in the text represents a feature. The aims are to improve both the effectiveness of the classification and the efficiency in computational terms (by reducing the dimensionality) [84]. Mineret al. [74] categorised text mining feature selection approaches according to whether they were based on:
1. Information theory: Addressing the best way to process signals and compress and communicate data.
2. Statistics: Determining the statistical correlation between the terms and the class labels of the documents.
3. Frequency: Determining the importance of the terms based on their frequency and on the document frequency.
In relation to the Information Theory and the Statistics methods, Frequency meth-ods are less computationally expensive. The most relevant approaches with respect to these categories and the work described in this thesis are described in the following subsections, namely: (i)Information Gain (IG), (ii)Chi-squared (χ2), (iii) Correlation-based Feature Selection (CFS) and (iv) Term Frequency-Inverse Document Frequency (TF-IDF). A justification of which feature selection methods were used for the work described in this thesis, and how they were used, is presented at the end of this section.
2.4.1.1 Information Gain (IG)
that entropy is a measure of uncertainty with respect to a training set (or the amount of information required to assign a class label to an instance), IG is an indicator of how much information is gained from an initial to a new entropy of a feature. It is calculated as follows:
Gain(A) =Inf o(D)−Inf oA(D) (2.1)
where D is a data partition which comprises instances in a node N, which represents tuples of partitionD. The information required to assign a class label to an instance inD, in other words the entropy ofD, is given by:
Inf o(D) =−
m
X
i=1
pilog2(pi) (2.2)
where a class label can havemdifferent values andpiis the probability that an instance
belonging to D is related to a certain class. The information required to produce a correct classification is given by:
Inf oA(D) = v
X
j=1
|Dj|
|D| ×Inf o(Dj) (2.3)
|Dj|
|D| represents the weight of the jth partition. A feature with high IG has a better occurrence prediction of the target variable. Typically, features are ranked according to their IG and the features with higher values (which have a better prediction capability with respect to the class labels) are chosen.
2.4.1.2 Chi-squared (χ2) statistic
The Chi-squared (χ2) statistic measures the lack of independence between a feature and a class to which a document is related [111]. The more independent, the more irrelevant a feature is with respect to a certain class. The Chi-squared statistic is calculated for each term and, after ranking all the features, the most relevant are chosen. In the formal definition of Chi-squared, two features A and B are considered; they can have different values and are paired: (Ai, Bj), where A and B can take any value a or b
respectively, from 1 to c in the former and from 1 to r in the later. As explained in [41], the Chi-squared statistic is then calculated as:
χ2 =
c
X
i=1
r
X
j=1
(oij−eij)2
eij
(2.4)
where, with respect to (Ai, Bj), oij is the observed frequency and eij is the expected
frequency. eij is calculated as:
eij=
count(A=ai)×count(B =bj)
where N is the number of instances, count(A =ai) is the number of instances where
the value forA isai and count(B =bj) is the number of instances where the value for
B is bj.
In the comparative study of feature selection methods presented by Yang and Ped-ersen [111] the performance of the Chi-squared statistic is similar to IG when used as a ranking metric. Mineret al. [74] points out the correlation of the computational cost of the Chi-squared statistic with the size of the vocabulary.
2.4.1.3 Correlation Feature Selection (CFS)
Correlation Feature Selection (CFS) is used to identify and select sets of features which are “highly correlated with the class but with low intercorrelation” [107] in order to remove redundant or irrelevant features. Redundancy in this context is given by a feature being highly correlated with one or more features. As presented by Wittenet al. in [107], considering two nominal attributesA andB, their correlation is measured using symmetric uncertainty, which is defined as:
U(A, B) = 2H(A) +H(B)−H(A, B)
H(A) +H(B) (2.6)
where H represents the entropy function and H(A, B) the joint entropy of A and B. Symmetric uncertainty can take values between 0 and 1. The relevance of a set of features using CFS is determined by:
CF S =
m
X
j=1
U(Aj, C)
v u u t
m
X
i=1
m
X
j=1
U(Ai, Aj)
(2.7)
where the C in the numerator indicates the class and the (Ai, Aj) indicates a pair of
attributes in the set of features. If in a selected set of features there is a correlation between all them attributes and the class, the numerator (the total symmetric uncer-tainty) is then m and the denominator √m2, thus the CFS value will be 1, which is
the maximum symmetric uncertainty value that can be obtained. In other words it is not possible to distinguish between classes. It is therefore better to focus on smaller subsets of features in order to find subsets with low symmetric uncertainty that are highly correlated with a class label but have a low correlation between them.
2.4.1.4 Feature Weighting with Term Frequency-Inverse Document Fre-quency (TF-IDF)
T F −IDF(d, t) =T F(d, t)×IDF(t) (2.8)
wheredrepresents a document,trepresents a term, TF is the term frequency and IDF is the inverse document frequency. Term Frequency (TF) is the number of occurrences of a term (feature) in a document and is calculated as:
T F(d, t) = |d| X
i∈d
1{di=t} (2.9)
Document Frequency (DF) is the number of documents that contain a particular term. Inverse Document Frequency (IDF) [63], on the other hand, address the issue of DF not being a good discriminator by considering the importance of terms in relation to the total number of documents and to the number of documents in which the term is contained. IDF is calculated as:
IDF(t) = log1 +|d| |dt|
(2.10)
wheredis the total number of documents and dt is the number of documents in which
the termt is contained. The resulting TF-IDF weight is assigned to each unique term in the document set and all the terms are ranked from the highest to the lowest weight value indicating their relevance. A user defined thresholdk is used to select the topk terms.
2.4.1.5 Feature selection methods used
For comparison purposes with respect to the summarisation techniques proposed in this thesis two alternative feature selection techniques were considered: (i) Term Frequency-Inverse Document Frequency (TF-IDF) [63] plus Chi-squared [113] and (ii) TF-IDF plus Correlation-based Feature Selection (CFS) [40]. Both combine TF-IDF with another feature selection technique, namely Chi-squared and CFS. Chi-squared was chosen be-cause it is an established and widely used feature selection method that calculates the Chi-squared statistic of each feature in relation to a given class in order to identify the features that have relevance with respect to the class. CFS, on the other hand, identifies subsets of uncorrelated features amongst each other that, as a subset, are highly correlated with a class. CFS is not as widely used as Chi-squared but presents an interesting and different idea with respect to the selection of relevant features. In-formation Gain was not used because experiments (not reported in this thesis) were found to produce a very similar performance to that obtained using Chi-squared, thus corroborating the study by Yang and Pedersen [111].
the effectiveness of combining TF-IDF with other feature selection methods to improve the selection of relevant attributes and (iii) to compare how well they performed with data sets containing different types of data. Due to the different nature of the feature selection techniques used in conjunction with TF-IDF, different search methods were used in each case: (i) a ranking search method in the case of Chi-squared and (ii) a genetic search method in the case of CFS.
2.4.2 Relevant Text Classification algorithms
There is no single “best” classification algorithm that can be applied effectively to every data mining problem. The reasons for this are unclear but it is conjectured that this is due to the unique characteristics of individual datasets: (i) the type of data, (ii) the size of the data and (iii) the number and distribution of the classes amongst the records. Research conducted within the data mining community, over the last few decades, has resulted in many different techniques that might suit specific conditions (such as small data sets, data sets comprised mostly of numeric records and data sets that feature a large number of classes). With respect to the work described in this thesis a number of different classification techniques were considered: (i) Bayesian Classifiers (Na¨ıve Bayes), (ii) Decision Trees (C4.5), (iii) Rule Learners (TFPC and RIPPER), (iv) k-nearest neighbour (KNN), and (v) Support Vector Machines (SMO and LibSVM). Each is discussed in more detail in the following subsections. The seven indicated algorithms (Na¨ıve Bayes, C4.5, TFPC, RIPPER, KNN, SMO and LibSVM) were selected for a variety of reasons, as will become apparent in the following subsections.
2.4.2.1 Bayesian Classifiers
Bayesian classifiers are probabilistic classifiers based on Bayes’ theorem, which was proposed and named after Thomas Bayes. Bayes’ theorem is usually expressed as:
P(A|B) = P(B|A)P(A)
P(B) (2.11)
whereAis a hypothesis,B is evidence,P(A|B) is the posterior probability ofA condi-tioned onB,P(A) and P(B) are the prior probabilities of A and B respectively, and P(B|A) is the posterior probability of B conditioned on A.