This is a repository copy of Pilot Survey (Feasibility Study of Several Data Collection Techniques) – Queue Management Strategies for Urban Traffic Control Systems.. White Rose Research Online URL for this paper:
http://eprints.whiterose.ac.uk/2253/
Monograph:
Quinn, D.J. and Topp, K. (1990) Pilot Survey (Feasibility Study of Several Data Collection Techniques) – Queue Management Strategies for Urban Traffic Control Systems. Working Paper. Institute of Transport Studies, University of Leeds , Leeds, UK.
Working Paper 306
[email protected] https://eprints.whiterose.ac.uk/
Reuse
Unless indicated otherwise, fulltext items are protected by copyright with all rights reserved. The copyright exception in section 29 of the Copyright, Designs and Patents Act 1988 allows the making of a single copy solely for the purpose of non-commercial research or private study within the limits of fair dealing. The publisher or other rights-holder may allow further reproduction and re-use of this version - refer to the White Rose Research Online record for this item. Where records identify the publisher as the copyright holder, users can verify any specific terms of use on the publisher’s website.
Takedown
If you consider content in White Rose Research Online to be in breach of UK law, please notify us by
White Rose Research Online
http://eprints.whiterose.ac.uk/Institute of Transport Studies University of Leeds
This is an ITS Working Paper produced and published by the University of Leeds. ITS Working Papers are intended to provide information and encourage discussion on a topic in advance of formal publication. They represent only the views of the authors, and do not necessarily reflect the views or approval of the sponsors.
White Rose Repository URL for this paper: http://eprints.whiterose.ac.uk/2253/
Published paper
Quinn, D.J., Topp, K. (1990) Pilot Survey (Feasibility Study of Several Data Collection Techniques) – Queue Management Strategies for Urban Traffic
Control Systems. Institute of Transport Studies, University of Leeds. Working
Paper 306
Working
Paper
306
August
1990
PILOT
SURVEY
(feasibility study of several
data collection techniques)
Queue Management Strategies
for
Urban
Traffic Control Systems
D
J Quinn and K Topp
1. BACKGROUND
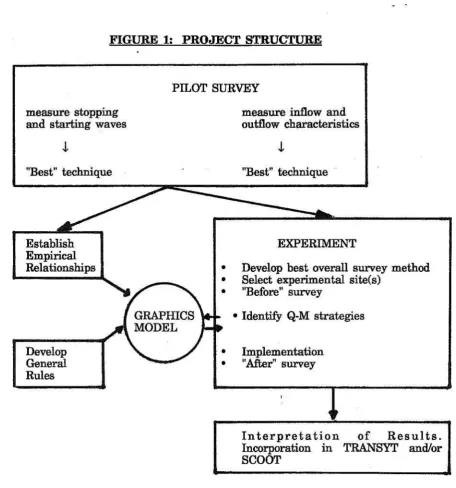
1.1 Advances in trafiic signal optimization have produced increases in the capacity of urban road networks, but recent growth in demand has meant that many junctions operate at or above saturation levels. Delay costs increase dramatically when queues extend to block upstream junctions and queue management strategies are now required to ensure that local t d c signals operate effectively when oversaturated conditions occur.
1.2 The aims of this SERC-funded project are as follows:
(a) To generalise the strategies for queue management that were developed and tested empirically in Bangkok (See
ITS
WP 249 and WP251);
(b) To develop a computer graphics model to represent queue propagation;
(C) To test the strategies' applicability and performance in
UK
networks;(d) To investigate their incorporation into standard signal optimization programs.
FIGURE 1: PROJECT STRUCTURE
I
PILOT SURVEYI
I
measure stopping and starting wavesmemure i d o w and outflow characteristics
I
EXPERIMENT
Develop best overall survey method Select experimental sit&)
"Before" survey
Identify
Q-M
strategiesImplementation "ARer" survey
2. INTRODUCTION
2.1 In order to develop a generalised strategy for queue management
it
is necessary to understand the relationships between speeds of stoppindstarting waves and the characteristics of the relevant t d c conditions both upstream and downstream of these shock-waves.2.2 Clearly, stoppindstarting wave speeds are related to the flow of tmEc, but a given flow could correspond to more than one speed and density (or occupancy). Therefore a second characteristic ought to be measured.
2.3 Occupancy was selected as the second parameter, given that it is most readily measured using existing detector technology and because, like flow, it is a time- based parameter. Further it may be possible to incorporate successful queue- management strategies into an on-line UTC system, such as SCOOT, making use of existing flowloccupancy detectors.
2.4 As a first step, a pilot survey was needed to test the feasibility and accuracy of a range of techniques for collecting data relating to the formation and dissipation of traffic queues, on a single lane within a signal-controlled network.
3. TRAFFIC PARAlVIETERS
AND
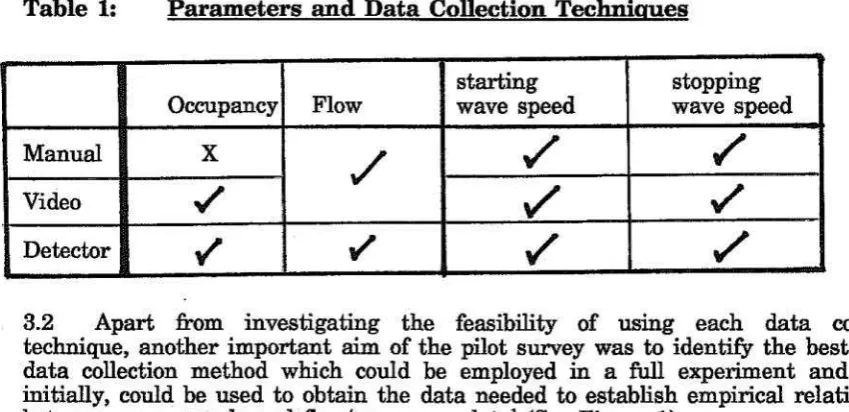
DATA COLLECTION TECHNIB.UES3.1 Three techniques (manual, video, automatic) were used to measure stopping/starting wave speeds and to collect flowloccupancy data for the relevant t r 6 c conditions. Table 1 outlines the parameters which were measured by each of the three possible techniques.
Table
1:
Parameters and Data Collection Techniaues3.2 Apart b m investigating the feasibility of using each data collection technique, another important aim of the pilot survey was to identify the best overall data collection method which could be employed in a full experiment and which, initially, could be used to obtain the data needed to establish empirical relationships between wave speeds and flow/occupancy data1 (See Figure 1).
'The pilot survey site was re-surveyed for a 4-day period (2-5 July 1990) one week after the pilot survey using a streamlined data collection method. Analysis of this data forms part of a PhD research project a t ITS, Leeds University, being
carried out by Hashim Al-Madanj..
-
[image:6.595.71.496.449.655.2]3.3 From Table 1 it can be seen that the pilot survey was designed to facilitate a full comparison between the three techniques for measuring the speeds of stopping and starting waves, and in particular, to examine how well detectors compared with both video and manual observations.
3.4 In terms of traffic flow, the aim was to establish the accuracy of detectors compared with a manual counting technique (i.e. either on-street or from video).
3.5 The use of a manual on-street method for measuring occupancy was considered unnecessary and impracticable. However, it was considered useful to compare occupancy data from detectors with a video technique using a slow-motion analysis.
4. SITE REQUIREMENTS
4.1 Physical/Geometric characteristics
.
60 to 100 meters,• straight level single lane
link,
.
no significant side street movements,• high buildings for filming,
• useful street furniture (distance markers).
4.2 Traffic control aspects
.
signalised junctions at upstream and downstream ends of the link,• no parking during survey period (i.e. pm.peak),
.
fixed-cycle plan (preferred),.
occupancy/flow detectors along link (see Section 5). 4.3 Operational characteristics.
the downstream exit should be free from blockages and restrictions (i.e. long periods of saturation flow should occur regularly);5. DETECTOR OPTIONS
5.1 A site was sought which had a sufficient number of existing detectors to negate the need for any additional loops. The West Yorkshire Highways, Engineering and Transportation Services (HETS) has authority for t d c signal installations in the West Yorkshire area, which includes:
-
isolated vehicle-actuated (VIA) signals-
UTC area with fixed-time signal plans-
SCOOT systems.5.2 VIA sites offered the possibility of using three
(XYZ)
loops positioned upstream of a stopline. However, two or more of the loops are usually wired together and, in this situation, useful data can be retrieved when only a single loop remains connected to the control box (i.e. the wires connecting the other loops must be disconnected). A further limitation is that the XYZ loops are normally found within approximately 30 meters of a stopline and not at the upstream entrance to a link.5.3 Generally, detectors are not required for a fixed time UTC system and in the case of SCOOT, a single detector only is needed a t the entrance to each link. However, within a recently installed SCOOT system there are often several sites that were formerly under VIA control. Under these conditions, therefore, it would be possible to identify a single link containing several detectors already installed a t key locations.
5.4 Engineers a t HETS supplied a list of nine SCOOT sites with dormant VIA detectors. Of these only two sites met all or most of the site requirements (see Section 4) and from these two only one site (in Wakefield) had VIA detectors which could be re-activated.
5.5 Figure 2 shows the layout of the selected link in the Bull Ring, Wakefield. The link offered two further advantages:
• an additional detector downstream of the stopline,
.
fixed-time signal plans even though SCOOT control was available. The disadvantages were that:the distance between the stopline and the upstream SCOOT detector was only 70 metres;
.
the selected link had a right-turn at the stop-line; VIA detectors covered two lanes;.
all three VIA detectors ( X n loops) were wired together, and therefore,useful data could be collected from one loop only;
• the SCOOT and VIA loops were connected
to
two different signal control boxes, which added to the problem of synchronization (Section6. DATA COLLECTION
-
MANUAL
TECHNIQUE6.1 The pilot survey was conducted on Thursday 21st June 1990 between 4 and 6 pm. Five observers were employed to stand on-street and record the exact time when stopping and starting waves passed over pre-determined points along the Bull Ring link. The observation points are illustrated in Figure 3. One observer, positioned a t the stopline, recorded the start of each startingtstopping wave. Three other observers were positioned at detector locations (including the SCOOT detector) and a fifth observer stood at a fixed point mid-way between the upstream VIA detector ("X" loop) and the SCOOT detector. (A short exercise in Leeds city centre c o n f i e d that one person could record the passage of stopping and starting waves at observation point only). Another observer recorded signal change times. 6.2
A
briefing session was held on the morning before the survey and each observer was given a split-second stop watch and very clear definitions of when to make entries on the prepared data collection forms (see Appendix A).7. DATA COLLECTION
-
VIDEO TECHNIQUE7.1 From an earlier analysis of other video tapes it was verified that the exact position of the end of a queue can not be estimated accurately from a general view of a link, due to problems of parallax. Therefore, it was necessary to position three cameras along the studied link with fields of vision tightly focused on the manual observation points.
7.2 An additional camera provided a general view of the entire
link,
but only for purposes of identifying the origins and destinations of vehicles, recording any events which might have affected the passage of shock waves along the link, and if needed, to co-ordinate the other three cameras.7.3 Permission was granted by building managerdowners to film from. three suitable positions (Appendix
B
includes a list of the relevant names and addresses).Figure 3 shows the fields of vision for each of the four cameras.
7.4 Camera 4 was positioned on-street very close to the SCOOT detector. Occupancy was measured from the film using a slow-motion analysis, and flow was also counted in order to complete the comparison with the flowloccupancy data retrieved from the SCOOT detector.
7.5 Cameras 2 and 3, together with camera 4, recorded the passage of stopping and starting waves from the stop line, through the manual observation points, and over the SCOOT detector installation at the upstream end of the link.
8. DATA COLLECTION
-
DETECTORS8.2 Although the detector situated downstream of the stopline was not needed for the purpose of making comparisons between data collection techniques, it was nonetheless activated on the day of the pilot survey in order to test the feasibility of synchronizing detedors connected to two separate signal control boxes (see Section 9).
8.3 All the VIA detectors were connected to a control box situated close to the stopline, while the SCOOT detector was linked to a control box close to the upstream end of the link. In order to collect flow/occupancy data the engineers a t HETS designed and assembled two single-board computers which were connected to each of the control boxes.
8.4 The two single-board computers were started at the same instant using two- way radios (alternatively a third person with a stop-watch could be used to give a simple visual signal (e.g. dropping of an arm) to indicate the exact moment when data collection should commence).
8.5 The data from the single-board computers were later off-loaded onto a micro- computer at the offices of HETS.
9. SYNCHRONIZATION
9.1 The synchronization of all timing devices (i.e. stopwatches, timing facilities in cameras and clocks in detectors) presented a formidable task.
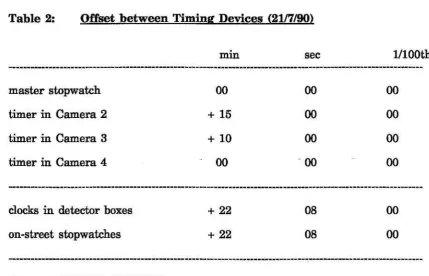
9.2 On the day of the pilot survey the timers in all cameras were started simultaneously, on-street, and the cameras were then carried to their filming positions. Unfortunately, it was found that the cameras (and the timers) switch themselves off after about 6 minutes when not set to the recording mode. It was necessary therefore to restart the timers in each camera (once positioned) and note the offset with the master stopwatch (see table 2).
9.3 Therefore, although the master stopwatch was started at 4 pm along with the timer in camera 4 (over the SCOOT detector) the timer in camera 3 was started exactly 10 minutes after the master stopwatch and the timer in camera 2 was started exactly 15 minutes after the master stopwatch (camera 1 had no stopwatch facility).
9.4 The handheld stopwatches used by the on-street observers were started a t the same instant when the clocks for the single-board computers (i.e. V-A and SCOOT detectors) commenced, which was precisely 22 minutes and 8 seconds after the start of the master stopwatch.
Table 2: Offset between Timing Devices (2117190)
min sec 11100th
master stopwatch 00 00 00
timer in Camera 2
+
15 00 00timer in Camera 3
+
l0 00 00timer in Camera 4 00 00 00
clocks in detector boxes
+
22 08 00on-street stopwatches
+
22 08 0010. ANALYSIS METHOD
Occupancy
10.1 Ten minutes of occupancy data was collected from the camera focused on the SCOOT detector. The slow motion facility on the camcorder was used to measure the time period during which the video picture of the detedor was occupied by a vehicle. The information obtained from the SCOOT detector itself, was the time, to the nearest tenth of a second, a t which the detector was activated and the time a t which it was deactivated. The percentage occupancies from the video tape and the SCOOT detector were calculated for each minute and the whole ten minute period. Flow Counts
10.2 Counts at the SCOOT detector were collected for three ten-minute periods. The information was obtained by counting the number of times that the SCOOT detector was activated. A stationary queue was present over the detector, at some stage during each of these periods. Motorbikes and cyclista were excluded from the count obtained from the video tapes.
Stopping and Starting Waves
10.3 The manual observers recorded the time, to the nearest hundredth of a second, that the stopping and starting waves reached their stations. (See Appendix A for definitions).
10.4 The time the stopping and starting waves reached stations 1, 3, 4 and 5
(Figure 3) were also transcribed from the video tapes. There was no video camera coverage of the
link
between stations 1 and 3, nor between 4 and 5. Thus in order to determine when an actual stoppingl
starting wave had reached the stations, the video tapes from cameras 2, 3 and 4 were viewed simultaneously. This technique permitted the stopping and starting waves to be followed from station 1 to the end10.5 The output from the SCOOT detector was also used to determine when the stopping and starting waves had reached the detector (i.e station 5). When a stopping wave was recorded a t the SCOOT detector, there was a minimum of five seconds between the time the detector was activated and the time
it
was deactivated. The activation and deactivation times corresponded to the times the stopping and starting waves reached station 5, respectively.11.
RESULTS OF THE
COMPARISONS
Occupancy
11.1 The percentage occupancy obtained from the video tape, for the ten minute period, was 1.8% lower than that obtained from the SCOOT detector, Table 3. The difference between the percentage occupancy obtained from the two methods, for the one minute periods, ranged from 0.86% to 3.67%, and the percentage occupancy of the data collected from the video tape was always lower than that obtained from the SCOOT detector.
Table 3: The percentage occupancies obtained from the SCOOT detector and transcribed from the video tape
[image:14.595.76.502.359.672.2]Time period Video % Occupancy SCOOT % Occupancy
...
l 58.8 62.5
Flow Counts
[image:15.595.91.509.170.337.2]11.3 The number of vehicles counted by the SCOOT detector was always less than the number of vehicles counted h m the video tape, Table 4. A paired t-test on the counts obtained from the video analysis and the SCOOT detector was insignificant at the 5% probability level
(PT
> 0.0533).Table 4: The vehicle count in three ten minute ueriods at the SCOOT detector and transcribed from the video tave.
[image:15.595.85.509.480.643.2]Time interval Video Count SCOOT Count
...
Starting and stopping waves
11.4 At stations one, three and four the data obtained from the video tapes were compared with that obtained by manual observers. A three-way comparison between the data obtained from manual observers, video tape and the SCOOT detector was made a t station five. The comparison of methods a t the different stations started with the same stopping wave and finished with the same starting wave. However, the number of waves recorded by the different methods at the same stations differed, Table 5.
Table 5: The number of stovping waves detected at the different stations by manual observers. video tave analysis and detectors
Station Manual Video Detectors
12. DISCUSSION
Occupancy
12.1 The use of the slow-motion facility in a video recorderlplayer to measure occupancy from video-film was time-consuming (about one hour to analyse 10 minutes of film) and was found to be inaccurate because:
.
it was difEcu1 to determine from the film exactly when the short section of road (i.e. the detector installation) was occupied and not occupied, and becauseS human reaction-time introduced further data e m .
Flow Counts
12.2 The minor difference (statistically insignificant a t the 5% probability level) between the flow counts using two techniques (i.e. SCOOT detector and manual from video-film) can be explained by the tendency for the SCOOT detector to undercount vehicles during highly congested periods. Table 2 shows that counts from the detector were consistently lower than the manual counts taken from the video-film for the same time intervals. This undemunting occurs whenever the tail of a leading vehicle fails to clear the SCOOT detector before the front of a following vehicle first arrives at the detector installation.
Stopping and Starting Waves
12.3 There was no statistically significant difference between the means obtained from the three techniques and there was little difference between the variances.
12.4 However, the number of waves measured by the three techniques at station 5 (i.e. at the SCOOT detector) differed because some drivers stopped on the detector itself to allow passenger to alight. These events were not identified as stopping1 starting waves in the video analysis because of the method used to reduce data from the several films and in the case of the observers standing on-street, these events could have been missed or ignored.
12.5 Also, the time of the stopping wave recorded by the SCOOT detector is earlier than that recorded by either the observer or transcribed from the video tape. In most circumstances, the time of the starting wave recorded by the detector is later than that recorded by either of the two other methods. This is due to the fact that the SCOOT detector is recording when the front-end of the vehicle moves over the detector and when the vehicle's rear-end leaves the detector, rather than the time the vehicle actually stops and starts.
13. CONCLUSION
13.1 From the above discussion it is clear that detailed video-fim coverage of a link offers a suitable and accurate technique for monitoring the passage of stopping and starting waves and it can offer, also, the opportunity to check flow data obtained from any detectors thought to undercount during periods of traffic congestion.
13.2 Additionally, the video films can be used to identify any s h u a n g by vehicles within a stationary queue as well as for turning counts and identifying when specific vehicles pass over flowloccupancy detectors.
13.3 For measuring occupancy, however, video-films are unsatisfactory and the data is best obtained from occupancylflow detectors.
13.4 It was shown that a SCOOT detector could be used to identify automatically the passage of stoppinglstarting waves, should this be required later in the main experiment. But, it must be remembered that the detector monitors when a vehicle first leaves or arrives at the detector installation and not the exact moment when the vehicle itself stops or starts.
14. RECOMlVIENDkTIONS FOR THE SECOND SURVEY {ZND
-
5TH
JULY)14.1 The aim of the second survey is to collect data that will be used to establish an empirical relationship (see paragraph 3.2). The time the stopping and starting waves reach designated points will be transcribed from video tapes. In order to avoid the problems of parallax, three video cameras will be sited in high buildings parallel to the link. A plan has been devised to overcome the problems of synchronizing the cameras and the detectors, Appendix D. Vehicles flows will also be transcribed from the video tapes
14.2 Another camera will film the entire link. It will be used to coordinate the other three cameras and provide information on any incidents that might occur and to identify vehicles using the right-turn lane.
APPENDIX A
DEFINITIONS
Stopping
Wave
Record the time in minutes, seconds and hundredth of seconds, at which a vehicle stops a t your station. If a vehicle does not stop exactly on your station record the next vehicle that stops just upstream.
Starting
Wave
Record the time in minutes, seconds and hundredth of seconds that the vehicle you observed stopping starts to move.
Note
Please do not move from your exact position on street, as your body is a marker for the video analysis.
APPENDIX B
BUILDING MANkGERS, BULLRING, WAKEFIELD
Camera
1:
MARYGkTE HOUSEowned by: GRE properties 17 Burton Street London W1X 7AH
tel: 071-493 9596
contact: Mr
RJ
Barrett agents letting the offies:Vickers Orriss Crown Court
Wakefield W 1 255
tel: 0924-291500
contact:
Mr
Lee CarnleyCamera 2: PIONEER MUTUAL HOUSE
owned by: Pioneer Mutual The Bull Ring
Wakefield WF1 1HA
tel: 0924-371 234
contact: Mr Tom Pyle
Camera 3: NATIONAL WESTMINSTER BANK CHAMBERS
owned by: National Westminster Bank 8 The Bull Ring
Wakefield WF1 1HA
tel: 0924-371 656
contact: Mr Farmery
ofices on topfloor rented by:
Nichols Hardie and Company
National Westminster Bank Chambers 8 The Bull Ring
Wakefield WF1 1HA
tel:
APPENDIX C
EQUIPMENT
AND
MANPOWER4 Video-cameras and recorders (at least three with split-second stopwatch facility)
4 Tripods
- 9 Stopwatches
2 Single-board computers
Miscellaneous
-
chalk, tapemeasure, t r a c cone9 People 3 to set-up cameras and
APPENDIX D
TIMETABLE I SYNCHRONIZATION METHOD
14.00 Leave University with equipment; drive to Wakefield
14.40 Drop-off equipment on Bull Ring person 1
-
guard equipmentperson 2 - collect key Vickers Orriss person 3
-
park car15.00 Place 4 tripods in appropriate filming positions
15.30 Return all cameras "on-street" (Bull Ring). Start recording on battery power and then simultaneously start stopwatches and stopwatch facilities in Cameras. If the stopwatch facilities in the cameras are started without the cameras set to recording mode then the cameras switch-off themselves (and the stopwatches) after about 6 minutes. As
6 minutes is not enough time to carry all the cameras back to the filming position, it is necessary therefore to start recording before synchronization of the stopwatch facilities.
15.45 Cameras replaced on tripods and switched to mains power supply (except camera on-street, which continues on battery power). Some camera batteries (i.e. power-packs) have enough power for 2112 hours,
while others are much shorter. Note: there is no effect on recording when the power supply is changed from battery to mains.
15.50 Meet
HET
Engineeds), and place the two single-board computers in the two signal control-boxes (situated a t the upstream and downstream ends of the Bull Ring link).16.00 Simultaneously start clocks in the two single board computers. This requires 3 people. Two people press switches on the single board computers while the third person holds a stopwatch and drops hisher
arm
a t the nearest full-minute (this time is noted).16.00 to
17.00 A full hour of data collection from detectors and video-filming.
17.00 Dismantle equipment and return to Leeds.