promoting access to White Rose research papers
White Rose Research Online
[email protected]
Universities of Leeds, Sheffield and York
http://eprints.whiterose.ac.uk/
This is an author produced version of an article published in
Transportation.
White Rose Research Online URL for this paper:
http://eprints.whiterose.ac.uk/75901/
Published article:
Thomopoulos, N and Grant-Muller, SM (2013)
Incorporating equity as part of the
wider impacts in transport infrastructure assessment: an application of the
SUMINI approach.
Transportation, 40 (2). 315 - 345.
Incorporating equity as part of the wider impacts in transport infrastructure assessment: an application of the SUMINI approach
Dr Nikolaos Thomopoulos
Dr Susan Grant-Muller
Institute for Transport Studies University of Leeds
34-40 University road, LS2 9JT, Leeds, UK
[email protected] Tel.: +44 113 3435357 Fax: +44 113 3435334
Abstract
The state of the art in appraisal of transport infrastructure (particularly for developed countries) is moving towards inclusivity of a set of wider impacts than has traditionally been the case. In appraisal frameworks generally Multi-Criteria Analysis (MCA) features as either an alternative to, or complementary with, Cost Benefit Analysis (CBA) particularly when assessing a wider set of distributional and other impacts. In that respect it goes some way towards addressing an identified weakness in conventional CBA. This paper proposes a new method to incorporate the wider impacts into the appraisal framework (SUMINI) based upon a composite indicator and MCA. The method is illustrated for a particular example of the wider set of impacts, i.e. equity, through the ex-post assessment of two large EU transport infrastructure (TEN-T) case studies. The results suggest that SUMINI assesses equity impacts well and the case studies highlight the flexibility of the approach in reflecting different policy or project objectives. The research concludes that this method should not be viewed as being in competition with traditional CBA, but that it could be an easily adopted and complementary approach. The value in the research is in providing a new and significant methodological advance to the historically difficult question of how to evaluate equity and other wider impacts. The research is of strong international significance due to the publication of the TEN-Ts review by the European Commission, as well as the transnational nature of large scale interurban transport schemes, the involvement of national and transnational stakeholder groups in the approval and funding of those schemes, the large numbers of population potentially subject to equity and other wider impacts and the degree of variation in the regional objectives and priorities for transport decision makers.
1. Introduction
Since Aschauer‟s (1989) research, the debate surrounding the actual benefits on productivity arising from public spending on infrastructure has raised controversy and remained unresolved. Aschauer (1989) argued that transport infrastructure investment creates significant benefits both for the economy and society overall. Despite the number of transport projects constructed in the period since and an abundance of published research on this topic, disagreement remains regarding the actual impacts of transport infrastructure investment (de Rus 2009; Grimsey and Lewis 2004; Sturm and de Haan 1995). The debate has been reflected in the evolution of differing transport infrastructure appraisal methodologies over recent years, regardless of whether the investment was by the national government, private sources or financing through PPPs (Public Private Partnerships).
The HEATCO research project (Odgaard et al, 2005) highlighted the dominant position of Cost-Benefit Analysis (CBA) in Europe. The widespread use of CBA to assess surface transport projects (i.e. road and rail), in EU-25 was clear, with all countries using some form of CBA for road projects and 21 countries using some form of CBA for rail projects. Only nine countries used MCA (Multi-Criteria Analysis) for road projects, whilst five employed this method for rail projects. Other methods were used to assess aviation or maritime transport projects, but their appraisal context is specific and out of scope for this paper.
Despite the dominant position of CBA, there have been continued attempts to bridge CBA with MCA, following broad acknowledgement of the limitations of CBA in capturing all positive or negative impacts of transport projects (Veron 2010; van Wee and Geurs 2011). The set of wider impacts that could be captured in principle are often described as socio-economic impacts, project externalities or more recently as wider socio-economic impacts of transport projects. Examples include environmental impacts e.g. pollution or noise (Thanos et al. 2011), benefits to the natural habitat (Mancebo Quintana et al. 2010), visual intrusion, health impacts (Oxman et al. 2009), settlement cohesion, accessibility, land use planning, agglomeration, labour displacement, habitat fragmentation and equity. The set of wider impacts that should be captured in practice is not formally agreed and is likely to vary with the nature of the project. Mackie and Nellthorp (2001) offer a generic description of the wider impacts of transport to justify the commonly anticipated outcome that transport infrastructure projects will generate economic benefits. Their description is based on the argument that: “changes in transport costs should be reflected in changes in
accessibility, which in turn changes the pattern of demand for land. Finally, the level and pattern of prices and outputs is modified” (Mackie and Nellthorp 2001). It is clear that transport infrastructure, accessibility and land use planning are interrelated and should ideally be assessed in a unified framework. Moreover, Mackie and Nellthorp (2001) highlight the weakness of CBA in accurately assessing environmental and redistributive effects of transport infrastructure. Distributional impacts are linked with a range of impacts and in particular with equity. These impacts are important as new or improved transport infrastructure may result in the redistribution of economic activity, either within spatial regions or within social groups.
other types of wider impacts. Despite the lack of agreement among academics regarding the terminology used for wider impacts, Annema et al (2007) highlight the significance of this issue for standardized assessment methods, including CBA.
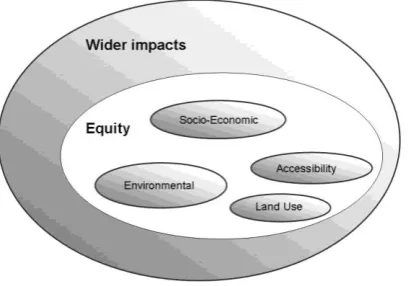
Figure 1: Interrelation between wider impacts of transport projects and equity
In summary, SUMINI uses a Multi-Criteria Analysis (MCA) approach to quantify the implications of transport infrastructure improvements over a range of equity types. The equity types and principles included in an application of the method can be varied according to the specific context, but core types are outlined in section 3. Whilst there is some variation in the terminology, these equity types feature in existing policy documents at national or European levels (EC 2002; EC 2006; Proost and van Derden 2010), for example the Lisbon Strategy (EC 2000), the recent Europe 2020 strategy (EC 2010) or the latest EU 5th Cohesion report (EC 2011a), which explicitly refers to economic, social and territorial cohesion. It is worth noting that equity is often intertwined with broader socio-economic or environmental objectives under the sustainability concept (EC 2009a; Taebi and Kadak 2010). Many of the policy objectives reflected in these documents (i.e. improving transport infrastructure whilst delivering broader socio-economic and environmental benefits to meet relevant policy aims (MOVE 2010)) have formed the rationale for funding the development of Trans-European Transport Networks (TEN-Ts). It is therefore at least appropriate – if not a requirement – to capture equity effects in the assessment of project impacts.
A further significance of the research is reflected in Timms (2008) i.e. the “need
for a widescale change in the field of transport modeling, in terms of both its underlying philosophy and practice”. This need is addressed by offering an analytical framework to decision makers that has the potential to reflect very different stakeholder perspectives on equity principles – or other wider impacts as SUMINI is flexible in that respect. The method therefore corresponds with an emerging interest around ethics in transport assessment practice (van Wee 2011). The research also adds to the debate between the use (and relative merits) of CBA and MCA, supporting emerging arguments that these two methods are not competing but complementary to each other (Quinet 2010). In terms of contribution to practice within the transport community, impact distribution is of interest within transport projects as diverse as road user charging or intelligent transport systems, both at an urban and inter-urban context. As a result the scope of application for SUMINI is considerable.
The following section continues with a brief review of relevant literature relating to the methodological state of the art. Section 3 presents an outline of the SUMINI methodology, with case study results in section 4. Suggestions for further methodological development to assist future decision making are provided in section 5, based on the discussion of strengths and weaknesses of the method, whilst concluding remarks and recommendations are presented in section 6.
2. Transport appraisal methods and wider impacts
In this section a review of the most relevant state-of-the-art in transport appraisal approaches is provided, firstly addressing methodology and subsequently current practice. The literature is potentially expansive and therefore focuses here on the treatment of wider impacts and equity in particular. It begins with a discussion of the limitations of CBA in terms of the inclusion and distribution of wider impacts. A summary is then provided of alternative approaches that largely lie outside conventional CBA. This extends into a discussion of how MCA approaches may be used to reflect equity and work in complement to CBA, which forms the basis for SUMINI. Finally an overview is given of practical approaches towards wider impacts in national transport appraisal methods for a selection of developed countries.
2.1 A methodological review
2.1.1 CBA scope and critique
Current funding instruments and practice actively promote the use of CBA within Europe (OECD 2011). The existing regulatory assessment framework requires that a CBA is undertaken when evaluating projects funded by EU Cohesion funds, which has partly funded several TEN-Ts and TINAs1 (Florio 2006). This requirement continued following the introduction of „territorial cohesion‟ as a further impact to be considered following developments in EU cohesion policy (EC 2011a). The same requirement applies to transport projects co-financed by the European Central Bank.
CBA is currently the most widely used method for transport appraisal in Europe (Odgaard et al. 2005). Mackie and Nellthorp (2001) and Willis (2005) provide a good overview of CBA theory in the context of assessing transport impacts. Social CBA (SCBA) is an extended version specifically developed to address some of the limitations in conventional CBA by including social and other indirect project impacts (HMT 2011). SCBA compares the Business As Usual (BAU) scenario with the alternative of operating the new infrastructure. Saitua (2007) states that “SCBA seeks
1
to evaluate all the expected impacts of an option or a project on all the individuals of a society, not just the parties directly involved as consumers or producers”. Whilst SCBA extends the range of impacts considered, it still faces some common CBA criticisms due to the need to quantify the impacts in monetary units (HMT 2011: 58). Gowdy (2004) raises a problem with Potential Pareto Improvements (PPIs) which form the foundation of CBA. PPIs require welfare comparisons between individuals, while this whole theory is based on the assumption that all consumers behave rationally. The assumption of rational choices which result in non-maximum welfare distributions is internally inconsistent, generating an indispensable need for a decision making framework based on certain values and principles when assessing equity or other wider impacts of large projects (Sen 1970; van Wee 2011).
A general limitation of CBA is the inability to address some intangible social, environmental and strategic concerns (Beuthe 2002; Shang et al. 2004). This limitation arises from the requirement that all impacts should be monetized, which is either not possible or infeasible due to limited resources in many cases (Johansson-Stenman 1998; SPECTRUM-D6 2004). Such impacts are commonly referred to as Wider Economic Benefits (WEBs), which may be defined as: “benefits additional to
user benefits arising as a consequence of failures in markets impacted upon by the transport intervention” (Laird and Mackie 2009). Those impacts occur either due to market failures or due to market inexistence and are linked with agglomeration externalities, market power arising through product differentiation or geographic isolation and the presence of an indirect labour tax. When markets fail, this could be because they are imperfect or because current prices are not equal to social marginal cost prices (Laird and Mackie 2009). The prices used within a CBA present a further dimension of variation both between countries and between regions of the same country. Observed market prices or wages in less developed regions do not always reflect the social opportunity cost of goods and services, in particular of capital and labour, mainly due to widespread market failure and policy constraints. This distortion has consequences on the financial and social discount rates used in CBA, which is directly linked to different types of equity. It is therefore important to incorporate WEBs in transport assessment. In conventional CBA they have been treated by one of the following approaches:
i) Monetization within CBA, either using a WTP (Willingness To Pay) or WTA (Willingness To Accept compensation) basis, which often corresponds to an average national value. Revealed preferences methods may also be employed.
ii) omission from the CBA, with solely a qualitative appraisal.
Nevertheless both conventional CBA and SCBA still attract some criticisms. As Pearce et al. (2006) wrote “few issues in CBA excite more controversy than the use
of a discount rate” – in particular the diverse categories of rates (e.g. financial, social/economic – Bickel et al. 2005) and the diverse rates used, ranging from 3% to 12% (Lopez 2008; Odgaard et al. 2005). Variation also occurs in other key components of CBA, including values attached to time, human life and emissions (Veron 2010: 23). The distribution of those impacts raises spatial or social equity issues, particularly for large transport infrastructure projects crossing national borders such as TEN-Ts. Another common criticism of CBA is the time horizon used in project assessment, which is again an issue for cross border projects (Wiegmans 2008). Further discussion on the limitations of CBA can be found in Mackie (2010), Thomopoulos et al. (2009), van Wee and Geurs (2011) or Vickerman (2007).
therefore faces similar criticisms to conventional CBA. Khisty (1996) extends the debate by introducing an impacts distribution table based on diverse equity principles. The issue of how decision makers decide upon these different equity principles remains open though. It is also assumed that positive impacts are generated and a CBA has already been undertaken, thereby overcoming practical limitations.
Similar issues have emerged in the literature concerning the assessment of urban or inter-urban rail projects (Buchanan et al. 2006; de Rus 2009; Graham 2007), particularly with respect to agglomeration effects. In general the limitations concerning treatment of these wider impacts include both the impact assessment method and distributional issues. The difficulties in addressing these presents a risk to cohesion and equity between certain spatial regions or social groups, thereby influencing societal well-being overall. Whilst the use of CBA may be pragmatic in certain circumstances, it may not always best serve the transport needs of society (Tudela et al. 2006; van Wee 2012). Whilst alternatives to CBA exist, they have not been widely applied or do not adequately address key CBA limitations. An overview and critique of existing alternatives is given in section 2.1.2.
2.1.2 CBA alternatives in appraising equity impacts for transport schemes
Alternatives to CBA for appraising equity include the Capability Approach (Beyazit, 2011), the meso-scale approach (Radej 2011), the integrated efficiency equity measure (Rietveld 2003), the Benefit-Cost table by Khisty (1996) and Lorenz curves (Delbosc and Currie 2011). However these have not been tested empirically in a large transport infrastructure project context to date.
The Capability Approach (CA) based on Sen‟s theory (Beyazit 2011) is a new proposal to include social justice in transport appraisal. However, this approach has only been tested for small projects at a local level in developing countries, as it requires participation by a large number of community members and stakeholders. It doesn‟t propose any firm rules, or an approach to aggregate weights from different stakeholders, or a sensitivity analysis. It is also very context specific making it unsuitable for large cross border infrastructure projects. Similarly, Radej‟s (2011) suggestion to use a range of indicators to conduct a meso-scale evaluation lacks a complete framework to fulfill the task.
Delbosc and Currie (2011) recently attempted to assess equity in a public transport context using Lorenz curves and a public transport index. This approach focuses more on spatial rather than social equity due to data availability, but is open to current criticism of the Gini coefficient. An important point is the lack of information about equity within spatial units and the inability of Lorenz curves to address this.
Sue Wing et al (2010) report two main approaches towards resolving the economic assessment of larger transport schemes: a micro-scale approach utilising CBA or a macro-scale econometric analysis. Their suggestion, (also that of Radej (2011)), is to use a meso-scale to bridge the gap between those two approaches.
In summary, alternatives to CBA in assessing equity exist but few have been successfully applied in the context of large transport infrastructure projects. Other potentially complementary methods to CBA lie within the MCA group and a critique of
these within the context of assessing wider impacts and equity in particular follows.
2.1.3 MCA in complement to CBA in appraising equity impacts for transport schemes
(section 2.1.1) and the desire of theorists and practitioners to better combine quantitative and qualitative methods (Haezendonck 2007), it is timely to explore new methods which could be used in conjunction with CBA. Gamper et al (2006) provide a comprehensive comparison of the merits of CBA and MCA for further background.
Country Equity
assessed
Appraisal method
Cohesion
assessed Level Method
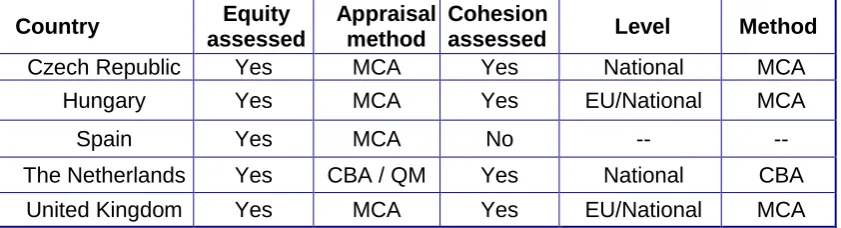
Czech Republic Yes MCA Yes National MCA
Hungary Yes MCA Yes EU/National MCA
Spain Yes MCA No -- --
The Netherlands Yes CBA / QM Yes National CBA
[image:8.595.89.510.134.248.2]United Kingdom Yes MCA Yes EU/National MCA
Table 1: Equity and cohesion assessment methods in selected EU countries (Source: based on Odgaard et al. (2005))
There are situations when no satisfactory monetary values exist for appraisal elements and this is where MCA techniques have merit. MCA does not seek to monetise and therefore allows more impacts to be included in the appraisal. In similar vein to CBA, MCA can be used in such a way as to allow projects to be ranked and prioritized – although it should be noted that this is not how MCA is used in the SUMINI method. When a high level of detail is needed to reflect the scheme objectives, MCA offers various ways of aggregating the data on individual criteria to provide indicators of the overall performance of alternative options (OECD-JRC 2008). A key feature of MCA is the emphasis placed on the judgement of the decision making team; in establishing objectives and criteria, in estimating relative importance weights, and to a certain extent, in judging the contribution of each option to each performance criterion. MCA also has the potential to bring a degree of structure in the whole decision making process (DETR 2000).
There are also criticisms of MCA - weights must be attributed to each criterion, bringing subjectivity and it is potentially time consuming and complex. Nevertheless it adds transparency to the appraisal as decision makers are required to consider and express their preferences based on the overall project or policy objectives.
This research uses a MCA approach that seeks to address some of these criticisms. The state-of-the-art is extended in terms of the link between composite indicators and MCA methods (in this case AHP i.e. Analytic Hierarchy Process) given the rationale that: “the aggregation convention used for composite indicators deals
with the classic conflict tackled in criteria evaluation. Thus, the use of a multi-criterion framework for composite indicators in general […] is relevant and desirable”
(Saltelli et al. 2008). The role of AHP in the decision making process is to estimate the contribution of each criterion (i.e. the five equity type in section 3) towards the overall goal. Each criterion should have a different contribution, although it could be equal for two criteria - or for a criterion to have no contribution (i.e. a null weight). The relative weights are established using a pairwise comparison process and based on the principle that this pairwise procedure is easier for decision makers than a direct comparison of five criteria simultaneously. Saaty (1999) and Tudela et al. (2006) give further background to AHP and its link with CBA, whilst Hajkowicz (2007) and Tsamboulas et al. (1999) provide a comparison between MCA methods.
2.2 Treatment of Wider Impacts in National frameworks
The inclusion of the wider impacts of transport infrastructure schemes had a significant boost when Strategic Environmental Assessment (SEA) was first introduced through the milestone European Directive 2001/42/EC, with enforcement by EU-27 from 2004 and no widespread use in OECD countries. It promotes the inclusion of environmental impacts in transport appraisal (Jiliberto Herrera 2009) and was recently implemented in assessing expressways in China, but with ambiguous outcomes (Zhou and Sheate 2011). SEA can also promote broader sustainability related objectives i.e. wider impacts, including equity concerns. Sustainability lies at the core of SEA and equity lies at the core of sustainability. In practice a range of equity types are contained in sustainability depending on the context ie the country, authority or transport project (Rogers et al. 2008). Despite this there is no common application approach for SEA, which is the subject of ongoing debate (Wallington et al. 2007). The implementation of SEA is challenging, but it may contribute significantly to strategic transport infrastructure planning if considered as a separate component to Environmental Impact Assessment (Partidario 2009).
Alongside these developments, a small group of countries have led the way and updated their transport appraisal frameworks to include wider impacts. These are countries with a generally well developed transport infrastructure and a well defined assessment framework. As potential candidates for new methodologies addressing wider impacts such as SUMINI, an overview of these frameworks follows.
England, Scotland, Germany and Japan have developed their own inclusive assessment frameworks. NATA (The Department for Transport, England) includes guidelines on impact distribution, stressing the value of this issue, although the primary focus is on social exclusion e.g. disadvantaged groups (DfT 2011a; DfT 2011b). Increased interest in England is reflected in the Treasury‟s Green Book (Annex 5), which acknowledges current limitations e.g. in the assessment of non-monetary impacts where average values are used across all income groups according to relative prosperity (HMT 2011: 92). The need for adjusted weights for specific projects is explicitly mentioned and this is of relevance to SUMINI. No uniform weight derivation approach is proposed though, with only a social welfare function linking personal utility with income as an example. The ongoing sustainability debate in the UK also covers notions of equity, distributional impacts and accessibility of transport systems (Marsden 2007) and the debate has been invigorated by the 2007 NATA Refresh (Mackie 2010). Japanese practice uses the Benefit Impact Table (BIT) which provides discrete user-categories as well as indirect effects (Nakamura 2000). As a result it provides the data and information needed to assess the wider impacts, including social equity of a project (Morisugi 2000). In Germany, the recently updated Federal Transport Infrastructure Plan (FTIP), departs from a traditional CBA with a separate appraisal section covering spatial impact assessment. This is considered to be inclusive of wider impacts such as equity although only in a restricted sense (FTMBH 2003; Rothengatter 2000).
In contrast, practice in the Netherlands has evolved alongside EU policy and is still largely based on CBA, including SCBA. The Guidelines Framework for Project Assessment (OEEI - Overview of Economic Effects of Infrastructure) launched prior to 2000 followed lengthy discussion on the spatial and wider impacts of transport (De Jong and Geerlings 2003; EC 2009b). In France, whilst equity considerations with a social or spatial dimension were part of the former MCA appraisal method, they are not explicit in the new, more specific approach (Quinet 2010).
previous efficiency focus. Equity, accessibility and level of service are assessed through indicators, whilst a welfare CBA approach characterises the framework overall (Shiftan et al. 2008). The US Transportation Equity Act for the 21st century (TEA-21) has shown partial success in its main policy aims, but has not yet established the appraisal methodology explicitly (Olson 2000; Ecola and Light 2010). The STAG approach (Scotland) takes a similar approach to NATA, providing a general framework to assess transport infrastructure including wider impacts. Software focussing around the assessment of equity impacts and based on Khisty (1996) has been tested in Australia, but have not been applied nationally to date (Tsolakis et al. 2005). Veron (2010) provides a useful overview of the assessment of wider impacts in selected countries, distinguishing between quantitative approaches (monetisation) and those assessed qualitatively. Whilst equity is not explicit in the analysis, it is implicitly included through the regional distribution of wider impacts.
These developments illustrate the international interest and practical difficulties in incorporating wider impacts and particularly equity in the appraisal of large transport infrastructure. The outcome of this brief overview is mixed, with both similarities and differences between countries (Hayashi and Morisugi 2000). However an appreciation of both is valuable in establishing the scope and requirements for a new equity approach with practical potential.
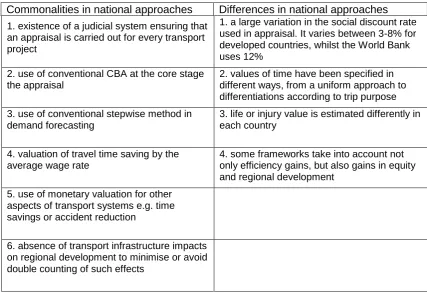
Table 2: Similarities and differences in incorporating equity considerations in appraisal frameworks (Source:Hayashi and Morisugi 2000)
Commonalities in national approaches Differences in national approaches
1. existence of a judicial system ensuring that an appraisal is carried out for every transport project
1. a large variation in the social discount rate used in appraisal. It varies between 3-8% for developed countries, whilst the World Bank uses 12%
2. use of conventional CBA at the core stage the appraisal
2. values of time have been specified in different ways, from a uniform approach to differentiations according to trip purpose 3. use of conventional stepwise method in
demand forecasting
3. life or injury value is estimated differently in each country
4. valuation of travel time saving by the average wage rate
4. some frameworks take into account not only efficiency gains, but also gains in equity and regional development
5. use of monetary valuation for other aspects of transport systems e.g. time savings or accident reduction
6. absence of transport infrastructure impacts on regional development to minimise or avoid double counting of such effects
The point of difference (4) in Table 2 has been the main motivation for this paper. Empirical research has shown that whilst equity features in several major policy documents, it is rarely explicitly addressed in formal appraisal methods. The main shift in future may be away from conventional CBA towards a more inclusive framework, potentially linked to MCA methods. The success of that shift will only be determined in time and through ex-post evaluations of transport projects in practice.
[image:10.595.83.511.348.641.2]
In order to bridge the gap between quantitative and qualitative practice and demonstrate that MCA can act in complement to CBA in assessing wider impacts, a new methodology (SUMINI) has been developed. This progresses the arguments of Tudela et al. (2006), although other contemporary approaches in this field have been suggested by Camagni (2009) (proposing a methodology for Territorial Impact Assessment), Beyazit (2011) (advocating Sen‟s Capability Approach), Gutierrez et al (2011) (focusing on accessibility alone) and Broecker et al. (2010) (assessing spatial equity impacts of TEN-Ts).
3.1 An overview of SUMINI
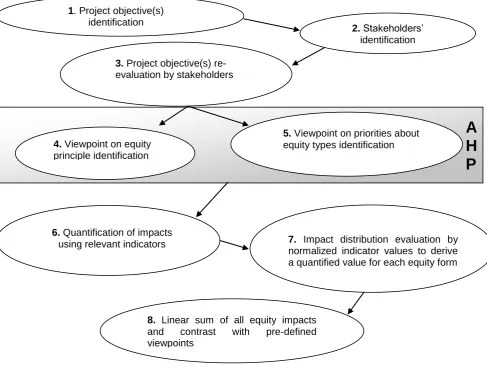
[image:11.595.71.559.290.661.2]The new approach applied here (SUMINI) advocates the use of AHP, a specific MCA method which is not constrained by the limitations of CBA but addresses many of the criticisms of MCA (section 2.1). Comprehensive detail on the SUMINI method is given in Thomopoulos et al. (2009) and Thomopoulos (2010), but the focus in this paper is on practical advantages and implications. The eight stages of SUMINI are outlined in Figure 2:
Figure 2: Eight stages of the SUMINI method
At the heart of SUMINI is the Analytic Hierarchy Process, initially developed by Saaty (1980) and aimed at decomposing a complex decision making process into a hierarchical structure, (Tudella et al. 2006). The overall goal of the project or scheme
1. Project objective(s)
identification 2. Stakeholders‟
identification
3. Project objective(s) re-evaluation by stakeholders
4. Viewpoint on equity principle identification
5. Viewpoint on priorities about equity types identification
A
H
P
6. Quantification of impacts
using relevant indicators 7. Impact distribution evaluation by normalized indicator values to derive a quantified value for each equity form
is represented by a number of criteria, which are then assigned weights according to decision makers‟ priorities. For each of the project or scheme alternatives a score is generated against each of the criteria, which is then multiplied by the decision makers‟ weights and aggregated into an overall scheme score. Essentially, it is a method of transforming subjective assessments of relative importance to a quantified set of overall weights and scores (DETR 2000).
This hierarchical structure to problems is a significant contribution to aid decision makers and facilitates stakeholders‟ participation by allowing each to assign weights (i.e. the relative importance of a criterion) which can afterwards be summed to form a composite indicator (OECD-JRC 2008). It offers a balance between normative and positive frameworks, which has been the subject of much academic debate (Flyvbjerg and Richardson 2002). Further advantages of AHP include its flexibility to be applied in a wide range of contexts from management to manufacturing (Barfod 2006) and ability to accommodate both quantitative and qualitative data.
In this paper the perspectives and priorities of stakeholders are used to derive weights through pairwise comparisons for a range of equity types and principles. Stakeholders must initially decide on which of (mutually exclusive) equity principles are to be applied and then on the equity types (which can be complementary) based on the policy/programme/project objectives (see stages 1 and 3 – Figure 2):
a) Equity Principles
P1- Utilitarian policy principle
aims to maximise the net benefit for all regions impacted by the project, disregarding the distribution of benefits
P2 – Equal shares policy principle
distributes an equal share of all project benefits to all regions impacted
P3 – Rawlsian policy principle
distributes project benefits to the least advantaged regions until those reach the level of the most advantaged regions
P4 – Egalitarian policy principle
reduces pre-existing inequalities between regions by distributing all project benefits to the least advantaged regions
P5 – Minimum floor policy principle
distributes a minimum level of benefits to all regions
P6 – Maximum range policy principle
sets a maximum range of benefits to be distributed to each region and distributes project benefits to all regions respectively
b) Equity Types
T1 – Horizontal equity objective
The project distributes the same benefit to all regions with similar socio-economic characteristics
T2 – Vertical equity objective
The project benefits more the least advantaged regions instead of the most advantaged ones
T3 – Environmental equity objective
T4 – Regional / Spatial equity objective
The project distributes most benefits to the least advantaged and remote regions instead of those centrally located
T5 – Accessibility objective
The project improves accessibility for all regions impacted
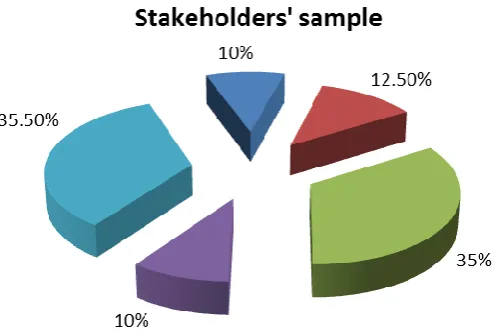
AHP is used to conduct pairwise comparisons on equity types (stage 5 – Figure 2) following initial pairwise comparisons on equity principles (also using AHP, stage 4 – Figure 2). This identifies the priorities of each stakeholder concerning the various equity principles (e.g. egalitarianism, utilitarianism, Rawlsian). To ensure consistency only one equity principle can be applied throughout the decision making process and the aggregation method is decided in advance. In practice the priorities may already be explicit (for example in sections of national policy documents) or may be implicit (for example incorporated in political decision making processes) or may be embedded in the individuals‟ expertise and political capital. A weighted sum is then calculated to represent the view of the whole group of selected stakeholders, where for example, the decision making authority may be given the largest weight and others a lower weight (e.g. 80% for the elected political authority, 10% for academics and 10% for local stakeholders). A linear additive model has been used in SUMINI, based on simplicity for the application of the method and current practice (e.g. Camagni 2009), as shown in (1):
Sm =
mij j
w
(1)
where the value score εij of each criterion (i.e. sub-indicator) is first multiplied with the respective weight wj and then summed to develop the total for each equity type Sm. As a result equity theories (e.g. Barron 2000; Khisty 1996; Young 1994) are linked with the stakeholder‟s priorities and the predefined project objectives (as identified in stage 3 – Figure 2). This task is based on AHP (Saaty, 1980) and the practical implementation of Berittella et al. (2007).
Figure 3: Stakeholders‟ sample
As with any new methodology (Yin 2009), a pilot study was conducted in two stages - in this case in both the UK and Greece - to address any survey design issues and maximise the response rate. From the outset it was clear that there are inherent difficulties arising from the nature of the topic (ie equity impacts, as some stakeholders are unfamiliar with the topic) and also with the number of criteria to be included in the AHP pairwise comparison process. Some respondents experienced particular difficulties when faced with over seven criteria to compare. As a result it was decided to use six equity principles and five equity types (plus intra- inter-generational equity) in the AHP survey. It also became clear that a paper based questionnaire was not an effective data collection method, so an on-line based questionnaire in English and Greek was developed and used instead.
The software application used for the research was Comparion Core, a specialist AHP software which supports multiple participants and languages, making it particularly suitable for assessing cross-border transport infrastructure projects. Moreover the use of this software facilitated and resolved issues of consistency and analysis. One of the useful features is the Consistency Index facility which allows the researcher to identify inconsistent responses. It may be argued that it is not appropriate to given equal treatment to the views of all stakeholders as they have different roles and interests in the decision making process. However, the approach adopted in this research is that stakeholder participation should be increased for large infrastructure projects and therefore all views should be treated equally (egalitarian approach). This does not imply that stakeholders should replace the decision maker, but given that SUMINI acts as a decision aid methodology it should be kept as open and flexible as possible. In the future, depending on the participation of stakeholders in the AHP survey, it may be possible to use different weights for the views of alternative stakeholder types to explicitly reflect their role in the decision making process2.
The two TEN-T projects selected to illustrate application of SUMINI are the Oresund Link between Denmark and Sweden and the Egnatia Motorway in Greece. By conducting an ex-post evaluation using a range of proxy indicators for each equity
2
type (T1-T5) an assessment is made of whether the equity objectives of each project (as set out through the respective policy documents) have been achieved. The level of achievement of the equity objectives is given by comparing the value of the overall composite indicator between the before and after scenarios. The analysis therefor follows Veron (2010) in focusing on the final summary outcome rather than the process or partial outcomes.
Table 3 shows the proxy indicators used in the two case studies corresponding to each of the equity types. The indicators are not fixed and may be adjusted according to the project or application context.Aside from data availability, which is a common constraint, the criteria used to select the indicators to construct the composite indicator have been:
1. Accuracy: data provided by a national/managing authority
2. Comparability: indicator data available at the disaggregate level (NUTS-2 and NUTS-3) included in this analysis
3. Credibility: indicators found in the literature or have been used in other assessment studies
4. Duration: indicator data available for a minimum of three years or preferably before and after each TEN-T project was operational
5. Equity link: there is a justified link between each indicator and its impacts on the respective equity type
6. Redundancy: no indicator is measuring the same impact, avoiding double counting of project impacts
The state of the art reflected by existing literature and the community of practice provided the rationale for the final indicators selected.
Table 3: Summary of proxy indicators used for each equity type.
Horizontal Vertical Environmental Regional Accessibility
T1 T2 T3 T4 T5
Network length Car ownership Noise annoyance International trade
Location accessibility indicator
Network density Passenger
numbers Emissions Unemployment
Potential market accessibility indicator Settlement
cohesion Land prices
Proximity to protected
areas GDP
Daily accessibility indicator
New businesses Accidents Natural habitat intersection Population density
Average annual trips from all regions to each NUTS-3 region
Water crossings Tourism
Fragmentation
Artificial/Agricultural land
All indicator values are normalised using the re-scaling method (OECD-JRC, 2008) to produce comparable data across diverse equity types. According to this
method (2), each indicator xtqc for a given region c and time t is transformed:
Itqc=
minc (xtq) = minimum value of x t
qcacross all regions c in time t
maxc (x t
q) = minimum value of x t
qc across all regions c in time t
In this way the normalised indicators Iqc have values between 0 and 1, which is one of the attractive features of the Gini coefficient. However, re-scaling allows more flexibility and avoids the limitations of the Gini index. The indicator for accessibility at NUTS-2 level for example is: A = a1 + a2 + a3 + a4 and A‟ = a‟1 + a‟2 + a‟3+ a‟4 where a1, a2, a3, a4 are thevarious accessibility indicators used (e.g. location accessibility indicator, potential market accessibility indicator, daily accessibility indicator and average annual trips at NUTS-2 level) and A, A‟ the values at the given year e.g. in 2000 and 2007 (before and after the project became operational respectively). The same procedure is followed for the rest of the indicators for each equity type.
The weights derived from stakeholders for each case study (stages 3 and 4) are then utilised to construct the composite indicator according to the OECD-JRC (2008) linear sum methodology (3):
CI = w1 x T1 + w2 x T2 + w3 x T3 + w4 x T4 + w5 x T5 (3)
where CI is the Composite Indicator for each TEN-T project, wi is the respective weight for each equity type derived through the AHP survey and Ti is the respective equity type. This approach also corresponds with the suggestion of Timms (2008) that it is not appropriate to have a single „story teller‟ acting as the decision maker or modeller. Diverse viewpoints are therefore incorporated in SUMINI through the use of different weights and scenarios.
By employing a composite indicator based on the OECD-JRC (2008) methodology, SUMINI is able to offer a single metric to decision makers. A composite indicator therefore satisfies the simplicity objective of any new measure and as a single summary metric, resembles the use of the BCR measure within conventional CBA3. This may aid the conciliation of CBA with MCA as it has been established that decision makers appreciate a single summary value within the decision making process. As a result SUMINI is able to provide a practical alternative to other approaches to appraise equity and other wider impacts of transport projects (Broecker et al. 2010; Camagni, 2009; Delbosc and Currie 2011).
The following section presents the results from the ex-post application of SUMINI in the two TEN-T case studies by way of illustration of the method. Given that an appraisal framework has not previously been established to evaluate whether each project has achieved their equity objectives, both the outcomes and the methodological illustration are of interest. TEN-Ts case studies were selected due to their strategic objectives with respect to equity (Proost and van Dender, 2010, Proost et al. 2011).
4. Illustrative results: equity impact assessment using SUMINI
Two very different TEN-T projects were used as case studies to illustrate the SUMINI method - the Oresund link (a road bridge connecting Sweden and Denmark) and the Egnatia motorway, traversing the mountainous region across Greece. In each case a discussion of the findings on stakeholder weights is followed by a presentation of the indicator results and interpretation of the regional comparisons.
4.1 Oresund Link results
3
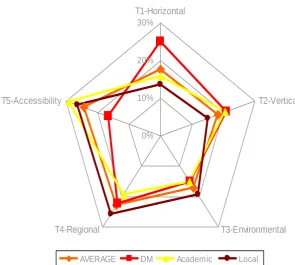
The weights derived from local practitioners, academics and senior decision makers using AHP surveys for each of the five equity types are presented in Figure 4 and were subsequently used in the construction of the composite indicator for each region. Figure 4 shows that accessibility was viewed as a main priority objective of this project, whereas environmental equity was among those with the lowest priority. These weights have been tested for robustness through stakeholder interviews and background literature.
Weights for equity types
0% 10% 20% 30% T1-Horizontal
T2-Vertical
T3-Environmental T4-Regional
T5-Accessibility
AVERAGE DM Academic Local
[image:17.595.121.417.189.454.2]
Figure 4: Weights for five equity types (T1 – T5) derived from the AHP survey.
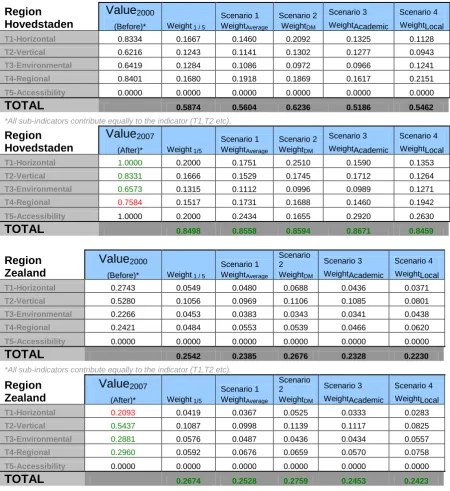
The weights arising from each of the three types of stakeholder (Decision Maker, Academic, Local) plus the overall average weight effectively form four alternative scenarios - relating to the different emphasis in objective preferences from each stakeholder type. The four scenarios were utilised to construct the composite indicator. These scenarios act as a basic sensitivity analysis on the weights used for the main scenario. Two illustrative examples are given by the neighbouring areas of Region Hovedstaden and Region Zealand in Denmark. The choice of calculation years of 2000 and 2007 represents, in essence, a comparison of the „before‟ and „after‟ case for each TEN-Ts.
Alternative scenarios show different magnitudes for the project impact on the overall equity objective. All impacts are positive as values have been normalised on a 0 to 1 scale.
Table 4: Ex-post analysis of weighted values for Regions Hovedstaden and Zealand.
Region Hovedstaden
Value
2000(Before)* Weight 1 / 5
Scenario 1 WeightAverage Scenario 2 WeightDM Scenario 3 WeightAcademic Scenario 4 WeightLocal
T1-Horizontal 0.8334 0.1667 0.1460 0.2092 0.1325 0.1128
T2-Vertical 0.6216 0.1243 0.1141 0.1302 0.1277 0.0943
T3-Environmental 0.6419 0.1284 0.1086 0.0972 0.0966 0.1241
T4-Regional 0.8401 0.1680 0.1918 0.1869 0.1617 0.2151
T5-Accessibility 0.0000 0.0000 0.0000 0.0000 0.0000 0.0000
TOTAL
0.5874 0.5604 0.6236 0.5186 0.5462*All sub-indicators contribute equally to the indicator (T1,T2 etc).
Region Hovedstaden
Value
2007(After)* Weight 1/5
Scenario 1 WeightAverage Scenario 2 WeightDM Scenario 3 WeightAcademic Scenario 4 WeightLocal
T1-Horizontal 1.0000 0.2000 0.1751 0.2510 0.1590 0.1353
T2-Vertical 0.8331 0.1666 0.1529 0.1745 0.1712 0.1264
T3-Environmental 0.6573 0.1315 0.1112 0.0996 0.0989 0.1271
T4-Regional 0.7584 0.1517 0.1731 0.1688 0.1460 0.1942
T5-Accessibility 1.0000 0.2000 0.2434 0.1655 0.2920 0.2630
TOTAL
0.8498 0.8558 0.8594 0.8671 0.8459Region Zealand
Value
2000(Before)* Weight 1 / 5
Scenario 1 WeightAverage Scenario 2 WeightDM Scenario 3 WeightAcademic Scenario 4 WeightLocal
T1-Horizontal 0.2743 0.0549 0.0480 0.0688 0.0436 0.0371
T2-Vertical 0.5280 0.1056 0.0969 0.1106 0.1085 0.0801
T3-Environmental 0.2266 0.0453 0.0383 0.0343 0.0341 0.0438
T4-Regional 0.2421 0.0484 0.0553 0.0539 0.0466 0.0620
T5-Accessibility 0.0000 0.0000 0.0000 0.0000 0.0000 0.0000
TOTAL
0.2542 0.2385 0.2676 0.2328 0.2230*All sub-indicators contribute equally to the indicator (T1,T2 etc).
Region Zealand
Value
2007(After)* Weight 1/5
Scenario 1 WeightAverage Scenario 2 WeightDM Scenario 3 WeightAcademic Scenario 4 WeightLocal
T1-Horizontal 0.2093 0.0419 0.0367 0.0525 0.0333 0.0283
T2-Vertical 0.5437 0.1087 0.0998 0.1139 0.1117 0.0825
T3-Environmental 0.2881 0.0576 0.0487 0.0436 0.0434 0.0557
T4-Regional 0.2960 0.0592 0.0676 0.0659 0.0570 0.0758
T5-Accessibility 0.0000 0.0000 0.0000 0.0000 0.0000 0.0000
TOTAL
0.2674 0.2528 0.2759 0.2453 0.2423A feature of SUMINI is the opportunity for stakeholders to assess whether any negative equity impacts result from the introduction of the scheme. This is reflected here in Table 4 by the decrease in the regional equity score for Region Hovedstaden from 0.8401 to 0.7854 in 2007 or in the horizontal equity score for Region Zealand from 0.2743 to 0.2093 (Table 4). This is of particular interest as it allows policy makers to consider directing additional funds or the development of relevant policies and schemes by way of response to the negative impact. Finally, by engaging a range of stakeholders in the decision making process with diverse priorities and therefore weights, the method offers an opportunity for more collaborative planning and deliberative democracy (Lowry 2010) without compromising accountability.
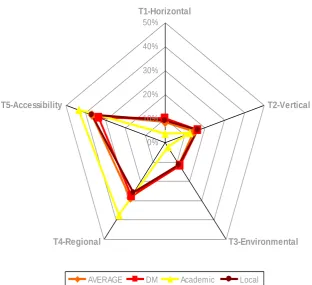
The Egnatia Motorway is a very different type of transport infrastructure to the Oresund Link, being a long motorway corridor passing through several regions and types of terrain. Accessibility also features as the top priority for stakeholders with this project, with regional equity also a major concern (Figure 5).
Weights for equity types
0% 10% 20% 30% 40% 50%
T1-Horizontal
T2-Vertical
T3-Environmental T4-Regional
T5-Accessibility
[image:19.595.146.459.182.467.2]AVERAGE DM Academic Local
Figure 5: Weights for five equity types (T1 – T5) derived from the AHP survey.
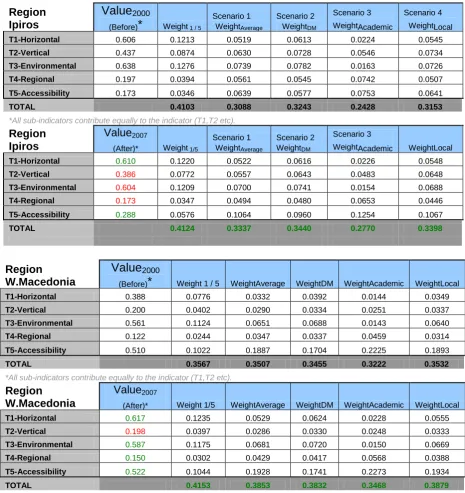
Using the stakeholder weights to provide the four priority scenarios, the composite indicator results for the NUTS-2 regions of Ipiros and W.Macedonia in Greece are shown in Table 6. It is noteworthy that for Ipiros there are reductions in particular equity types despite the overall equity indicator showing improvement. Environmental equity, for example, has decreased from a score of 0.638 to 0.604, whilst vertical equity from 0.437 to 0.386 (Table 6). This reflects a deterioration which took place following the operation of the Egnatia Motorway. Whilst it is debatable how much of this reduction can be firmly attributed to this particular infrastructure project, nonetheless this represents a useful finding for regional and national policy makers.
This outcome may be partly offset through the improvement in accessibility, as reflected by an increase in the score from 0.173 to 0.288 and which may be seen by stakeholders as compensatory for reductions in the other three equity types. Based on the initial priorities reflected in the weights (Figure 5), accessibility was the main objective of this project and this corresponds well with the actual findings (Table 5). Regional equity however appears to have decreased, which could attract further policy measures or additional projects to support this.
of other impacts, this particular region had an (unweighted) overall gain of 19% (Table 7). The values for all equity types have improved, and even the decrease of vertical equity in this region was marginal, from 0.200 to 0.198 (Table 5). The main benefits arise from horizontal equity due to improvements in the motorway network. This led to an increase in the level of business premises in the area and resulted in a positive impact on regional employment levels. Environmental equity and accessibility have also improved, from 0.561 to 0.587 and from 0.510 to 0.522 respectively (Table 5). The positive effect on environmental equity may be partially attributed on the additional measures and route changes which took place in the late 1990s following the ongoing initiatives of an environmental NGO, namely Arcturos (Georgiadis et al 2006).
[image:20.595.80.546.236.730.2],
Table 5: Ex-post analysis of weighted values for Ipiros (NUTS-2).
Region Ipiros
Value
2000(Before)
*
Weight 1 / 5Scenario 1 WeightAverage
Scenario 2 WeightDM
Scenario 3 WeightAcademic
Scenario 4 WeightLocal T1-Horizontal 0.606 0.1213 0.0519 0.0613 0.0224 0.0545 T2-Vertical 0.437 0.0874 0.0630 0.0728 0.0546 0.0734 T3-Environmental 0.638 0.1276 0.0739 0.0782 0.0163 0.0726 T4-Regional 0.197 0.0394 0.0561 0.0545 0.0742 0.0507 T5-Accessibility 0.173 0.0346 0.0639 0.0577 0.0753 0.0641 TOTAL 0.4103 0.3088 0.3243 0.2428 0.3153
*All sub-indicators contribute equally to the indicator (T1,T2 etc).
Region Ipiros
Value2007
(After)* Weight 1/5
Scenario 1 WeightAverage
Scenario 2 WeightDM
Scenario 3
WeightAcademic WeightLocal T1-Horizontal 0.610 0.1220 0.0522 0.0616 0.0226 0.0548 T2-Vertical 0.386 0.0772 0.0557 0.0643 0.0483 0.0648 T3-Environmental 0.604 0.1209 0.0700 0.0741 0.0154 0.0688 T4-Regional 0.173 0.0347 0.0494 0.0480 0.0653 0.0446 T5-Accessibility 0.288 0.0576 0.1064 0.0960 0.1254 0.1067 TOTAL 0.4124 0.3337 0.3440 0.2770 0.3398
Region W.Macedonia
Value
2000(Before)
*
Weight 1 / 5 WeightAverage WeightDM WeightAcademic WeightLocal T1-Horizontal 0.388 0.0776 0.0332 0.0392 0.0144 0.0349 T2-Vertical 0.200 0.0402 0.0290 0.0334 0.0251 0.0337 T3-Environmental 0.561 0.1124 0.0651 0.0688 0.0143 0.0640 T4-Regional 0.122 0.0244 0.0347 0.0337 0.0459 0.0314 T5-Accessibility 0.510 0.1022 0.1887 0.1704 0.2225 0.1893 TOTAL 0.3567 0.3507 0.3455 0.3222 0.3532*All sub-indicators contribute equally to the indicator (T1,T2 etc).
Region W.Macedonia
Value2007
(After)* Weight 1/5 WeightAverage WeightDM WeightAcademic WeightLocal T1-Horizontal 0.617 0.1235 0.0529 0.0624 0.0228 0.0555 T2-Vertical 0.198 0.0397 0.0286 0.0330 0.0248 0.0333 T3-Environmental 0.587 0.1175 0.0681 0.0720 0.0150 0.0669 T4-Regional 0.150 0.0302 0.0429 0.0417 0.0568 0.0388 T5-Accessibility 0.522 0.1044 0.1928 0.1741 0.2273 0.1934 TOTAL 0.4153 0.3853 0.3832 0.3468 0.3879
NUTS-2 and NUTS-3 level of analysis is seen in Table 7. From Table 7, whilst the NUTS-2 level analysis (ie for Ipiros) shows a decrease in the value of the aggregate indicator of 0.9%, at the more detailed NUTS-3 level (ie for Ioannina) a positive 3.5% benefit is seen. At NUTS-3 level the impacts are largely negative for both horizontal equity (from 0.505 to 0.473) and vertical equity (from 0.188 to 0.125), whilst there have been positive impacts for environmental equity (from 0.601 to 0.618) and regional equity (from 0.188 to 0.236) (Table 6). This was anticipated as Ioannina is emerging as a regional centre in western Greece. Accessibility has been significantly improved at both levels and the city of Ioannina can now be reached within around 2.5 hours from all major conurbations in W.Macedonia and Thessaloniki (C.Macedonia – NUTS-2). Almost twice as much travel time needed to reach the city before the Egnatia Motorway became operational.
Table 6: Ex-post analysis of weighted values for Ioannina (NUTS-3).
Value
2000(Before)
*
Weight 1 / 5 WeightAverage WeightDM WeightAcademic WeightLocal T1-Horizontal 0.505 0.1010 0.0433 0.0510 0.0187 0.0454 T2-Vertical 0.188 0.0376 0.0271 0.0313 0.0235 0.0316 T3-Environmental 0.601 0.1202 0.0696 0.0736 0.0153 0.0684 T4-Regional 0.188 0.0377 0.0537 0.0522 0.0711 0.0486 T5-Accessibility 0.173 0.0346 0.0639 0.0577 0.0753 0.0641 TOTAL 0.3312 0.2576 0.2659 0.2039 0.2581 [image:21.595.74.537.238.473.2] [image:21.595.90.501.627.780.2]*All sub-indicators contribute equally to the indicator (T1,T2 etc). Value2007
(After)* Weight 1/5 WeightAverage WeightDM WeightAcademic WeightLocal T1-Horizontal 0.473 0.0947 0.0406 0.0478 0.0175 0.0426 T2-Vertical 0.125 0.0250 0.0181 0.0208 0.0157 0.0210 T3-Environmental 0.618 0.1236 0.0716 0.0757 0.0158 0.0704 T4-Regional 0.236 0.0472 0.0672 0.0653 0.0889 0.0608 T5-Accessibility 0.288 0.0576 0.1064 0.0960 0.1254 0.1067 TOTAL 0.3482 0.3038 0.3058 0.2633 0.3014
It is useful to stress here the importance of AHP and the pairwise comparisons in deriving the weights for each equity type. Table 7 indicates the composite indicator outcome for the Egnatia Motorway calculated without decision makers‟ weights (stage 5 – Figure 2) ie as the normalised linear sum of all indicators. The difference can be seen by comparing the total average of Table 5 (e.g. from 0.3507 to 0.3853 for W.Macedonia based on the Average Weights scenario) with the total average of Table 6 for the same regions (e.g. from 0.4362 to 0.5191 for W.Macedonia). This highlights both the potential relevance and value of SUMINI for policy makers and other stakeholders as it turns weight attribution into a transparent process, avoiding deficiencies in previous methods (e.g. Khisty 1996).
Table 7: Composite indicator results for Egnatia Motorway (without weights)
Eastern Macedonia – Thraki (NUTS-2)
Before
After
Total sum 14.372 Total sum 15.638
Total average 0.3992 Total average 0.4344
Change: 8.81%
Central Macedonia (NUTS-2)
Before
After
Total sum 21.818 Total sum 21.483
Total average 0.6061 Total average 0.5968
Change: - 1.54%
Western Macedonia (NUTS-2)
Before
After
Total sum 13.523 Total sum 16.092
Total average 0.4362 Total average 0.5191
Ipiros (NUTS-2)
Before
After
Total sum 16.268 Total sum 16.121
Change: 19.00% Change: - 0.90%
Ioannina (NUTS-3)
Before
After
Total sum 13.684 Total sum 14.164
Total average 0.3910 Total average 0.4047
Change: 3.51%
5. Evaluation of SUMINI
The evaluation of SUMINI distinguishes between an assessment of the validity of the findings on the two TEN-T cases used for illustration and an assessment of the efficacy of the method itself.
5.1 Evaluation of the findings
Based on the presentation of the results (section 4) it is evident that SUMINI has the potential to provide stakeholders with values to compare the actual or projected outcomes (if used ex-ante) of a particular transport infrastructure project with respect to equity or other WEBs. The calculation of a summary value has a comparable role to a BCR value in CBA, but the method also offers the opportunity for stakeholders to have an instant and clear overview of which criteria or dimensions (e.g. equity types) have deteriorated. These may be targeted with further supportive action or policies in the future. The method is particularly useful to overcome the perception by stakeholders of CBA or other approaches as a „black box‟, offering clear information on trade-offs between impacts (Guehnemann 2010). In practice it is known that additional policy measures have already been taken, for example in Ipiros or W.Macedonia (section 4.2), to increase environmental equity as this motorway crosses a mountainous and environmentally sensitive area (Gerogiadis et al. 2006). This aligns with recent findings from other countries, where transport infrastructure has been found to contribute to the fragmentation of natural habitats or biodiversity (Mancebo Quintana et al. 2010).
Through the use of alternative weight scenarios (Tables 4 and 5), the implications of diverse stakeholder weights on different criteria has been illustrated, which in practice could also be uncertainty in the weights allocated by a single stakeholder. This addresses one of the main criticisms of MCA methods – that of arbitrary weights assignment (section 2). This is of particular relevance when project appraisal takes place at more than one level, namely regional, national and transnational. In that case it becomes possible to incorporate the views of stakeholders at different levels by using different weights. Those weights should be assigned at the beginning of the process though and through a transparent procedure in order to increase transparency and accountability between the different governance levels. Such practice would surpass „pork-barrel‟ politics, which sometimes promote infrastructure projects requiring high sunk costs (Proost et al. 2011).
As a result of the wide range of indicators included, SUMINI evaluates the outcomes without any direct interpretation of the source or cause of the impacts that are reflected by the scores. Deterioration on environmental equity in Ipiros for example, could originate from a range of underlying reasons with the Egnatia Motorway being just one cause. As with any post-hoc evaluation the SUMINI method reflects the impacts within a new „after‟ context and environment which will necessarily have changed from the „before‟ case. The clear separation of exogenous changes from changes that can be firmly attributed to the introduction of a new scheme is an issue that remains for appraisal by any method.
5.2 Comparison with CBA and overall evaluation of the methodology
5.2.1. Comparison with a CBA approach
Given the illustration of a new method to assess equity impacts, ideally a direct comparison of the methodological approach and numerical findings against an established procedure such as CBA would take place. However for the vast majority of TEN-T‟s – where the SUMINI approach has particular strengths in assessing equity – this is currently infeasible due to the limited extent of the ex-post and a-priori evaluations on TENT‟s undertaken to date. As a result it is only possible to compare the methodologies of SUMINI and CBA „in principle‟ and by qualitative critique.
Trans-European Transport Networks have been recently re-evaluated at an EU level (EC 2011b), demonstrating current interest in evaluation methodologies that reflect equity and wider impacts whilst also highlighting certain limitations in current practice. The need for ex-post analyses has been reinstated along with an observation that a formal assessment process should become compulsory for TEN-Ts. This has so far only been a requirement for projects funded through DG Regio. To date only 1 out of 54 schemes in the 2009 MAP call had a thorough ex-ante CBA (EC 2011c). The need for improvements in CBA has also been proposed in an attempt to address perceived limitations when assessing wider impacts. This has been described as a need to assess added value derived through new transport infrastructure projects.
The added value referred to includes the wider impacts and as illustrated in this paper, wider impacts are best represented through the types of indicators included in SUMINI, for example the location accessibility indicator, potential market indicator and daily accessibility indicator. The use of these indicators represents an improvement on current practice within CBA which has been primarily based on generalised transport costs and some further monetised impacts (HMT 2011). In specific evaluations this has included accessibility, but there are severe limitations on the ability to monetise many of the WEBs resulting in their exclusion from the CBA.
This illustration supports the proposition that SUMINI has the potential to complement CBA in assessing wider impacts. It also corresponds with the findings of Grant-Muller and Arsenio (2008) where it was stressed that Net Present Value on its own is not an accurate measure and it is essential to include both monetised indicators and those expressed in physical measures in the evaluation of a scheme. It will also then be possible to claim a more transparent decision making framework complementing CBA whilst addressing the gap highlighted by Phang (2003) and Proost et al. (2010).
5.2.2 Overall evaluation of the SUMINI method
The SUMINI method has been illustrated here through two TEN-T case studies but may also be applied at programme or policy levels (Giorgi and Tandon 2002), ie at a strategic level of assessment. As a result it is an approach with value in SEA implementation, especially where no set SEA framework currently exists (Sanchez and Silva-Sanchez 2008).
By operating in a hierarchical way (Figure 2), SUMINI offers both a structure and the relevant context to stakeholders through the pairwise comparisons (stages 4 and 5 – Figure 2). This is an appealing way to link theory with practice which may be lacking in other methods and is also effective where stakeholders may have a limited understanding of the overall procedure. SUMINI provides an operational overview of equity theories when considering the equity principle to use in project assessment (section 3) and this feature has been confirmed as benefit for decision makers Tsolakis et al. (2005).
At a higher level, SUMINI presents stakeholders with the option to assign zero weights to WEBs criteria or dimensions (e.g. equity types) which appear to be not relevant for a particular project, based on the broader policy objectives (stage 3 – Figure 2). This results in a flexible appraisal framework which utilises only the most relevant and appropriate information for each situation. Of course it is acknowledged that any generalisations from the case studies used for illustration here may be precarious. This is due to the relatively low (but sufficient) number of participant stakeholders in the AHP survey – mainly in the Oresund Link case study – due to the elapsed time since the opening of the project. It is only through conducting further case study research (Flybjerg 2006) on the equity impacts of transport infrastructure projects that knowledge on this issue will progress, however, due to the unique nature of such projects (Feitelson 2002; Weinstein and Sciarra 2006).
Evaluating the flexibility of SUMINI further, it may not always be appropriate to incorporate the views of each stakeholder on the same equal basis as they have different roles and interests in the decision making process. Usually the decision making authority has (and should have) the largest weight. However the approach adopted in this paper is that stakeholder participation should be increased for large infrastructure projects, therefore all views should be treated equally (egalitarian approach). This does not imply that stakeholders should replace the decision maker. As SUMINI is a decision aid methodology, it should be kept as flexible and open as possible. Depending on the participation in the AHP survey and institutional role of stakeholders, it is possible to use different weights for their views to explicitly indicate the role of the decision maker. This would improve current practice regarding weight assignment e.g. in England, the Green Book Guidelines (HMT 2011). Nonetheless, it is of interest to report and evaluate the different weights used by stakeholders in different countries as well as at different levels of decision making.