This is a repository copy of The influence of feed rate on process damping in milling:
Modelling and experiments.
White Rose Research Online URL for this paper:
http://eprints.whiterose.ac.uk/11062/
Article:
Sims, N.D. and Turner, S. (2011) The influence of feed rate on process damping in milling:
Modelling and experiments. Proceedings of the Institution of Mechanical Engineers, Part
B, Journal of Engineering Manufacture, 225 (6). pp. 799-810. ISSN 0954-4054
doi: 10.1243/09544054JEM2141
[email protected] https://eprints.whiterose.ac.uk/ Reuse
Unless indicated otherwise, fulltext items are protected by copyright with all rights reserved. The copyright exception in section 29 of the Copyright, Designs and Patents Act 1988 allows the making of a single copy solely for the purpose of non-commercial research or private study within the limits of fair dealing. The publisher or other rights-holder may allow further reproduction and re-use of this version - refer to the White Rose Research Online record for this item. Where records identify the publisher as the copyright holder, users can verify any specific terms of use on the publisher’s website.
Takedown
If you consider content in White Rose Research Online to be in breach of UK law, please notify us by
http://pib.sagepub.com/
Manufacture
Engineers, Part B: Journal of Engineering
http://pib.sagepub.com/content/225/6/799
The online version of this article can be found at:
DOI: 10.1243/09544054JEM2141
2011 225: 799
Proceedings of the Institution of Mechanical Engineers, Part B: Journal of Engineering Manufacture
N D Sims and M S Turner
The influence of feed rate on process damping in milling: modelling and experiments
Published by:
http://www.sagepublications.com
On behalf of:
Institution of Mechanical Engineers
can be found at:
Manufacture
Proceedings of the Institution of Mechanical Engineers, Part B: Journal of Engineering
Additional services and information for
http://pib.sagepub.com/cgi/alerts
Email Alerts:
http://pib.sagepub.com/subscriptions
Subscriptions:
http://www.sagepub.com/journalsReprints.nav
Reprints:
http://www.sagepub.com/journalsPermissions.nav
Permissions:
http://pib.sagepub.com/content/225/6/799.refs.html
Citations:
What is This?
- Jul 21, 2011
Version of Record
The influence of feed rate on process damping in milling:
modelling and experiments
N D Sims1* andM S Turner2
1Department of Mechanical Engineering, University of Sheffield, Sheffield, UK 2
Advanced Manufacturing Research Centre with Boeing, University of Sheffield, Advanced Manufacturing Park, Rotherham, UK
The manuscript was received on 30 April 2010 and was accepted after revision for publication on 22 July 2010.
DOI: 10.1243/09544054JEM2141
Abstract: The performance of milling operations is limited by the onset of unstable self-excited vibrations known as regenerative chatter. Over the past few decades there has been a great deal of research to help predict and explain regenerative chatter. Consequently, high-speed milling operations are now frequently employed, with judicious choice of spindle speeds and depths of cut so as to avoid chatter whilst maintaining high productivity. However, many materials that are increasingly used in aerospace components are difficult to machine at high spindle speeds because of their thermal properties. Examples include titanium and nickel alloys. For these materials, low-speed machining must be employed, and in this regime the role of regenerative chatter is less clearly understood due to the phenomenon of process damping.
In the present study, a time domain model of process damping is developed. This model is used to explore the relationship between cutting conditions and the amplitude of chatter vibrations. A qualitative agreement is found between experimental behaviour and the numerical model. In particular, the model predicts a strong relationship between the workpiece feed rate (expressed as a feed per tooth), and the acceptable chatter stability defined by the process damping wave-length. Further work is needed to properly calibrate some of the model parameters.
Keywords: milling chatter, process damping, time domain modelling, regenerative chatter
1 INTRODUCTION
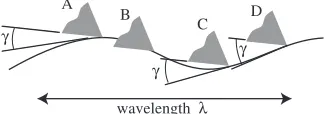
It is well known that at low spindle speeds the stability of milling operations is enhanced by the phenome-non known as process damping. The concept of pro-cess damping was first conceived by Tobias and Fishwick [1], who argued that the rubbing between the flank face and just-cut surface resulted in forces that damped the self-excited vibration. Tlusty [2] illustrated this concept schematically as shown in Fig. 1. Here, it can be seen that there is a greater potential for tool/flank interference when the tool is
at location ‘B’ on the wavy surface. This results in a force that is out of phase with the vibration velocity, giving rise to a damping effect.
Despite this early contribution, research into mill-ing chatter stability has largely focused on high-spindle-speed scenarios, and process damping remains one of the least-understood aspects of machining [3]. This is partly due to the prevalence of aluminium alloy components in the aerospace industries, which can be machined with high produc-tivity by using high surface speeds. However, recent trends towards exotic materials such as titanium and nickel alloys have resulted in machining scenarios that cannot involve high spindle or surface speeds, due to the thermal and hardness characteristics of these materials. Consequently, there is now a greater
*Corresponding author: Department of Mechanical Engineering, University of Sheffield, Mappin St, Sheffield S1 3JD, UK. email: [email protected]
need to understand and utilize the phenomenon of process damping in milling.
The present contribution aims to demonstrate the application of the conceptual model proposed by Tobias and Fishwick [1] to a time domain simula-tion of low radial immersion milling. A qualitative comparison is then made with a series of mill-ing experiments that were performed under similar conditions to the model. It is shown that increasing the tool feed rate enhances the process damping effect in both the experiment and the simulation, and that the process-damped vibrations exhibit limit-cycle behaviour rather than the theoretical sta-bility associated with non-process damped chatter-free cutting.
The remainder of this paper is organized as follows. First, relevant research on process damping in milling is briefly reviewed to justify the originality of the present contribution. Next, the time domain modelling procedure is explained in detail, before describing the experimental tests that were per-formed. Following a discussion, some conclusions are drawn and recommendations for further work are made.
2 LITERATURE REVIEW
Before considering research that has focused on pro-cess damping concepts, it is useful to briefly mention some of the recent developments concerning the modelling of stability prediction and analysis. Of par-ticular relevance is the work of Mann et al. [4], who used techniques from non-linear dynamics (once-per-period sampling, and Poincare´ sections) to ana-lyses numerical and experimental data. The focus of their work, however, was the chatter vibrations that occur at very low radial immersions, rather than the behaviour at low spindle speeds. Other recent activity has also focused on the behaviour at low radial immersion: for example Insperger’s semi-discretiza-tion approach [5–9]. This concept has more recently been extended to consider variable helix tools [10]
and runout [11]. The issue of tool runout was also considered by reference [12].
Previous investigations into process-damped machining have focused on various aspects. Since the present study focuses purely on milling, earlier work regarding process damping in turning (or other material removal processes) will not be consid-ered. Furthermore, for the sake of brevity this section will be restricted to those studies that have included a significant modelling aspect.
Early work on the mechanics of chip formation used a complex coefficient to relate cutting force to instantaneous chip thickness [13,14]. The real part of this coefficient accounted for the forces in phase with the instantaneous chip thickness, whereas the imag-inary part accounted for the out-of-phase forces. Tlusty [15] attributed the process-damping (i.e. out-of-phase) forces to the flank interference and chang-ing relief angle shown in Fig. 1. This figure is also useful for visualizing the so-called process-damping wavelength c. Since chatter vibration is often assumed to be sinusoidal, the chatter frequency fc
can be related to the wavelength of vibrationsby
¼v fc
ð1Þ
v¼D n
60 ð2Þ
Here,vis the surface speed of the tool compared to the workpiece, n is the spindle speed, and D the tool diameter (in milling). At low spindle speeds, chatter stability becomes almost independent of the axial depth of cut. The corresponding wavelength
is often referred to as the process-damping wave-lengthc.
Whilst this earlier work was useful for illustrating conceptual mechanisms for process damping, more recent studies have resorted to time domain simula-tions so that non-linear effects can be properly inves-tigated. Montgomery and Altintas [16] attempted to include process-damping forces in a model of mill-ing. It seems that this model did not fully consider the surface waviness on the process damping forces, and more recent work by Campomanes and Altintas [17] has focused on developing advanced models of higher speed milling.
Wu [18,19] developed a model of ploughing forces during milling, assuming a rounded tool and a sinu-soidal chip thickness variation. Force predictions were presented but the analysis stopped short of assessing the effect of the ploughing forces on chatter and tool wear. Elbestawi et al. [20] modified this approach to consider a wear flat on the tool and investigate the chatter stability. They showed an increase in stability with increasing length of wear A
B
C D
γ
wavelength λ
γ
γ
[image:4.595.74.236.91.148.2]flat, and some correlation between model and exper-iment at three selected spindle speeds. Endreset al. [21,22] developed a model of the ploughing mecha-nism that assumed a rounded tool but, unlike Wu’s method, performed numerical integration to calcu-late the flank penetration volume. They used an empirical method to determine the penetration depth, and investigated the effect of the rake angle and the chip thickness, but did not consider chatter stabilization effects.
One of the issues faced by Wu and Endres was that in assuming that the tool has a rounded edge (as may be the case in practice), there is no longer a finite tool tip that can be used to define the depth of cut and the flank penetration. Waldorfet al. [23] investigated this issue by comparing theoreti-cal predictions from two ploughing models with experimental behaviour. They found that it is more appropriate to model the rounded tool tip with a stable built-up edge attached, so that the tool can be thought of as having a chamfer. However, this work did not consider the effect of flank penetration that may occur during chatter.
Ranganath et al. [24] implemented a similar numerical method to Endres, to calculate the inter-ference volume for a sharp tool, thereby avoiding the problems when a rounded tool is considered. Their method incorporated the time domain milling model developed by Sutherland [25], which calcu-lates the location of the tool centre at each simu-lation time step. The chip thickness calcusimu-lation simplifies the geometry of the cutting kinematics, and so the approach is less accurate than that adopted by Campomanes and Altintas [17]. Al-though Ranganath’s work used a numerical integra-tion routine, no convergence study was menintegra-tioned, and in the corresponding thesis [26] the problems of simulating very flexible structures were resolved by including additional damping terms in the model. The study did not determine the process damping wavelength that is commonly used to indicate the low-speed stability region. Furthermore, the tests were performed using aluminium at spindle speeds of at least 1000 r/min, making the study less relevant to current problems involving low-speed machining of titanium alloys.
More recently Huang and Wang [27] proposed a semi-analytical model that considered the dynami-cally changing angles of the ploughing and shearing forces during cutting. A matrix of empirical coeffi-cients was used to characterize the process-damping forces, which were assumed to be functions of the direction of relative motion between tool and work-piece. Rahnamaet al. [28] developed a model speci-fically for micro-milling, where the spindle speeds
tend to be considerably higher and the feed rate con-siderably lower than in conventional milling.
To summarize, there have been a number of attempts to model the forces that occur during mill-ing at low spindle speeds, based upon the original conceptual theory proposed over 50 years ago. Some of these models have focused on the forces aris-ing due to physical interference between the tool and workpiece, whilst other work has investigated the consequence of a changing relief and rake angle on the dynamic cutting forces [27]. Perhaps the most comprehensive work involving the former method is that described in the PhD thesis of Ranganath (see Ranganath et al. [24]). The aim of the present study is to complement and extend Ranganath’s approach, as follows:
. implement a workpiece/tool flank interference model based upon the surface discretization meth-odology proposed by Campomanes and Altintas [17] and implemented by Sims [29];
. following a convergence study, utilize the model at an appropriately small numerical time step to ensure stable and steady-state predictions of cut-ting forces and displacements;
. qualitatively compare the model predictions to experimental data involving the very-low-speed machining of a titanium alloy;
. compare the process damping wavelength pre-dicted from both the model and the experiment.
In the next section, the milling model will be described.
3 MODEL FORMULATION
The model used in the present study is an extension of that described by Sims [29], and this modelling approach will now be summarized.
The model is formulated in a Simulink environ-ment, and consists of three aspects: milling kine-matics, milling forces, and system dynamics. The kinematics model begins by dividing the tool intonl
discrete axial slices or layers, and calculating the tool and workpiece geometry within each slice. Two co-ordinate systems are used: a radial coco-ordinate based upon the centre of the tool with angles taken relative to the feed direction, and a Cartesian coordinate system based upon the workpiece feed direction. The relative displacement of the workpiece and tool (accounting for feed rate and vibration effects) are provided as inputs to the calculation. The basis of the computation is the manipulation of a set of arrays of Cartesian coordinates (one array for each tooth on each axial slice) that define the surface of
the workpiece that was produced by that tooth. The array length represents a complete revolution of the tooth; therefore with each tooth revolution the array values are overwritten, or updated. For each time step in the simulation, the following calculations are repeated for each tooth on each axial slice.
1. The position of the tooth is calculated based upon the current simulation time, and the spindle speed. 2. The workpiece surface array for the present tooth is
updated.
3. The instantaneous chip thickness for the present tooth is calculated, based upon the current tooth position and the surface array for the preceding tooth.
4. The geometrical interference between the tool flank and just-cut surface is calculated.
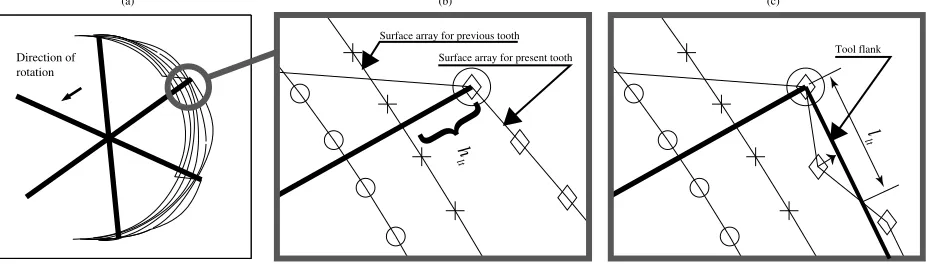
The calculations required for step (3) can be described with reference to Fig. 2. At this instanta-neous point in time, the chip thicknesshltcan be
cal-culated based upon the current tooth position and the workpiece surface coordinates representing the surface from the previous tooth pass. This is demon-strated in more detail in Fig. 3, which shows the data points stored in the workpiece surface arrays for each tooth. The chip thickness is calculated based upon these surface arrays and the position of the tooth tip (Fig. 3(b)). The flank contact or interference between the just-cut surface and the current position of the tool is then determined based upon the relief angle g (Fig. 3(c)). The maximum allowable con-tact length is the flank length lflank. In the present
study, the length of contact llt was used to
calcu-late the cutting forces that arise due to process damp-ing. Furthermore, the workpiece material that has been penetrated by the flank surface is assumed
to plastically deform so that it follows the flank surface.
Having calculated the chip thickness and work-piece/flank contact, the cutting forces are then calcu-lated as follows. As with many previous publications, the cutting forces due to the mechanics of chip gen-eration are given by
frclt ¼
b nl
KrchltþKre
ð Þ
ftclt ¼
b nl
KtchltþKte
ð Þ
ð3Þ
Here, b is the axial depth of cut and nl is the
number of axial layers used in the simulation. With reference to Fig. 2,frclt is the cutting force due to the
chip mechanics acting in the radial direction of the tooth, for layerland tootht. Likewise,ftclt is the
cut-ting force due to the chip mechanics accut-ting in the tangential direction of the tooth, for layer l and tooth t. The coefficients Krc and Ktc are the widely
used cutting force coefficients that must be empiri-cally obtained for a particular workpiece and (often) a particular tool. The edge or rubbing force coeffi-cients Kre and Kte are also included in the model
formulation, but for simplicity they are initially assumed to be zero.
Meanwhile, in the present study the process damp-ing forces are assumed to be given by
fnplt ¼Knpllt
b nl
ffplt ¼Knpllt
b nl
ð4Þ
With reference to Fig. 2,fnpltis the cutting force due to
process damping, acting in the direction normal to
Tool center
hlt
x feed direction of tool
relative to workpiece
surface from previous tooth pass
y
tool rotation n rev/min
lflank γ
llt f
fplt f
tclt f
rclt f
nplt
surface from current tooth pass
[image:6.595.117.460.562.758.2]the flank face, for layerland tootht. Meanwhile,ffpltis a friction force acting in a perpendicular direction. Equation (4) has introduced two new variables: the
process damping normal force coefficientKnp, and a
corresponding coefficient of friction.
It is straightforward to resolve the above-mentioned
forces into componentsfxltandfyltacting in thex- and
y-directions respectively. The total forces acting on
the tool in thex- andy-directions can then be
deter-mined as
Fx¼
Xnl
l¼1
Xnt
t¼1
fxlt ð5Þ
Fy¼
X
nl
l¼1
Xnt
t¼1
fylt ð6Þ
wherentis the number of teeth on the tool. Note that
during the calculation of the milling kinematics, teeth that are not engaged in the workpiece (due to their angular position, or due to the advent of severe chat-ter) have zero chip thickness and hence zero cutting force.
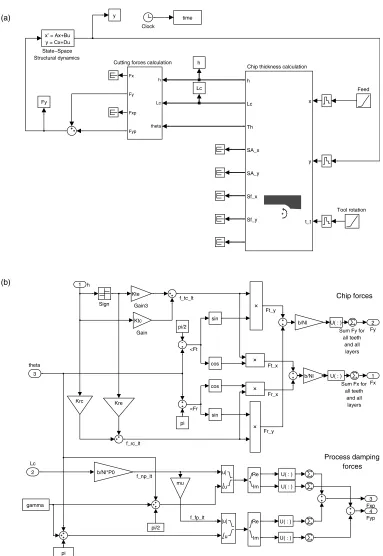
Having calculated the total forces acting on the tool, the corresponding displacement can be obtained by modelling the structural dynamics of the flexible tool. These displacements are then fed back to the milling kinematics model. The resulting Simulink model is shown in Fig. 4. Here, the cutting force calculation (Fig. 4(b)) is implemented as a subsystem of standard Simulink blocks, whereas the more complex kinemat-ics model is implemented as a C program that inter-faces with Simulink via the s-function/mex-file syntax
[30]. With reference to Fig. 4(a), in the present study a
single mode of vibration was considered in the y
-direction. In practice this can be readily extended to consider multiple degrees of freedom and coupled
dynamics between thex- andy-directions.
Once the Simulink model was finalized, computa-tional effort was reduced by compiling the model as a C program executable. This also enabled multiple simulation runs to be performed on a cluster of desk-top PCs. Further details of this procedure are given in Simset al. [31].
4 EXPERIMENTAL SETUP
A series of milling experiments were performed so that model results could be qualitatively compared with the experimental data. Experiments were per-formed on a Mori Seiki SV500 vertical machining centre, using a 16 mm diameter solid carbide tool with four teeth, a 6.6 degree rake angle, 6 degree relief angle, and 30 degree helix angle, to machine a titanium Ti-6-Al-4V workpiece. The experimental parameters are summarized in Table 1. Here, the
maximum chip thickness hmax is a function of the
feed per toothft, radial immersionae, and tool
diam-eterD, as follows
hmax ¼ft
ffiffiffiffiffiffiffiffiffiffiffiffiffiffiffiffiffiffiffiffiffiffiffiffiffiffiffiffiffi
4ae
D
2ae
D
2
s
ð7Þ
Low radial and high axial depths of cut were used to minimize damage in the event of severe chatter. During the experimental cut, the spindle speed was gradually increased in increments, whilst maintain-ing a constant feed per tooth. The tool vibration was
Direction of rotation
}
h lt
Surface array for present tooth Surface array for previous tooth
Tool flank
l lt
(a) (b) (c)
Fig. 3 Simulation of chip thickness for a tool with six teeth. Close-up (b) shows how the chip
thickness hltis calculated based upon the intersection of two lines. One line is line from
the present tooth’s position to the tool centre, and the other line is the segment of the workpiece surface array for the previous tooth. Close-up (c) shows a scenario where tool
flank/workpiece interference has occurred. The contact length llt is calculated from the
intersection of two lines. One line represents the flank face of the tool, and the other line is the relevant segment of the workpiece surface array for the present tooth. If the workpiece is assumed to plastically deform, then any workpiece surface array elements within the interference zone are moved radially outwards as shown by the arrow
[image:7.595.78.541.539.671.2](a)
Tool rotation y
Lc time
Fy
h State−Space
Structural dynamics x’ = Ax+Bu y = Cx+Du
Feed Cutting forces calculation
h
Lc
theta Fx
Fy
Fxp
Fyp
Clock
Chip thickness calculation
h
Lc
Th
SA_x
SA_y
Sf_x
Sf_y
x
y
t_t
(b)
Chip forces
Process damping forces
Fyp 4 Fxp
3 Fy
2
Fx 1 sin
cos
sin cos
U( : ) Sum Fy for
all teeth and all layers
Sum Fx for all teeth
and all layers Sign
U( : ) U( : ) U( : ) U( : )
U( : )
|u|
u |u|
u mu
b/Nl*P0 Kre Krc
Gain3 Kte
b/Nl
b/Nl Gain
Ktc
pi
pi/2 gamma
pi pi/2
Re
Im Re
Im theta
3
Lc 2
h 1
<Fr <Ft
Ft_x
Fr_x
f_rc_lt
Fr_y Ft_y f_tc_lt
f_fp_lt f_np_lt
Fig. 4 Simulink model for process damped milling: (a) main simulink system; (b) ‘Cutting forces
[image:8.595.97.480.80.636.2]calculation’ subsystem. The ‘Chip thickness calculation’ subsystem is implemented as a C program with approximately 600 lines of code to calculate the chip thickness and contact length as illustrated in Fig. 3
Table 1 Experimental parameters
Parameter Test 1 Test 2 Test 3 Test 4
Maximum chip thicknesshmax(mm) 0.03 0.05 0.07 0.1
Radial immersionae(mm) 1 1 1 1
[image:8.595.36.540.725.774.2]monitored using a microphone so that after the cut the spindle speed at which chatter occurred could be determined along with the corresponding chatter
fre-quencyfc. From this the process damping wavelength
could then be determined using equation (2) and equation (1). This procedure was then repeated for
different values of maximum chip thicknesshmax.
5 RESULTS
In this section, some typical simulation results are first presented to demonstrate model performance, justify some of the modelling parameter choices, and propose methods for analysing the simulation data. Then, comparisons are drawn between simu-lated and experimental data.
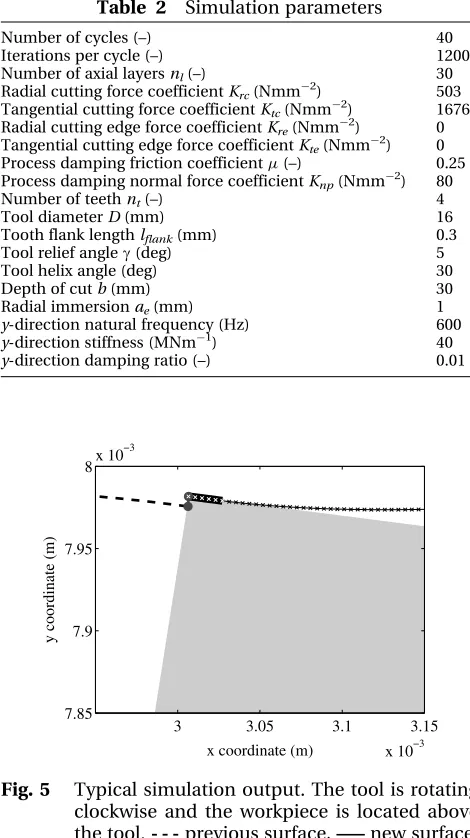
The simulation parameters are summarized in Table 2. It can be seen that the number of time steps per cycle or revolution of the tool is very high compared with previous studies on high-speed
mill-ing [29]. This is justified with reference to Fig. 5, which
shows an example of the simulated tool and work-piece for one instance in time. It should be re-iterated that the data shown in Fig. 5 represent one tool and one axial slice in the simulation. Close inspection of Fig. 5 reveals that at this point in time the length of contact between the tool flank and workpiece is
approximately 20mm. With a tool diameter of
16 mm and 12 000 time steps per tool revolution (Table 2), this contact length is represented by six dis-crete data points in the array of surface coordinates. Clearly the high number of time steps per revolution (or small step size) is needed to achieve an accurate representation of this contact region.
This small time step has a negative impact on the simulation’s computation time. However, two other factors influence this computation time, namely the
number of axial slicesnl, and the number of simulated
revolutions. Using a high number of axial slices is important because this improves the accuracy with which the tool’s flutes are represented. This has a significant effect on the amplitude of the forced vibra-tions, which become smoother as more axial slices are used. In the present study, 30 axial slices were used. Meanwhile, the 40 revolutions of the tool were used to ensure that the simulation had reached a steady-state condition. As a result each simulation took approxi-mately 30 minutes to compute on a desktop PC.
In Fig. 6, the dynamic response of the model is illus-trated by plotting the simulated tool displacement versus the simulated tool velocity (i.e. the phase trajectory). At a very low depth of cut (Fig. 6(a)), the phase trajectory indicates that with each cycle or revolution there are many oscillations of the tool. This is because the natural frequency of the tool (600 Hz) is
considerably higher than the spindle speed. Also shown in Fig. 6(a) are square markers corresponding to the vibration sampled at the tooth passing frequency (i.e. once per tooth samples). It can be seen that the markers are all superimposed, indicating that with each revolution of the tool the vibration has returned to its previous state. This represents a stable response from a non-linear dynamics perspective, or a chatter-free cut from a machining perspective.
Fig. 6(b) shows a quite different pattern of behav-iour when the depth of cut is increased to 30 mm. Here, there are still a high number of tool oscillations per revolution, but the vibration magnitude is higher, and the once/tooth samples do not converge to one position. From a non-linear dynamics perspective,
x coordinate (m)
y coordinate (m)
3 3.05 3.1 3.15
x 10−3 7.85
7.9 7.95
8x 10 −3
Fig. 5 Typical simulation output. The tool is rotating
clockwise and the workpiece is located above
the tool.- - -previous surface,–—new surface,
#contact region,-chip thickness. ‘x’
[image:9.595.321.556.92.511.2]mar-kers indicate discrete coordinates representing the just-cut surface for the current tool
Table 2 Simulation parameters
Number of cycles (–) 40
Iterations per cycle (–) 12000
Number of axial layersnl(–) 30
Radial cutting force coefficientKrc(Nmm2) 503
Tangential cutting force coefficientKtc(Nmm2) 1676
Radial cutting edge force coefficientKre(Nmm2) 0
Tangential cutting edge force coefficientKte(Nmm2) 0
Process damping friction coefficient(–) 0.25 Process damping normal force coefficientKnp(Nmm2) 80
Number of teethnt(–) 4
Tool diameterD(mm) 16
Tooth flank lengthlflank(mm) 0.3
Tool relief angleg(deg) 5
Tool helix angle (deg) 30
Depth of cutb(mm) 30
Radial immersionae(mm) 1
y-direction natural frequency (Hz) 600
y-direction stiffness (MNm1
) 40
y-direction damping ratio (–) 0.01
[image:9.595.320.561.101.282.2]the system would be said to be unstable due to the occurrence of a Hopf bifurcation leading to quasi-periodic motion. However, from a practical machin-ing perspective the magnitude of this ‘unstable’ behaviour may not be sufficient for it to be described as ‘chatter’. Consequently, the output from the numerical simulation is not straightforward to ana-lyse in terms of chatter stability.
In the present study this issue is overcome using the following analysis procedure. First, the simulated displacement for the last tool revolution is de-trended to remove the DC component. Next, the root-mean-square value is obtained. This ‘AC r.m.s. vibration amplitude’ is a useful indicator of the vibration because:
1. it can readily distinguish between the low ampli-tude stable vibration shown in Fig. 6(a), and the limit cycle behaviour shown in Fig. 6(b);
2. it is insensitive to the DC or mean cutting forces/ displacements which are modified by the maxi-mum chip thickness;
3. it is a similar measure to the audio measurement used in the experimental procedure, but more ame-nable to automated processing; this is because it does not require the tooth passing frequency (and its harmonics) to be filtered out of the signal.
Before implementing this analysis approach, the influence of the modelled process damping mechan-ics on the amplitude of the response will be consid-ered. Repeating the simulation shown in Fig. 6(b)
without process damping effects caused a catas-trophic failure of the simulation within the first
few revolutions. This is because the chatter vibration became so severe that its magnitude was greater than the surface speed of the tool, causing the array of sur-face coordinates to rotate in a clockwise direction (i.e. opposite to the tool rotation). The model relies upon interpolation between these data points, and they are assumed to proceed in a clockwise sense. Consequently the model fails. This failure is because the only non-linearity that inhibits linear instability (i.e. exponential and unbounded growth of vibration) is the tool loss of contact. Including process damping in the model provides an additional energy dissipa-tion mechanism that limits the vibradissipa-tion amplitude. This is further illustrated in Fig. 7 which shows that the process-damping forces are always dissipative (i.e. opposing the velocity of the motion). This agrees with the original notion of process damping
proposed in early work [1].
Having illustrated the role of process damping in limiting the magnitude of the machining vibrations, a range of machining parameters will now be investi-gated so as to generate simulated data under similar conditions to the machining experiments. The simu-lation was repeated for four different feed rates cor-responding to maximum chip thicknesses of 30,
50, 75, and 100mm (as for the experiments). For
each feed rate, 140 simulations were performed for different spindle speeds between 210 and 500 r/min. This required approximately 12 days of computation time. For each simulated response the AC r.m.s. vibration level was calculated using the steps described above. The results are summarized in Fig. 8. Having accounted for the increased static
Fig. 6 Phase portrait at 326 r/min and maximum chip thickness of 0.03 mm. (a) 0.3 mm depth cut;
(b) 30 mm depth cut. —— Phase trajectory. —— Phase trajectory, last cycle.hOnce/tooth
[image:10.595.122.457.88.290.2]forces and deflections due to increasing the feed rate, it is clear that higher feed rates have actually resulted in a reductionin the response level. In other words, more process damping is achieved by increasing the feed per tooth or maximum chip thickness. A second interesting feature of Fig. 8 is that the vibration ampli-tude fluctuates in a seemingly erratic fashion as the spindle speed is changed.
This fluctuation is explained with reference to
Fig. 9. Here, the data for hmax¼75mm are repeated
(right-hand axis), with a calculation of the chatter
vibration wavelength superimposed (left-hand
axis). This calculation was performed by first obtain-ing the chatter frequency from a Fourier analysis of the last four tool revolutions, and then using
equa-tion (2) and equaequa-tion (1) to determine. Fig. 9 shows
that the chatter vibration wavelength increases in dis-crete steps as the spindle speed is increased. These steps coincide with the fluctuations observed in the vibration amplitude. Multiplying the reciprocal of the chatter wavelength by the circumferential
dis-tance between adjacent teeth on the tool (pD/4 for a
tool with four teeth) gives the number of complete waves per tooth pass. In high-speed milling this is normally referred to as the ‘lobe number’. For the data shown in Fig. 9, the lobe number varies
from approximately 50 (at 200 r/min) to approxi-mately 25 (at 500 r/min). Consequently the fluc-tuations in vibration magnitude are all associated with constant lobe numbers, and so they are a result of the increasing phase difference between cur-rent and previous surface waves.
It should be pointed out that the preceding analysis has assumed that the cutting-edge force coefficients,
KreandKte, are both zero. In practice these empirical
coefficients could have a notable effect on the vibra-tion amplitudes. This issue is explored in Fig. 10, where one simulation scenario is repeated for differ-ent values of the edge force coefficidiffer-ents (which are assumed to be equal to each other). It can be seen that the edge force coefficients do have a significant effect on the vibration amplitude, and so clearly they need to be properly calibrated in future work.
[image:11.595.62.288.86.202.2]Having explained the main features of the model predictions, it is now appropriate to attempt to com-pare the model predictions with the experimental data. To recap, the experiments were performed by slowly incrementing the spindle speed – and hence the vibration wavelength – until the vibration magni-tude exceeded a threshold value. For this situation,
Fig. 10 Effect of cutting-edge force coefficients on
vibration amplitude. Spindle speed 300 r/min,
hmax¼75m
200 250 300 350 400 450 500 10
15 20 25
Spindle speed (rev/min)
A C R M S v ib ra ti o n le v el (r m s µ m )
hmax= 30µm
hmax= 50µm
hmax= 75µm
hmax= 100µm
Fig. 8 Effect of spindle speed and feed rate on
vibra-tion amplitude 0.2 0.3 0.4 0.5 0.6 0.7 C h a tt er w a v el en g th (m m )
200 250 300 350 400 450 5005 10 15 A C R M S V ib rat ion am p li tu d e (r m s µ m )
Spindle speed (rev/min)
Fig. 9 Effect of spindle speed on vibration amplitude
and chatter wavelength.hmax¼75mm
−0.1 −0.08 −0.06 −0.04 −0.02 0 0.02 0.04 0.06 0.08 0.1 −300 −250 −200 −150 −100 −50 0 Velocity (m/s)
Process damping force (N)
Fig. 7 Process-damping forces versus velocity for the
example shown in Fig. 6(b)
[image:11.595.319.556.87.207.2] [image:11.595.322.555.273.408.2] [image:11.595.64.287.277.396.2]the chatter vibration frequency was determined and the corresponding wavelength (the process-damping
wavelength c) calculated. The same procedure can
be employed using the simulated data shown in Fig. 8. However, the experimental data used a thresh-old for a filtered audio signal measurement. Clearly this threshold cannot be used for the simulated data which uses a different analysis procedure. To
over-come this issue, an arbitrary threshold of 12mm
r.m.s. amplitude is chosen for the simulation data, and only a qualitative comparison is made with the
experimental data. With reference to Fig. 9, the 12mm
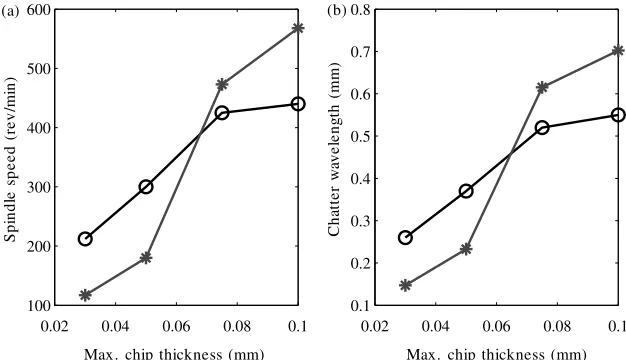
threshold is exceeded for spindle speeds greater than 425 r/min, corresponding to a chatter wave-length of 0.52 mm. This wavewave-length is therefore the process-damping wavelength for this value of maxi-mum chip thickness. Repeating this procedure for the other values of maximum chip thickness leads to the results illustrated in Fig. 11.
6 DISCUSSION
The results that have been presented clearly show some promise in terms of the model’s ability to rep-resent experimentally observed behaviour. However, a number of issues are worthy of further discussion.
Most notably, it should be re-iterated that the pro-cess damping parameters used in the present study were neither formally calibrated, nor based directly upon underlying physical material properties. This clearly limits the applicability of the model results, and for this reason it should be re-iterated that only a qualitative comparison has been made with the experimental data. To make this comparison as fair
as possible, the remaining model parameters were chosen to match the experiments. For example, iden-tical cutting scenarios were used (depth and width of cut, tool geometry, and empirical cutting force
coef-ficientsKrcandKtc). However, the cutting edge force
coefficients,Kreand Kte were not comparable and a
separate set of simulations has demonstrated that they have notable influence on the simulated vibra-tion amplitude. Consequently they should be prop-erly considered in future work. To aid the analysis of the model results, the model was constrained to only
allow vibration in one direction (they-direction), with
a single mode of vibration. However, this mode of vibration was chosen to closely match the experimen-tally observed chatter frequency (around 600 Hz), which was associated with a mode of vibration of
the machine’s spindle [32].
The model parameters which were arbitrarily chosen were the process damping normal force
coef-ficientKnpand the corresponding friction coefficient
. In addition, the model assumed that the normal
force was proportional to the flank/workpiece con-tact area (rather than concon-tact volume), and that this material in contact was plastically deformed so that it followed the profile of the tool flank. In fact the model formulation is compatible with either volume- or area-based coefficients, and either plastic or elastic deformation of the contacting material. Further work is needed to develop informed values for these settings.
One possible approach to this would be to perform more detailed modelling of the chip mechanics (dis-regarding the self-excited vibration and other dy-namic behaviour), using finite element techniques. This could indicate appropriate values for the process
0.02 0.04 0.06 0.08 0.1
100 200 300 400 500 600
Max. chip thickness (mm)
S
p
in
d
le
sp
eed
(r
ev
/m
in
)
(a)
0.02 0.04 0.06 0.08 0.1
0.1 0.2 0.3 0.4 0.5 0.6 0.7 0.8
Max. chip thickness (mm)
C
h
at
te
r
w
av
e
le
n
gt
h
(m
m
)
[image:12.595.130.443.554.734.2](b)
Fig. 11 Comparison between model predictions and experimental data. (a) Spindle speed at which
process damping no longer suppresses chatter; (b) corresponding vibration wavelength.
damping force coefficients (as functions of volume or area). Such models would also indicate whether plas-tic or elasplas-tic deformation is the best assumption.
An alternative approach would be to configure and calibrate the model based upon empirical data from machining experiments. This procedure is already widely employed to choose the cutting force coeffi-cients. However, calibration of the process-damping coefficients would be more complex due to the higher number of parameters and the difficulty of obtaining appropriate experimental data in the presence of measurement noise. For example, the process-damping forces depicted in Fig. 7 involve frequencies equal to the chatter frequency and its harmonics. These frequencies can be quite high in practice, making the forces more difficult to measure using a milling dynamometer. It is for these reasons that the present study has focused on illustrating that similar trends are observed in both the model and the exper-iment, instead of devoting effort to the calibration of the model parameters.
Another aspect of the model which requires atten-tion is the consideraatten-tion of tool geometry such as wear flats on the flank, and tool edge sharpness. Including these characteristics will certainly influ-ence the contact region between the tool flank and the workpiece. In principle the model can be readily extended to include such geometrical features. However, this would also increase the complexity of the experimental calibration activity, since these aspects of tool geometry cannot be directly controlled during experimental machining.
Despite these issues, the overriding feature of the model is that it is able to predict similar trends to those observed experimentally: a strong rela-tionship between feed per tooth and process damp-ing wavelength.
7 CONCLUSIONS
The present study has described the implementation of a time domain model of milling chatter that con-siders process damping forces due to interference between the tool flank and the just-cut workpiece surface. The model predicts the following behaviour.
. At low spindle speeds, process-damping forces limit the amplitude of self-excited vibration arising due to regenerative chatter. The stability of the motion is not completely stabilized, but rather the resulting amplitude is sufficiently low for a cor-responding experiment (in the presence of mea-surement noise and other unmodelled effects) to have been deemed ‘stable’.
. The process damping forces are in phase with the velocity of the motion, leading to an energy dissipation mechanism as proposed by early research [1].
. The resulting motion is strongly influenced by the relative phase angle between current and previous workpiece surfaces.
. The amplitude of the motion rises substantially as the spindle speed is increased. This is in agreement with experimental observations under similar conditions.
. Using a threshold-based approach to defining the acceptable chatter stability, qualitatively similar behaviour was found in the model and experimen-tal tests. In particular, it was shown that the pro-cess damping wavelength increased as the feed per tooth, or maximum chip thickness, was increased.
Finally, further work is needed to properly calibrate the model parameters based upon either empirical data or detailed modelling of the chip mechanics.
ACKNOWLEDGEMENT
The authors are grateful for the support of the EPSRC through grant reference EP/D052696/1.
ßAuthors 2011
REFERENCES
1 Tobias, S. A.andFishwick, W.Theory of regenerative machine tool chatter.The Engineer, 1958, 199–203. 2 Tlusty, J. Manufacturing processes and equipment,
1999 (Prentice-Hall, Englewood Cliffs, New Jersey). 3 Altintas, Y.andWeck, M. Chatter stability of metal
cutting and grinding. CIRP Annals – Manuf. Technol., 2004,53(2), 619–642.
4 Mann, B. P., Bayly, P. V., Davies, M. A.,andHalley, J. E. Limit cycles, bifurcations, and accuracy of the milling process. J. Sound Vibr., 2004, 277(1-2), 31–48. doi: dx.doi.org/10.1016/j.jsv.2003.08.040. 5 Insperger, T. and Stepan, G. Semi-discretization
method for delayed systems.Int. J. Numer. Methods Engng, 2002,55(5), 503–518.
6 Mann, B. P., Insperger, T., Bayly, P. V.,andStepan, G. Stability of up-milling and down-milling, part 2: experimental verification.Int. J. Mach. Tools Manuf., 2003, 43(1), 35–40. doi: 10.1016/S0890-6955(02)00 160-8.
7 Insperger, T., Mann, B. P., Stepan, G., and Bayly, P. V. Stability of up-milling and down-milling, part 1: alternative analytical methods.Int. J. Mach. Tools Manuf., 2003, 43(1), 25–34. doi: 10.1016/S0890-6955(02)00159-1.
8 Insperger, T.andStepan, G.Updated semi-discreti-zation method for periodic delay-differential equa-tions with discrete delay. Int. J. Numer. Methods Engng., 2004,61(1), 117.
9 Insperger, T.Full-discretization and semi-discreti-zation for milling stability prediction: Some com-ments. Int. J. Mach. Tools Manuf., 2010, 50(7), 658–662. doi: dx.doi.org/10.1016/j.ijmachtools. 2010.03.010.
10 Sims, N. D., Mann, B.,andHuyanan, S.Analytical prediction of chatter stability for variable pitch and variable helix milling tools. J. Sound Vibr., 2008, 317(3-5), 664–686. doi: 10.1016/j.jsv.2008.03.045. 11 Wan, M., Zhang, W.-H., Dang, J.-W.,andYang, Y.A
unified stability prediction method for milling pro-cess with multiple delays.Int. J. Mach. Tools Manuf., 2010, 50(1), 29–41. doi: dx.doi.org/10.1016/ j.ijmachtools.2009.09.009.
12 Diez Cifuentes, E., Pe´rez Garcı´a, H., Guzma´n Villasen˜ or, M., and Viza´n Idoipe, A. Dynamic analysis of runout correction in milling. Int. J. Mach. Tools Manuf., 2010, 50(8), 709–717. ISSN 0890-6955. DOI: 10.1016/j.ijmachtools.2010.04.010. 13 Das, M. K.andTobias, S. A.The relation between the
static and the dynamic cutting of metals.Mach. Tool Design Res., 1967,7, 63–89.
14 Wallace, P. W. and Andrew, C. Machining forces: some effects of removing a wavy surface. J. Mech. Engng Sci., 1966,8(2), 129.
15 Tlusty, J.Analysis of the state of research in cutting dynamics.CIRP Annals, 1978,27(2), 582–589. 16 Montgomery, D.andAltintas, Y.Mechanism of
cut-ting force and surface generation in dynamic milling.
J. Engng Industry, 1991,113, 160–168.
17 Campomanes, M. L.andAltintas, Y.An improved time domain simulation for dynamic milling at small radial immersions.J. Manuf. Sci. Engng., 2003,125, 416–422.
18 Wu, D. W. Application of a comprehensive dynamic cutting force model to orthogonal wave-generating processes.Int. J. Mech. Sci., 1988,30(8), 581–600.
19 Wu, D. W.A new approach of formulating the trans-fer function for dynamic cutting processes.J. Engng Industry, 1989,111, 37–47.
20 Elbestawi, M. A., Ismail, F., Du, R.,andUllagaddi, B. C. Modelling machining dynamics including damping in the tool–workpiece interface. J. Engng Industry, Trans. ASME, 1994,116(4), 435–439.
21 Endres, W. J., DeVor, R. E.,andKapoor, S. G. Dual-mechanism approach to the prediction of machining forces. Part 1: Model development.J. Engng Industry, 1995,117(4), 526–533.
22 Endres, W. J., DeVor, R. E.,andKapoor, S. G. Dual-mechanism approach to the prediction of machining forces. Part 2: Calibration and validation. J. Engng Industry, 1995,117(4), 534–541.
23 Waldorf, D. J., DeVor, R. E.,andKapoor, S. G.An evaluation of ploughing models for orthogonal machining.J. Manuf. Sci. Engng., 1999,121, 550–558. 24 Ranganath, S., Narayanan, K., and Sutherland, J. W. The role of flank face interference in improving the accuracy of dynamic force predic-tions in peripheral milling. J. Manuf. Sci. Engng., 1999, 121(4), 593–599.
25 Sutherland, J. W. A dynamic model of the cutting force system in the end milling process. InSensors and Controls for Manufacturing, PED-Vol. 33, 1988, pp. 53–62.
26 Ranganath, S.A comprehensive model for dynamic force prediction in peripheral milling including the effects of flank face interference. PhD Thesis,
Department of Mechanical Engineering and Engineering Mechanics, Michigan Technological University, 1999.
27 Huang, C. Y.andWang, J. J. J.Mechanistic modeling of process damping in peripheral milling.J. Manuf. Sci. Engng, Trans. ASME, 2007,129(1), 12–20. 28 Rahnama, R., Sajjadi, M.,and Park, S. S. Chatter
suppression in micro end milling with process damping.J. Mater. Process. Technol., 2009,209(17), 5766–5776.
29 Sims, N. D.The self-excitation damping ratio: a chat-ter crichat-terion for time-domain milling simulations.
J. Manuf. Sci. Engng, 2005,127(3), 433–445. 30 MatlabWriting s-functions.2004.
31 Sims, N. D., Turner, M. S.,andRidgway, K.A model of milling dynamics using Matlab and Simulink. In Proceedings of the 9th CIRP International Workshop on modeling of machining operations
(Eds I. Grabec and E. Govekar), 2006 (University of Ljubljana, Bled, Slovenia).