www.drink-water-eng-sci.net/7/1/2014/ doi:10.5194/dwes-7-1-2014
©Author(s) 2014. CC Attribution 3.0 License.
Drinking Water
Engineering and Science Open Access
Online data processing for proactive UK water
distribution network operation
J. Machell1, S. R. Mounce1, B. Farley1, and J. B. Boxall1
1Pennine Water Group, University of Sheffield, Civil and Structural Engineering, Mappin Street,
Sheffield S1 3JD, UK
Correspondence to: J. Machell (j.machell@sheffield.ac.uk)
Received: 5 August 2013 – Published in Drink. Water Eng. Sci. Discuss.: 28 August 2013 Revised: 21 February 2014 – Accepted: 18 March 2014 – Published:
Abstract. Operational benefits and efficiencies generated using prevalent water industry methods and tech-niques are becoming more difficult to achieve; as demonstrated by English and Welsh water companies’ static position with regards the economic level of leakage. Water companies are often unaware of network incidents such as burst pipes or low pressure events until they are reported by customers; and therefore use reactive strategies to manage the effects of these events. It is apparent that new approaches need to be identified and ap-plied to promote proactive network management if potential operational productivity and standards of service improvements are to be realised.
This paper describes how measured flow and pressure data from instrumentation deployed in a UK water distribution network was automatically gathered, checked, analysed and presented using recently developed techniques to generate apposite information about network performance. The work demonstrated that these technologies can provide early warning, and hence additional time to that previously available, thereby creating opportunity to proactively manage a network; for example to minimise the negative impact on standards of customer service caused by unplanned events such as burst pipes.
Each method, applied individually, demonstrated improvement on current industry processes. Combined application resulted in further improvements; including quicker and more localised burst main location. Future possibilities are explored, from which a vision of seamless integration between such technologies emerges to enable proactive management of distribution network events.
1 Introduction
Internationally it is becoming difficult to improve upon the effectiveness and efficiency of network operations such as leakage management because the limits of current techniques are being reached. The English and Welsh regulator Ofwat concluded that all but two water companies have reached an economic level of leakage (Pearson and Trow, 2005) using traditional techniques (House of Lords, 2006). Consequently, there is a need for water companies to be more innovative. The technology required to fully understand, manage, and automate distribution network operation either does not yet exist, is only partially evolved, or has not yet been proven re-liable and cost effective for live networks. New technologies and asset management techniques therefore need to be
ex-plored if knowledge and understanding of water distribution, and customer service, is to be improved.
2 Opportunity and case study
2.1 Opportunity
Flow and pressure instrumentation has evolved over many years, and highly robust and accurate offthe shelf designs are readily available. The current placement of instrumenta-tion in water distribuinstrumenta-tion networks in the UK is to meet the requirement to monitor and report leakage and low pressure; but measurement locations are not always the most sensitive for this purpose. Automated techniques have therefore been developed to identify these optimal locations (Perez et al., 2009, 2011; Farley et al., 2008, 2010a, b; Rosich et al., 2012; Preis et al., 2011; Goulet et al., 2013) and continue to be im-proved.
Until recently, the UK water industry norm for data collec-tion from distribucollec-tion network instrumentacollec-tion was via man-ual methods carried out during site visits, often only once a month or even less frequently. One reason for infrequent data collection was cost; data transfer via telephone systems being particularly prohibitive in the past. However, as data gather-ing and communication technologies steadily improved they became less expensive to own and operate, and water com-panies began to automate data collection. Data capture rate remained the same, but transfer to central storage was typi-cally increased to once every 24 h. Instrument communica-tion and data transfer is now tending to shift positively to-wards more advanced General Packet Radio Service (GPRS) or low power radio hopping solutions, with some vendors providing support for the widely used Internet Protocol (IP). For the work reported here, GPRS technologies were em-ployed which enabled the change from data downloads once every 24 h, to once every 30 min; 48 times more frequent than previously. This higher frequency flow and pressure data en-ables network performance to be analysed in a short time scale previously not possible. Rapid detection of burst pipe and low pressure events allows proactive management of their effects thereby minimising water loss and standards of service failures.
Despite these improvements, some fractions of water use, for example much domestic and small business consumption, remain estimated. The next generations of instruments and communication technologies will make data collection and transfer more efficient and cost effective; even from remote sites. Wireless, m-bus, z-wave, Wi-Fi, EDGE, 4G & 5G, and data analytic techniques are in continuous development, and have the potential to further revolutionise the way water companies gather and hence analyse and use data. Also, in the future, technologies such as Automated Meter Reading (AMR), or Advanced Metering Infrastructure (AMI), will al-low water companies to gather high frequency consumption data directly from residential and commercial customers as well as existing sites. This will remove the need to estimate components of leakage calculations, and flow or demand in hydraulic modelling applications; and provide a far better
understanding of distribution network flow and pressure dy-namics.
Data analytical tools are also evolving rapidly. The need to efficiently manage and analyse increasing numbers of data streams has spawned numerous techniques, many new to the water industry (Srirangarajan et al., 2010; Zan et al., 2011; Romano et al., 2013; Michalak et al., 2012). Artificial intelligence and network hydraulic simulation methods are able to automatically verify, process, and continually analyse large amounts of data. They convert data into information and present it in a time frame completely impossible using manual or semi-automatic systems (Gama, 2010; Preis et al., 2012, Machell et al., 2010).
This study took the opportunity to apply several state of the art methods to a single case study; as individual tech-niques and then in combination.
2.2 Case study
The water company collaborating in this work had recently implemented a remote communication/data transfer evalua-tion project in a complex distribuevalua-tion network that was de-fined by a number of interconnected District Metered areas (DMAs). A DMA is a hydraulically bounded area within a distribution network that typically contains 500–5000 cus-tomer properties. The hydraulic operation of the network was not well understood, and relative performance measures such as leakage per property were high; providing significant chal-lenge. The project involved the installation of 490 data log-gers to gather data from DMA inlet flow meters, and pres-sure meapres-surements from incorporated transducers. Flow and pressure data was sampled at 15 min intervals. Measurements were also taken at 1 min intervals from some locations to de-termine whether a higher data resolution could provide any useful extra information. The loggers were equipped with a GSM modem and were, at the time, unique in the industry in that they communicated via GPRS and transferred data to a mobile telephony provider’s data centre. 2 measurements, 15 min apart, were transferred from each instrument every 30 min. From there, the data was relayed to the water com-pany via a high speed broadband connection known as a pipeline, into a central data store.
Access to the water company’s project study area, instru-mentation and data, provided an ideal opportunity to apply and evaluate the methods used in this work. An overview of the individual state of the art for these methods is now pre-sented.
3 Overview of the state of the art techniques applied
3.1 Instrument location & DMA subdivision
and reasonably indicative location to monitor pressure. How-ever, a monitoring location may also be selected because of a history of known low pressure events in a specific area of a network. In the UK, this pressure monitoring location is commonly known as the DG2 point, and is primarily used to report against the regulatory minimum pressure levels of service requirement. The current approach does not necessar-ily identify the most sensitive location for detecting pressure fluctuations. If the most sensitive locations were determined, more fluctuations and events would be detected and aware-ness of system performance increased; for example, more burst pipes can be identified, and more accurate estimates of the number of customers suffering low pressure, over what duration, can be determined. A method to identify optimal lo-cations for pressure instruments used for detection and loca-tion of leak/burst events was developed by Farley et al. (2008, 2010a, b). The approach utilised a methodology that searches a Jacobian sensitivity matrix produced by sequentially mod-elling leak/burst events at all nodes in a 1-D hydraulic model, and evaluating the change in pressure response at all possi-ble instrument locations. The matrix was then searched (fo-cussing on detection) to maximise overall system sensitiv-ity and to minimise the number of instruments required in a given network; or where appropriate, to complement existing instrumentation to increase detection sensitivity.
To validate the approach, a number of pressure instru-ments where deployed in selected DMAs and a series of burst events were simulated by opening a number of fire hydrants inside DMAs. Data was collected from the pressure instru-ments located inside each DMA, including the current DG2 location, and at the most sensitive (or optimal) location pre-viously identified by a Jacobean matrix approach. Analysis of pressure measurements recorded before, during, and af-ter the burst events were used to evaluate the sensitivity of each instrument location to the pressure changes caused by the simulated burst events (Farley et al., 2010a). Figure 1 shows model predicted, and actual sensitivities for 5 simu-lated bursts at eight instrumentation points in a single DMA highlighting the correlation between predicted (model) and actual (real) sensitivities. Predictions were made using typ-ical UK industry standard hydraulic models with no addi-tional calibration.
From Fig. 1 it is clear that hydraulic models can be used to accurately predict pressure changes caused by burst mains, and can therefore be applied to support the optimal location methodology. Additional analysis of the data demonstrated that data from optimally located pressure instrument(s) can be used to detect more low pressure and leak/burst events within a DMA than data from current DG2 locations, and how to selectively supplement existing instrumentation to improve detection.
[image:3.595.312.547.62.207.2]The methodology to identify the most sensitive locations for instruments can be extended to provide event location in-formation. Further work (Farley et al., 2013) explored an ap-proach to search the Jacobian sensitivity matrix to provide
Figure 1.Model predicted vs. actual data sensitivity (for looped DMA).
differential location information, requiring the integration of a Genetic Algorithm (GA) search routine to improve effi -ciency. Single, and multiple, optimally (providing selected levels of overlapping or different zones of sensitivity) lo-cated instruments can be selected to identify sub-areas within a DMA, without the need for network reconfiguration or closed valves. This method has great potential, not only for detecting new leaks/burst events, but also steering leak loca-tion efforts.
3.2 Data quality and checking
If maximum benefit is to be obtained from investment in col-lecting large volumes of data, management, storage and ac-cess to both current and historical data sets is required.
The distribution network flow and pressure data quality gathered for this study can generally be classed as “dirty”. Dirty data is manifest as large chunks of missing, corrupt or out of range values from faulty loggers and/or the presence of erroneous date and time stamps. A methodology for deal-ing with these issues was developed as an integral part of the online Artificial Intelligence (AI) system (Sect. 3.3) in or-der to more easily manage large amounts of data of varying quality. Data checking included statistical tests for stationar-ity (Mounce et al., 2010).
7-Technology’s data warehouse product, Data Manager, was used in this study to pre-process and make data accessi-ble to the Automated Data Analysis system (AI system) and online hydraulic models described later. Data Manager was used to perform the following functions:
– Receive flow, pressure and service reservoir level data
– Perform checks and conversions on the data received
(using a pre-processor) and data emulation where mea-sured data was not available for some reason
– Make the pre-processed data available for online AI
sys-tem analysis and hydraulic simulations (historical and current)
– Automatically create and back up a database of historic
flow and pressure data
Pre-processing involved automatic data checks for missing or corrupt data and/or data values that fell outside a normal value distribution at each instrument location. This was done using either absolute values or rate of change of values in the data time series. Where a data check failed, error messages were created and, if required, data emulation was performed. Emulation was used to replace missing or corrupt data with a fixed or an average value for the measurement site or, by reference to another site that usually has very similar time series values. In this way, Data Manager was configured to interface the real network measured values with its equiva-lent in an online AI system (Sect. 3.3) and hydraulic models; the latter used the data as boundary conditions for simula-tions (Sect. 3.4).
Data quality was a significant issue especially when ob-taining long period time series. The quality and continuity of data is essential for online modelling and AI systems. Al-though a hydraulic model can deal with missing data using substituted values, as the number of substitutions increases the accuracy of the model decreases and, eventually, a point is reached where the resultant error is so large simulation re-sults cannot be relied on to be fit for purpose.
3.3 Automated data analysis for burst detection
The challenge of timely data analysis can be met using au-tomated computation methods. Event detection algorithms work by obtaining data, performing some analysis and then returning outputs such as probabilities or fuzzy values. These are then processed into a binary classification i.e. gener-ate an alarm or not. Despite some software offering profile alarm levels, there has been very little application to date in the water industry. Existing state of the art systems use flat line alarm thresholds for key measurement sites, which are then continuously monitored to enable identification of large bursts. The collaborating water company established and im-plemented site specific high and low thresholds for DMA in-let flow and pressure flat line alarms, to provide simple data analysis of absolute, individual values. At the time, imple-menting these flat line alarms was a significant move forward for detecting network events and represented a step change in awareness of network hydraulic performance. In particular, they proved useful for detecting sudden catastrophic bursts, and acting as a failsafe. However, due to continual adjust-ment of alarm level settings over time the flat-line system started to generate a high number of false alarms (ghosts) that did not correlate with any known events, also many pipe bursts were still not detected and no action was taken. A sig-nificant issue with flat-line alarm thresholds is the trade-off
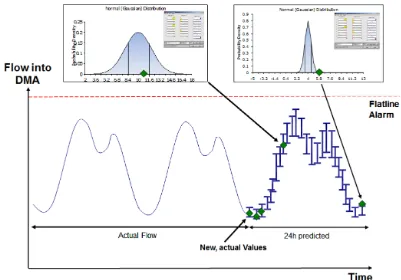
between false alarms (alarms with no identifiable cause) and non-detection of smaller burst events. Although this is an is-sue for all event detection systems, it is more significant for flat lines where the level has often been set arbitrarily, with-out any of the positive aspects of data driven methodologies. More sophisticated data analysis methodologies using Ar-tificial Neural Network (ANN) and Fuzzy Logic (FL) tech-nology were therefore applied. Recorded flow and pressure data from each measurement location was sorted by DMA name and stored in a database. Assembled data sets which passed data quality checks were first pre-processed to deal with any missing data using well proven time series analy-sis techniques for filling, then normalised by re-scaling to a range required by the ANN, and finally restructured into the format required by the analysis system. A single model was used for each data stream. The pre-processed data sets were used to train a Mixture Density Network (MDN) ANN to make time series predictions based on a lag of past time se-ries values. Importantly, this prediction was not a particular value; the MDN architecture learns the distribution (through a mixture model) for a particular instrument from past data, and assigns a confidence level to the observed flow val-ues. A Fuzzy Inference System (FIS), consisting of a set of fuzzy rules, analysed this mixture model and the observed value over a suitable time window and generated classifica-tion fuzzy values (an indicaclassifica-tion of abnormal events such as burst pipes) such that a % confidence could be assigned to alerts and, in addition, an accurate estimate of likely burst size could be determined. Figure 2 shows how this continu-ally updated model constructs the probability density at time steps into the future horizon.
The algorithms and software employed, as well as further background on system integration, are described in more de-tail in Mounce et al. (2003) and Mounce et al. (2010). Ab-normal classifications by the FIS were entered into an alerts database, and automated email alerts were sent to the water company’s control room staff.
Figure 2.Mixture model for future flow prediction and fuzzy interpretation.
Their classifications are shown in Fig. 3. The class “abnor-mal” includes all cases where the AI system produced an alarm, and subsequent manual data interpretation confirmed that a noteworthy change in the data stream did occur, but for which there was no correlation with mains repairs or customer contacts i.e. the result of an unknown cause that did not fall into one of the other 5 (normal) categories that correlated with a known causes. The signature of some of these abnormal events such as large industrial demands, or closure and opening of valves, could not necessarily be dif-ferentiated from that of bursts using the AI analysis system. However, their detection was still of significant interest to the water company in that it provided important operational information that was previously undetected. Unexpected or unlicensed water use such as for the filling of private fire tanks, increased industrial use for new processes, unautho-rised filling of street cleaning equipment and water bowsers, or illegal connections, can all generate abnormal flow events and are all activities that water service providers need to be made aware of if proactive management and control of the network is to be realised. Detections can also be produced by network rezoning activities, changes to valve arrangements or pump schedules and other operational scenarios, thereby providing an additional check of the timing, magnitude and effect of such activities. This information is particularly im-portant when such activities have been outsourced to third party contractors.
From Fig. 3 it can be seen that during the period of analy-sis a good correlation was found between the AI system gen-erated alerts and company WMS/customer contact informa-tion. This was very good for flow where 95 % of flow alerts corresponded to WMS/contact information or known engi-neered events with only 5 % ghosts. The pressure data anal-ysis was found to produce more ghosts (38 %), which was expected based on previous work and other researcher’s find-ings which highlight the non-stationary nature of the pressure profile over time (Mounce et al., 2011, Ye and Fenner, 2010).
3.4 Combination of optimal location and automated analysis technology
Figure 3.3-month summary of AI flow and pressure alerts (January to March).
5 of the 6 blind tests were conducted in 4 different DMAs that had additional (optimally located) pressure instrument(s) installed. Results confirmed that the methodology developed to divide a DMA into a number of sub-zones to reduce the search area and improve burst location worked well. The cor-rect sub area within each DMA in which a simulated burst occurred was correctly identified. 3 out of the 5 blind tests produced exact agreement between the model simulated and actual instrument responses; and therefore the correct zone of the burst event could be identified (Farley et al., 2012). In the other 2 DMAs, factors beyond the control of the method, such as instrumentation or logger failure, prevented this.
A successful example result of how pressure instruments can be deployed to provide sub-DMA event location is shown in Fig. 4.
For the case shown in Fig. 4, alerts for the DMA inlet flow meter and DG2 pressure instrument were generated, but not for the additional pressure instrument in the yellow (verti-cal lined) sub-zone. The pressure instrument at the inlet also did not detect the event, as predicted by the methodology. By reference to the DMA sub-zone sensitivity matrix, it was confirmed that this combination of alerts correctly identi-fied that the hydrant flush had occurred in the blue (hori-zontal lined) sub-zone, hence demonstrating how this com-bination of event detection and optimal location can provide sub-DMA location. Field tests also demonstrated the poten-tial for application of the method to multiple DMAs, and that subdivision of DMAs with very differing characteristics was possible. A reduction in search area was achieved for all but one DMA. The number of zones the DMAs were di-vided into was dependent on their individual characteristics. Results suggested that subdivision of typical DMAs into 4 zones can be achieved through the deployment of only one additional pressure instrument.
An extension of optimal instrument location approaches could be the creation of monitoring areas without the need for closed valves; virtual DMAs. This would enable more open systems with less dead-ends and the inferred water quality issues.
3.5 Online modelling
Aquis, supplied by 7-Technologies A/S, Denmark, was used to build and develop several hydraulic models for 1-D
application. These models were used to populate the Ja-cobean sensitivity matrices for instrument location methods (Sect. 3.1), and to present network flow and pressure infor-mation superimposed on a street map background showing network assets and customer properties. Measured flow and pressure inputs and model simulation outputs were used to generate alarms and warnings when flow(s) or pressure(s) anywhere in a network and/or at specific network locations moved outside normal operational values.
A hydraulic network model is most useful when it displays up to date information and, ideally, predictions for the next few hours. The former is governed by the age of available in-put data. The latter can be achieved by simulation and extrap-olation of current state using inbuilt predicted and normalised patterns for non-measured demand components. When mea-sured data is regularly streamed into a model to set sim-ulation boundary conditions the model is termed “online”. Online model boundary conditions are continually updated with the most recent data available; in this case the data was 30 min old. An online model is not constrained by fixed (his-toric) 24 h flow and pressure profiles used as boundary con-ditions in conventional extended period simulation models. This means that non-diurnal flow and pressure patterns are accounted for and reflected in simulation output.
A 2 DMA model was built and used to demonstrate the effects of changes in network flow and pressure on customers during a real network event when a hydrant was opened by unknown persons in one of the study DMAs (Machell et al., 2010). The effects of changes in flow and pressure could be viewed as they rippled through the network.
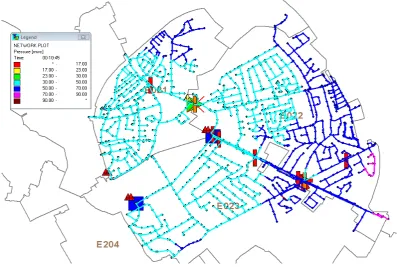
A 3 DMA model was used for the evaluation of the opti-mal pressure instrument number and location methodology and provided flow, pressure, and velocity results for GIS vi-sualisation. Figure 5 shows the extent of this model on a GIS display with results overlaid showing the pressure in each pipe in the network. The time shown in the legend of Fig. 5 is arbitrary. The legend is fully populated to be fully explicit with regard to what is presented in the figure.
Figure 4.Sub-DMA location of blind event in the pilot area (after Farley et al., 2012).
Figure 5.3 DMA online model showing pressure in pipes at 10:45 GMT.
at the inlets and outlets of 16 DMAs, 4 service reservoirs, 2 pumping stations and a number of DG2 pressure monitors provided boundary condition data for this model. Data Man-ager pre-processed raw data from these sites and passed it to the model. This model was used to support the DMA subdivi-sion work and instrument/AI system tests (Sect. 3.4) and test alarm and warning functionality of the modelling system.
Pressure data was found to be extremely useful for the on-line modelling system. It was a powerful resource for model calibration and fault finding, and was used to generate alarms for low or unnecessarily high pressure detections.
Availabil-ity of a stream of continuously updating flow and pressure data enabled calibration to current, rather than historic mea-surements, and to make it a continuous and iterative process, reflecting ever changing dynamics in the network caused, for example, by changes to valve positions, the timing of pump operations or the turnover rate of service reservoirs.
[image:7.595.98.496.272.539.2]corrupt/missing data, unexpected flows or pressures, and pump failure for example. It can also generate warnings when flow or pressure is persistently moving towards an alarm situation. This enables fast response and proactive ac-tion to minimise the effect on customers.
On-line simulation of a water distribution network pro-vides a tool that can offer tangible and significant operational benefits for network managers. It allows network operators to progress beyond the reactive and develop a proactive ap-proach to network management. For example, the prelimi-nary effects of a burst main can be detected at an early stage which, in turn, can allow the operators to minimize the later effects and sometimes pre-empt and avoid many standards of service failures by manipulating valves, providing an alterna-tive supply or making other appropriate operational change. Pressure effects on every pipe in a network can be captured to gather knowledge about which customers were affected by an event and for how long – a UK standards of service reporting requirement. With optimally located instrumentation, online models provide a visual overview of all flows and pressures across an entire network. Online models can be used to gen-erate timely warnings of unusual flow and pressure events. They can monitor for persistent changes such as slow but continuous reduction in pressure. Then, in combination with the specialised detection and analysis of the AI system, can be used to help to locate burst pipes and unusual network flow and pressure events.
3.6 Data sampling rate
The unofficial UK industry standard for the temporal resolu-tion of flow and pressure data, at most locaresolu-tions, is 15 min (Mounce et al., 2012). To some extent the use of 15 min hy-draulic data is pragmatic (storage space of loggers and re-ceiving systems), but it also reflects a trade-offbetween the volume of information collected and the detail of flow or pressure fluctuations that can be captured. A good represen-tation of the overall dynamics within a network can be ob-served with fifteen minute data, although the shape and am-plitude of pressure transients cannot be resolved with data points more than a tenth of a second apart. Higher frequency sampling potentially also allows component analysis in or-der to gain an unor-derstanding of the different contributions to the total flow from different types of demand such as do-mestic and industrial, or flow due to leakage. However, little published work has investigated the benefit of using logging intervals in the sub-fifteen minute range. Data sample rates of 1, 5 and 15 min were evaluated for their suitability when used for flow and pressure event detection by the systems developed in this study; Table 1.
From results shown in Table 1, Mounce et al. (2012) con-cluded that, at the present time, sampling intervals of 1 or 5 min do not improve event detection sufficiently to justify the extra resources required to gather the data. For example; the increase in power required for battery powered
instru-Table 1.Summary of average improvement in detection times (min-utes) over multiple instruments relative to 15 min instantaneous data in each case (Mounce et al., 2012).
Flow Flow Pressure
pressure only only
Inst. Avg. Inst. Avg. Inst. Avg.
15 min 0 44 0 45 0 43
5 min 29 49 38 52 26 48
1 min 53 54 53 53 53 54
ments and loggers (all the loggers used in this study were battery powered), and the data management overheads. Simi-larly, current online modelling approaches do not yet require data at these higher frequencies. However, this is likely to change in the future as the density of sensing of water dis-tribution system parameters increases due to reducing cost and improving logging capacity and communications op-tions. Pressure transients can cause, and be an indicator of, burst pipes and result in contamination intrusion (Ebacher et al., 2010; Misiunas et al., 2005). Once systems can deal with high frequency, high sample rate data, it will be possi-ble to monitor and analyse transient pressure fluctuations to improve burst detection, identify the cause of transients and prevent contamination events (Jung et al., 2011; Yang et al., 2011).
Data value averaging, inherent in how flow is commonly measured but unusual for pressure, was found to be a useful strategy for both flow and pressure data. A simple, low cost, firmware upgrade to the loggers is recommended so that the data averaging can be performed on the logger in order to reduce the amount of data transmitted via GPRS and provide the following significant benefits:
– Improved detection time compared to using
instanta-neous data with event detection software
– Eradication of errors associated with short-term
vari-ations leading to more accurate hydraulic model cali-bration and simulations when using values for model boundary conditions and therefore the likely provision of more accurate regulatory compliance data/reporting.
4 Discussion
The goal of this work was to demonstrate how online data processing can benefit proactive water distribution network operation. One of the aims was to free staff from man-ual interpretation of data, multiple and/or false alarms, and leakage/burst event data. Several individual approaches have been explored, developed and designed to improve some as-pect of current industry processes.
realised when all these components are applied in combina-tion. Figure 6 shows an idealised application schematic for all the components.
The system would be initialised by using offline hydraulic models, driven by historic data, to generate pipe sensitivity matrices from which to identify optimal locations for instru-mentation within the network. The minimum number of in-struments required to meet identification and location sensi-tivity constraints could then be installed in the field.
The instruments would provide a constant stream of flow and pressure data which would be checked, and pre-processed, before being stored for access by the analyti-cal components of the system. This data would be stored in a “warehouse” and made available to online hydraulic modelling and artificial intelligence based analysis systems, and/or end users.
Once the data was being streamed into the system, the on-line hydraulic model would be started. The sensitivity matri-ces could then be recreated using this new, current data, and reviewed to check that instrument locations are still optimal. If they were not, instrument locations could then be moved to the new optimal sites for current network operation. Follow-ing network changes such as DMA rezonFollow-ing, further review would be undertaken to ensure maximum detection sensitiv-ity is maintained at all times; if necessary, by moving, adding or removing instruments. The online system could then be allowed to run continually providing an overview of current flows and pressures in all pipes within the network, and the ability to generate new sensitivity matrices on demand.
The model could then be configured to provide warnings or alarms when unusual flows or pressures were detected by specific instruments. Multiple instruments could be used in combination to generate specific alarms such as pump fail-ure. The impact of a pump failure could be modelled, the effects mapped, and the characteristics used to identify the event should it happen in the future. For example; if flow at A dropped by X%, and pressure at B and C dropped by Y%, display the alarm “The pump at D is not operating within nor-mal parameters”. In this way the performance of many dy-namic components of a network, for example PRVs and ser-vice reservoirs could be continually monitored using a very small number of instruments.
At the same time, data would be streamed into the AI event detection system. This component would automatically anal-yse large amounts of data, and generate burst pipe (and other hydraulic anomalies) detection alarms and flow estimates, along with a measure of certainty; soon after the event oc-curred (the actual time to generate an alarm would be de-pendent upon a number of factors). Combined use of the AI system with dynamic sensitivity matrices generated by the online model would quickly provide location information fa-cilitating quicker repairs.
During an event, the online model would reflect the effect of any event across the entire network highlighting which customers were impacted. If the model was configured to do
so, it could identify all pipes with flows and pressures below a definable threshold, record and report them. In this way it would be possible to realise continuous low flow/interruption to supply (DG2/DG3) reporting. The data collected could also be used when investigating an event and its effects on customers.
System performance, and hence the benefits realised, would of course depend upon the performance characteristics of the instrumentation and it being correctly installed. Simi-larly, online model output would reflect the effort expended in calibration; although tools for this purpose are becoming sophisticated, efficient and cheaper to use. It is not irrational to expect that, with the need for water efficiency coming to the fore, all usage will be metered in the future to minimise loss and waste, and this is reflected in the development of automatic meter reading (AMR), smart metering technolo-gies, and smart water networks. This will benefit hydraulic modelling greatly by reducing uncertainty and making model calibration easier. AI systems will also benefit greatly from this additional measurement data as such systems can be ex-panded to accommodate almost any number of time series inputs enabling very accurate network flow mapping which will in turn provide better detection and location information. The loop is completed when this information is assimilated into hydraulic models enabling more accurate calibration and the creation of improved sensitivity matrices. The whole pro-cess becomes iterative resulting in a stable, very accurate, and sensitive detection and location system.
The vision, that is the natural progression of the work presented here, is seamless integration between a vari-ety of instrumentation types, automated data gathering and online processing, analysis and interpretation/presentation technologies, allied with decision support systems to provide a truly proactive management and control capability. Wa-ter quality performance monitoring and reporting would be integrated and automated hydraulics would be programmed to minimise residence time to maintain residual disinfectant and maximise water quality. Automatic remote control of dy-namic assets and valves would ensure supply and route it op-timally to support unexpected demand from burst events, and to further ensure high water quality.
Data warehouse
Dynamic sensitivity matrix
Continually updated optimal instrument location and minimum / ideal number of instruments for any network configuration /operational scenario Flow & pressure data Instruments (High sensitivity measurements) Data quality checks and pre
processing
On line AI system
[image:10.595.49.286.64.211.2]Intelligent detections and event flow size estimates Online location routines and location overlays Optimal instrument numbers and locations Visual display and assessment of current network status Event location information On line model
Figure 6.Schematic of idealised combined application.
5 Conclusions
This paper summarises the development, application and ver-ification of a number of different methods/approaches de-signed to obtain value/benefit from measurements of flow and pressure within water distribution networks.
The individual techniques have shown how network data can be gathered from optimally located instrumentation and automatically checked, analysed and presented, to provide timely information for network operation decision making, and for flow and pressure event detection and location. Each of the methods presented can improve current distribution network knowledge, and are valuable steps towards improv-ing network management.
When the individual methods explored are applied in com-bination, as shown in Fig. 6, the composite system enables a step change in proactive information network management, including the potential to generate improvements in network performance, customer standards of service, and the eco-nomic level of leakage.
In future, entire water supply (and sewerage) networks should be proactively managed from source to tap, using state of the art measurement and control technologies backed by data analysis and decision support systems; much of which will be programmed and analysed by artificial intel-ligence methods, making life much simpler for system oper-ators and industry decision makers.
Acknowledgements. This work was supported by the EPSRC
(grant EP/E003192/1) and industrial collaborators. The authors
would like to thank Yorkshire Water Services for their assistance with models and data. Particular thanks are due to R. Patel and L. Soady. In addition, the authors wish to acknowledge 7-Technologies for provision and support of the hydraulic modelling software.
Edited by: L. Rietveld
References
Aquis 7-Technologies A/S, Bistruphave 3, 3460 Denmark, http://
www.7t.dk (last access: 26 August 2013).
Cheng, J., Wu, X., Li, G., Taheri, F., and Pang, S.-S.: Development of a smart composite pipe joint integrated with piezoelectric lay-ers under tensile loading, Int. J. Solids Struct., 43, 5370–5385, 2006.
Ebacher, G., Besner, M.-C., Lavoie, J., Jung, B. S., Karney, B. W., and Prévost, M.: Transient modeling of a full-scale distribution system: comparison with field data, J. Water Res. Pl.-ASCE, 137, 173–182, 2010.
Farley, B., Boxall, J. B., and Mounce, S. R.: Optimal locations of pressure meter for burst detection, in: Proceedings of the 10th Water Distribution System Analysis Symposium, South Africa, 17–20 August (ASCE online), 2008.
Farley, B., Mounce, S. R., and Boxall, J. B.: Field Testing of an Optimal Sensor Placement Methodology for Event Detection in an Urban Water Distribution Network, Urban Water J., 7, 345– 356, 2010a.
Farley, B., Mounce, S. R., and Boxall, J. B.: Field validation of
op-timal instrumentation method- ology for burst/leak detection and
location, in: Proceedings of the 12th Water Distribution System Analysis Symposium, Tucson, Arizona (ASCE online), 2010b. Farley, B., Mounce, S. R., and Boxall, J. B. Development and Field
Validation of a Burst Localisation Methodology, ASCE Water Resources Planning and Management, 139, 604–613, 2013. Frank, R.: Understanding smart sensors. Artech House –
Tech-nology and Engineering, ISBN-13: 978-1-60807-507-2, http:
//books.google.co.uk/books?id=v4G9jKBCghMC&source=
gbs_navlinks_s (last access: 30 March 2014), 2013.
Gama, J.: Knowledge Discovery from data streams. Chapman &
Hall/CRC, Business & Economics – http://books.google.co.uk/
books?isbn=1439826110 (last access: 30 March 2014), 237 pp.,
2010.
Goulet, J.-A., Coutu, S., and Smith, I. F. C.: Model falsification di-agnosis and sensor placement for leak detection in pressurized pipe networks, Adv. Eng. Inform., 27.2, 261–269, 2013. Guo, N. and Saul, A. J.: Improving the operation and maintenance
of CSO structures, in: Proceedings of 12th International Confer-ence on Urban Drainage, Porto Alegre, Brazil, 2011.
House of Lords: Water Management, Volume I: Report, House of Lords Science and Technology Committee, HL Paper 191-I, House of Lords, London, UK, 2006.
Jung, B. S., Boulos, P. F., and Altman, T.: Optimal transient network design: A multi-objective approach, J. AWWA, 103, 118–127, 2011.
Machell, J., Mounce, S. R., and Boxall, J. B.: Online modelling of water distribution systems: a UK case study, Drink. Water Eng.
Sci., 3, 21–27, doi:10.5194/dwes-3-21-2010, 2010.
Metje, N., Chapman, D. N., Cheneler, D., Ward, M., and Thomas, A. M.: Smart Pipes – Instrumented Water Pipes, Can This Be Made a Reality?, Sensors, 11, 7455–7475, 2011.
Michalak, S., DuBois, A., DuBois, D., Vander Wiel, S., and Hog-den, J.: Developing systems for real-time streaming analysis, J. Comput. Graph. Stat., 21, 561–580, 2012.
Mounce, S. R., Khan, A., Wood, A. S., Day, A. J., Widdop, P. D., and Machell, J.: Sensor-fusion of hydraulic data for burst detec-tion and locadetec-tion in a treated water distribudetec-tion system, Interna-tional Journal of Information Fusion, 4, 217–229, 2003. Mounce, S. R., Boxall, J. B., and Machell, J.: Development and
Ver-ification of an Online Artificial Intelligence System for Burst De-tection in Water Distribution Systems, ASCE Water Resources Planning and Management, 136, 309–318, 2010.
Mounce, S. R., Mounce, R. B., and Boxall, J. B.: Novelty detection for time series data analysis in water distribution systems using Support Vector Machines, J. Hydroinform., 13, 672–686, 2011. Mounce, S. R., Mounce, R. B., and Boxall, J. B.: Identifying
sam-pling interval for event detection in water distribution networks, ASCE Water Resources Planning and Management, 138, 187– 191, 2012.
Mounce, S. R., Shepherd, W., Sailor, G. Shucksmith, J. M. and Saul, A. J.: Predicting CSO chamber depth using Artificial Neural Networks with rainfall radar data, Water Sci. Technol.,
doi:10.2166/wst.2014.024, in press, 2014.
Ostojin, S., Mounce, S. R., and Boxall, J. B.: An artificial intel-ligence approach for optimising pumping in sewer systems, J. Hydroinform., 13, 295–306, 2011.
Pearson, D. and Trow, S. W.: Calculating the Economic Levels of Leakage, Leakage 2005 Conference Proceedings, 2005. Perez, R., Puig, V., Pascual, J., Peralta, A., Landeros, E. and
Jor-danas, L.:. Pressure sensor distribution for leak detection in Barcelona water distribution network, Wa. Sci. Technol., 9, 715– 721, 2009.
Pérez, R., Puig, V., Pascual, J., Quevedo, J., Landeros, E., and Peralta, A.: Methodology for leakage isolation using pressure sensitivity analysis in water distribution networks, Control Eng. Pract., 19, 1157–1167, 2011.
Preis, A., Whittle, A., and Ostfeld, A.: Multi-objective optimization for conjunctive placement of hydraulic and water quality sensors in water distribution systems, Wa. Sci. Technol., 11, 166–171, 2011.
Preis, A., Obaid, T., Allen, M., Iqbal, M., and Whittle, A. J.: Real-time hydraulic modelling of a water distribution system in Sin-gapore, WDSA 2012: 14th Water Distribution Systems Analy-sis Conference, 24–27 September 2012 in Adelaide, South Aus-tralia, Engineers AusAus-tralia, 2012.
Romano, M., Kapelan, Z., and Savic, D. A.: Evolutionary
Algorithm and Expectation Maximisation Strategies for
Improved Detection of Pipe Bursts and Other Events
in Water Distribution Systems, J. Water Res. Pl.-ASCE,
doi:10.1061/(ASCE)WR.1943-5452.0000347, in press, 2013.
Rosich, A., Sarrate, R., and Nejjari, F.: Optimal Sensor Placement for Leakage Detection and Isolation in Water Distribution Net-works, IFAC Symp. Series, 8, 776–781, 2012.
Srirangarajan, S., Allen, M., Preis, A., Iqbal, M., Lim, H. B., and Whittle, A. J.: Water main burst event detection and localization, Proceedings of 12th Water Distribution Systems Analysis Con-ference (WDSA’10), 2010.
Yang, J., LeChevallier, M. W., Teunis, P. F. M., and Xu, M.: Manag-ing risks from virus intrusion into water distribution systems due to pressure transients, J. Water Health, 9, 291–305, 2011. Ye, G. and Fenner, R.: Kalman Filtering of Hydraulic
Measure-ments for Burst Detection in Water Distribution Systems, ASCE Journal of Pipeline Systems Engineering and Practice, 2, 14–22, 2010.