This is a repository copy of
Use of generic and condition-specific measures of
health-related quality of life in NICE decision-making: a systematic review, statistical
modelling and survey
.
White Rose Research Online URL for this paper:
http://eprints.whiterose.ac.uk/94898/
Version: Accepted Version
Article:
Longworth, L., Yang, Y., Young, T. et al. (9 more authors) (2014) Use of generic and
condition-specific measures of health-related quality of life in NICE decision-making: a
systematic review, statistical modelling and survey. Health Technology Assessment, 18 (9).
pp. 1-224. ISSN 1366-5278
[email protected] https://eprints.whiterose.ac.uk/ Reuse
Unless indicated otherwise, fulltext items are protected by copyright with all rights reserved. The copyright exception in section 29 of the Copyright, Designs and Patents Act 1988 allows the making of a single copy solely for the purpose of non-commercial research or private study within the limits of fair dealing. The publisher or other rights-holder may allow further reproduction and re-use of this version - refer to the White Rose Research Online record for this item. Where records identify the publisher as the copyright holder, users can verify any specific terms of use on the publisher’s website.
Takedown
If you consider content in White Rose Research Online to be in breach of UK law, please notify us by
VOLUME 18 ISSUE 9 FEBRUARY 2014 ISSN 1366-5278
Use of generic and condition-specific measures of
health-related quality of life in NICE decision-making:
a systematic review, statistical modelling and survey
Louise Longworth, Yaling Yang, Tracey Young, Brendan Mulhern,
measures of health-related quality of life
in NICE decision-making: a systematic
review, statistical modelling and survey
Louise Longworth,
1
* Yaling Yang,
1
Tracey Young,
2
Brendan Mulhern,
2
Mónica Hernández Alava,
2
Clara Mukuria,
2
Donna Rowen,
2
Jonathan Tosh,
2
Aki Tsuchiya,
2
Pippa Evans,
2
Anju Devianee Keetharuth
2
and John Brazier
2
1
Health Economics Research Group, Brunel University, Uxbridge, Middlesex, UK
2
School of Health and Related Research, University of Sheffield, Sheffield, UK
*Corresponding author
Declared competing interests of authors:LL, YY, AT and JB are members of the EuroQol Group (a non-profit making organisation responsible for the development of EQ-5D). LL is a member of the Board of the EuroQol Group and Brunel University receives reimbursement for her time. JB developed the SF-6D and the University of Sheffield receives reimbursement for its commercial use. LL is a member of the National Institute for Health and Care Excellence (NICE) Technology Appraisal Committee.
Published February 2014
DOI: 10.3310/hta18090This report should be referenced as follows:
Longworth L, Yang Y, Young T, Mulhern B, Hernández Alava M, Mukuria C,et al.Use of generic and condition-specific measures of health-related quality of life in NICE decision-making: a systematic review, statistical modelling and survey.Health Technol Assess2014;18(9).
ISSN 1366-5278 (Print) ISSN 2046-4924 (Online) Five-year impact factor: 5.804
Health Technology Assessmentis indexed in MEDLINE, CINAHL, EMBASE, The Cochrane Library and the ISI Science Citation Index and is assessed for inclusion in the Database of Abstracts of Reviews of Effects.
This journal is a member of and subscribes to the principles of the Committee on Publication Ethics (COPE) (www.publicationethics.org/). Editorial contact: [email protected]
The full HTA archive is freely available to view online at www.journalslibrary.nihr.ac.uk/hta. Print-on-demand copies can be purchased from the report pages of the NIHR Journals Library website: www.journalslibrary.nihr.ac.uk
Criteria for inclusion in theHealth Technology Assessmentjournal
Reports are published inHealth Technology Assessment(HTA) if (1) they have resulted from work for the HTA programme or, commissioned/managed through the Methodology research programme (MRP), and (2) they are of a sufficiently high scientific quality as assessed by the reviewers and editors.
Reviews inHealth Technology Assessmentare termed‘systematic’when the account of the search appraisal and synthesis methods (to minimise biases and random errors) would, in theory, permit the replication of the review by others.
HTA programme
The HTA programme, part of the National Institute for Health Research (NIHR), was set up in 1993. It produces high-quality research information on the effectiveness, costs and broader impact of health technologies for those who use, manage and provide care in the NHS. ‘Health technologies’are broadly defined as all interventions used to promote health, prevent and treat disease, and improve rehabilitation and long-term care.
The journal is indexed in NHS Evidence via its abstracts included in MEDLINE and its Technology Assessment Reports inform National Institute for Health and Care Excellence (NICE) guidance. HTA research is also an important source of evidence for National Screening Committee (NSC) policy decisions.
For more information about the HTA programme please visit the website: www.hta.ac.uk/
This report
This issue of the Health Technology Assessment journal series contains a project commissioned/managed by the Methodology research programme (MRP). The Medical Research Council (MRC) is working with NIHR to deliver the single joint health strategy and the MRP was launched in 2008 as part of the delivery model. MRC is lead funding partner for MRP and part of this programme is the joint MRC–NIHR funding panel‘The Methodology Research Programme Panel’.
To strengthen the evidence base for health research, the MRP oversees and implements the evolving strategy for high quality methodological research. In addition to the MRC and NIHR funding partners, the MRP takes into account the needs of other stakeholders including the devolved administrations, industry R&D, and regulatory/advisory agencies and other public bodies. The MRP funds investigator-led and needs-led research proposals from across the UK. In addition to the standard MRC and RCUK terms and conditions, projects commissioned/managed by the MRP are expected to provide a detailed report on the researchfindings and may publish thefindings in the HTA journal, if supported by NIHR funds.
The authors have been wholly responsible for all data collection, analysis and interpretation, and for writing up their work. The HTA editors and publisher have tried to ensure the accuracy of the authors’report and would like to thank the reviewers for their constructive comments on the draft document. However, they do not accept liability for damages or losses arising from material published in this report.
This report presents independent research funded by the National Institute for Health Research (NIHR). The views and opinions expressed by authors in this publication are those of the authors and do not necessarily reflect those of the NHS, the NIHR, the MRC, NETSCC, the HTA programme or the Department of Health. If there are verbatim quotations included in this publication the views and opinions expressed by the interviewees are those of the interviewees and do not necessarily reflect those of the authors, those of the NHS, the NIHR, NETSCC, the HTA programme or the Department of Health.
Editor-in-Chief of Health Technology Assessment and NIHR
Journals Library
Professor Tom Walley Director, NIHR Evaluation, Trials and Studies and Director of the HTA Programme, UK
NIHR Journals Library Editors
Professor Ken Stein Chair of HTA Editorial Board and Professor of Public Health, University of Exeter Medical School, UK
Professor Andree Le May Chair of NIHR Journals Library Editorial Group (EME, HS&DR, PGfAR, PHR journals)
Dr Martin Ashton-Key Consultant in Public Health Medicine/Consultant Advisor, NETSCC, UK
Professor Matthias Beck Chair in Public Sector Management and Subject Leader (Management Group), Queen’s University Management School, Queen’s University Belfast, UK
Professor Aileen Clarke Professor of Health Sciences, Warwick Medical School, University of Warwick, UK
Dr Tessa Crilly Director, Crystal Blue Consulting Ltd, UK
Dr Peter Davidson Director of NETSCC, HTA, UK
Ms Tara Lamont Scientific Advisor, NETSCC, UK
Professor Elaine McColl Director, Newcastle Clinical Trials Unit, Institute of Health and Society, Newcastle University, UK
Professor William McGuire Professor of Child Health, Hull York Medical School, University of York, UK
Professor Geoffrey Meads Honorary Professor, Business School, Winchester University and Medical School, University of Warwick, UK
Professor Jane Norman Professor of Maternal and Fetal Health, University of Edinburgh, UK
Professor John Powell Consultant Clinical Adviser, National Institute for Health and Care Excellence (NICE), UK
Professor James Raftery Professor of Health Technology Assessment, Wessex Institute, Faculty of Medicine, University of Southampton, UK
Dr Rob Riemsma Reviews Manager, Kleijnen Systematic Reviews Ltd, UK
Professor Helen Roberts Professorial Research Associate, University College London, UK
Professor Helen Snooks Professor of Health Services Research, Institute of Life Science, College of Medicine, Swansea University, UK
Please visit the website for a list of members of the NIHR Journals Library Board: www.journalslibrary.nihr.ac.uk/about/editors
Editorial contact: [email protected]
Abstract
Use of generic and condition-speci
fi
c measures of
health-related quality of life in NICE decision-making:
a systematic review, statistical modelling and survey
Louise Longworth,
1* Yaling Yang,
1Tracey Young,
2Brendan Mulhern,
2Mónica Hernández Alava,
2Clara Mukuria,
2Donna Rowen,
2Jonathan Tosh,
2Aki Tsuchiya,
2Pippa Evans,
2Anju Devianee Keetharuth
2and John Brazier
21Health Economics Research Group, Brunel University, Uxbridge, Middlesex, UK
2School of Health and Related Research, University of Sheffield, Sheffield, UK
*Corresponding author
Background:The National Institute for Health and Care Excellence recommends the use of generic preference-based measures (GPBMs) of health for its Health Technology Assessments (HTAs). However, these data may not be available or appropriate for all health conditions.
Objectives:To determine whether GPBMs are appropriate for some key conditions and to explore alternative methods of utility estimation when data from GPBMs are unavailable or inappropriate.
Design:The project was conducted in three stages: (1) A systematic review of the psychometric properties of three commonly used GPBMs [EQ-5D, SF-6D and Health Utilities Index Mark 3 (HUI3)] in four broadly defined conditions: visual impairment, hearing impairment, cancer and skin conditions. (2) Potential modelling approaches to‘map’EQ-5D values from condition-specific and clinical measures of health [European Organisation for Research and Treatment of Cancer Quality-of-life Questionnaire Core 30 (EORTC QLQ-C30) and Functional Assessment of Cancer Therapy–General Scale (FACT-G)] are compared for predictive ability and goodness offit using two separate data sets. (3) Three potential extensions to the EQ-5D are developed as‘bolt-on’items relating to hearing, tiredness and vision. They are valued using the time trade-off method. A second valuation study is conducted to fully value the EQ-5D with and without the vision bolt-on item in an additional sample of 300 people.
Setting:The valuation surveys were conducted using face-to-face interviews in the respondents’homes.
Participants:Two representative samples of the UK general population from Yorkshire (n= 600).
Interventions:None.
Results:(1) EQ-5D was valid and responsive for skin conditions and most cancers; in vision, its
performance varied according to aetiology; and performance was poor for hearing impairments. The HUI3 performed well for hearing and vision disorders. It also performed well in cancers although evidence was limited and there was no evidence in skin conditions. There were limited data for SF-6D in all four
conditions and limited evidence on reliability of all instruments. (2) Mapping algorithms were estimated to predict EQ-5D values from alternative cancer-specific measures of health. Response mapping using all the domain scores was the best performing model for the EORTC QLQ-C30. In an exploratory analysis, a limited dependent variable mixture model performed better than an equivalent linear model. In the full analysis for the FACT-G, linear regression using ordinary least squares gave the best predictions followed by the tobit model. (3) The exploratory valuation study found that bolt-on items for vision, hearing and tiredness had a significant impact on values of the health states, but the direction and magnitude of differences depended on the severity of the health state. The vision bolt-on item had a statistically significant impact on EQ-5D health state values and a full valuation model was estimated.
Conclusions:EQ-5D performs well in studies of cancer and skin conditions. Mapping techniques provide a solution to predict EQ-5D values where EQ-5D has not been administered. For conditions where EQ-5D was found to be inappropriate, including some vision disorders and for hearing, bolt-ons provide a promising solution. More primary research into the psychometric properties of the generic preference-based measures is required, particularly in cancer and for the assessment of reliability. Further research is needed for the development and valuation of bolt-ons to EQ-5D.
Funding:This project was funded by the UK Medical Research Council (MRC) as part of the MRC-NIHR methodology research programme (reference G0901486) and will be published in full inHealth Technology Assessment; Vol. 18, No. 9. See the NIHR Journals Library website for further project information.
ABSTRACT
vi
Contents
List of tables . . . .xi
List of figures. . . xv
List of boxes. . . xvii
List of abbreviations. . . .xix
Scientific summary. . . .xxi
Chapter 1 Introduction 1
Background 1
Aims and objectives of the report 3
Chapter 2 A systematic review of the psychometric properties of generic
preference-based measures of health in four conditions 5
Introduction 5
Methods 5
The generic preference-based measures 5
Search strategy and data identification 6
Data extraction 7
Data analysis 7
Results 9
Vision 9
Hearing 17
Skin conditions 23
Cancer 30
Chapter 3 Mapping to EQ-5D 71
Introduction 71
Methods 71
Measures 71
Data sets 72
Data analysis 73
Representing for uncertainty in mapping methods 78
Results 78
European Organization for Research and Treatment Quality-of-life Questionnaire
Core 30 Preliminary analysis 78
European Organization for Research and Treatment Quality-of-life Questionnaire
Core 30 Mapping Analysis Results 79
Functional Assessment of Cancer Therapy–General Scale preliminary analysis 88 Best-fitting model Functional Assessment of Cancer Therapy–General Scale 89 Limited dependent variable mixture model: Functional Assessment of
Cancer Therapy–General Scale 91
Uncertainty 97
Chapter 4 Developing‘bolt-on’items to EQ-5D 99
Background and aim 99
Methods 99
Development of bolt-on items 99
Methods of the exploratory study 99
Methods of the full valuation study 103
Results of the exploratory study 105
Comparison of health state values 107
Conclusions from the exploratory study 108 Results of the full valuation study of EQ + vision 110
Multivariate analysis 112
Discussion 119
Chapter 5 Discussion 123
Psychometric properties of the generic preference-based measures 123 Mapping to predict EQ-5D outcomes when data are unavailable 124
The bolt-on studies 125
Conclusion 126
Recommendations for further research 127
Psychometric properties of the generic preference-based
measures in different conditions 127
Mapping 127
The development and use of bolt-ons to EQ-5D 127
Acknowledgements 129
References 131
Appendix 1 Project protocol 147
Appendix 2 Search strategies for literature review 151
Appendix 3 Summary of validity for utility measures: visual disorders 157
Appendix 4 Summary of responsiveness for utility measures: visual disorders 159
Appendix 5 Summary of validity for utility measures: hearing impairments 161
Appendix 6 Summary of responsiveness for utility measures: hearing impairments 163
Appendix 7 Summary of validity for utility measures: skin conditions 165
Appendix 8 Summary of responsiveness for utility measures: skin conditions 167
Appendix 9 Summary of reliability for utility measures: cancers 169
Appendix 10 Summary of validity for utility measures: cancers 171
Appendix 11 Summary of responsiveness for utility measures–cancers 173
Appendix 12 Results from mapping from European Organization for Research
and Treatment Quality-of-Life Questionnaire Core 30 to EQ-5D 175 187 161
163
165
173 171 167
181 169
CONTENTS
viii
Appendix 13 Results from mapping from Functional Assessment of
Cancer Therapy –General Scale to EQ-5D 177
Appendix 14 Summary of time trade-off values for all health states included
in the exploratory bolt-on study 179
207
List of tables
TABLE 1 Information extracted from included papers 7
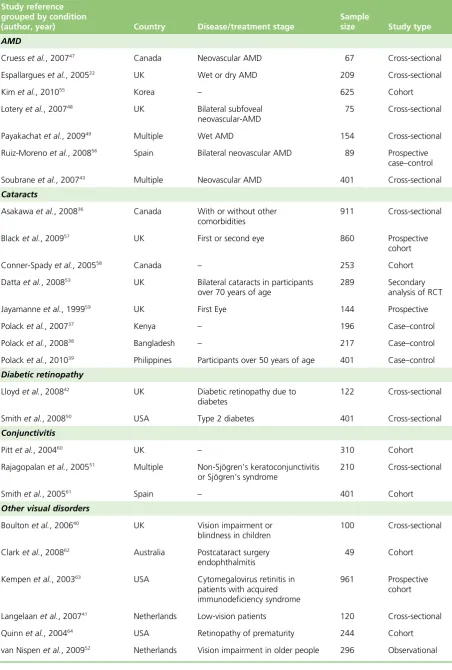
TABLE 2 Characteristics of included studies: visual disorders 10
TABLE 3 Instruments used: vision 13
TABLE 4 Overall performances of EQ-5D, HUI3 and SF-6D in visual disorders 18
TABLE 5 Characteristics of the studies included in the review: hearing loss 20
TABLE 6 Measures reported in the papers: hearing loss 22
TABLE 7 The overall performance of EQ-5D, HUI3 and SF-6D in studies of hearing
impairment 24
TABLE 8 Characteristics of studies included: skin diseases 26
TABLE 9 Measures used in the studies included in the skin review 27
TABLE 10 Overall performance of EQ-5D in studies of skin diseases 31
TABLE 11 Number of papers included in the review by type of cancer 33
TABLE 12 Characteristics of included studies: cancer review 35
TABLE 13 Measures used: cancer review 47
TABLE 14 Overview of performance of EQ-5D, HUI3 and SF-6D in studies of cancer 61
TABLE 15 Overview of analysis 77
TABLE 16 Characteristics of the patient samples 79
TABLE 17 European Organization for Research and Treatment Quality-of-life Questionnaire Core 30 mean observed and predicted EQ-5D values per model and
summary model performance: OLS 81
TABLE 18 European Organization for Research and Treatment Quality-of-life Questionnaire Core 30 mean ranking of summary statistics and model
performance tests for OLS models 83
TABLE 19 European Organization for Research and Treatment Quality-of-life Questionnaire Core 30 mean observed and predicted EQ-5D values per model and summary model performance: best-fitting model across modelling techniques 84
TABLE 20 European Organization for Research and Treatment Quality-of-life Questionnaire Core 30 mean ranking of summary statistics and model performance
tests: best performing model across techniques 85
TABLE 21 European Organization for Research and Treatment Quality-of-life
Questionnaire Core 30 Best-fitting response-mapping model 86
TABLE 22 Responses to EQ-5D dimensions 88
TABLE 23 Summary of the FACT-G overall and domain scores 88
TABLE 24 Summary of observed and predicted values for best performing models:
FACT-G data set 90
TABLE 25 FACT-G mean ranking of summary statistics and model performance
tests: best performing model across techniques 91
TABLE 26 Coefficients for best-fitting mapping model from FACT-G: item level OLS 92
TABLE 27 Summary of overall modelfit and prediction measures 93
TABLE 28 Comparisons of observed vs. predicted means and in sample predictions
split by the ECOG 93
TABLE 29 Summary statistics of the observed EQ-5D distribution and simulated
distributions from the models 95
TABLE 30 Parameter estimates and robust SEs of the LDVMM models 95
TABLE 31 Health states selected for valuation in the exploratory study 101
TABLE 32 Health states selected to value in the full valuation survey 103
TABLE 33 Variables considered for inclusion in the multivariate analysis of
EQ-5D and EQ+vision 104
TABLE 34 Characteristics of respondents to the exploratory bolt-on valuation study 105
TABLE 35 Self-reported health of respondents in the exploratory study 106
TABLE 36 Mean TTO values for all EQ-5D heath states (no bolt-on) 107
TABLE 37 Comparison between mean TTO values for EQ-5D and EQ-5D
with bolt-ons 107
TABLE 38 Analysis of the impact of background characteristics on the health state
values in the exploratory study 109
TABLE 39 Sociodemographic characteristics of respondents of the EQ+vision
valuation study 111
TABLE 40 Self-reported health status of respondents in the EQ+vision study 112
TABLE 41 Mean TTO values for EQ-5D and EQ+vision 115
TABLE 42 Models estimated for EQ-5D 116
TABLE 43 Models estimated for EQ+vision 117
LIST OF TABLES
xii
TABLE 44 Final models (with background characteristics) 118
TABLE 45 Comparison of the model coefficients 120
TABLE 46 Spearman’s rank-order correlation coefficients among EORTC QLQ-C30
summary scales for all data 188
TABLE 47 Spearman’s rank-order correlation coefficients among EORTC QLQ-C30
summary scales 190
TABLE 48 European Organization for Research and Treatment Quality-of-Life Questionnaire Core 30 mean observed and predicted EQ-5D values per model and
summary model performance: OLS 192
TABLE 49 Best-fitting EORTC QLQ-C30 OLS model 193
TABLE 50 European Organization for Research and Treatment Quality-of-Life Questionnaire Core 30 mean observed and predicted EQ-5D values per model and
summary model performance: tobit 195
TABLE 51 European Organization for Research and Treatment Quality-of-Life
Questionnaire Core 30 best-fitting tobit model 196
TABLE 52 European Organization for Research and Treatment Quality-of-Life Questionnaire Core 30 mean observed and predicted EQ-5D values per model and
summary model performance: TPM 198
TABLE 53 European Organization for Research and Treatment Quality-of-Life
Questionnaire Core 30 TPM best-fitting model 200
TABLE 54 European Organization for Research and Treatment Quality-of-Life Questionnaire Core 30 mean observed and predicted EQ-5D values per model and
summary model performance: splining model 202
TABLE 55 European Organization for Research and Treatment Quality-of-Life
Questionnaire Core 30 best-fitting OLS dimension model with splines 203
TABLE 56 European Organization for Research and Treatment Quality-of-life Questionnaire Core 30 mean observed and predicted EQ-5D values per
model and summary model performance: response mapping 204
TABLE 57 Spearman’s rank correlation coefficients among the FACT-G
summary scales 207
TABLE 58 Spearman’s rank correlation coefficients between EQ-5D
and FACT-G summary scales and total score 207
TABLE 59 Summary of observed and predicted values per model: OLS 208
TABLE 60 Model coefficients for best performing OLS model (model 6) 209
TABLE 61 Summary of observed and predicted values per model: tobit models 211
TABLE 63 Summary of observed and predicted values per model: TPMs 214
TABLE 64 Coefficients for modelling to FACT-G domain scores: TPMs 216
TABLE 65 Summary of observed and predicted values per model: splining 217
TABLE 66 Coefficients for modelling to FACT-G significant domain scores 217
TABLE 67 Summary of observed and predicted values per model:
response mapping 219
TABLE 68 Model 3: coefficients for FACT-G significant domain scores 220 LIST OF TABLES
xiv
List of
fi
gures
FIGURE 1 Flow diagram showing selection of studies: vision. 10
FIGURE 2 Flow diagram showing selection of studies: hearing impairment. 20
FIGURE 3 Flow diagram showing selection of studies for skin review. 25
FIGURE 4 Flow diagram showing selection of studies: cancer. 33
FIGURE 5 Histogram of EQ-5D utilities: All data sets. 80
FIGURE 6 European Organization for Research and Treatment Quality-of-life
Questionnaire Core 30 Plots of observed and predicted EQ-5D scores for OLS models. 83
FIGURE 7 Observed and predicted EQ-5D scores for best performing models
for EORTC QLQ-C30. SPL, splining. 85
FIGURE 8 Distribution of EQ-5D scores for FACT-G data set. 88
FIGURE 9 Summary of best FACT-G model predictions. SPL, splining. 91
FIGURE 10 Observed EQ-5D distribution vs. simulated distributions from the models. 94
FIGURE 11 Distribution of TTO values for EQ-5D and EQ+vision health states.
(a) EQ-5D health states; (b) EQ+vision health states 113
FIGURE 12 Summary of performance of all OLS models 194
FIGURE 13 Summary of performance of all tobit models 197
FIGURE 14 Summary of performance of all TPM models 201
FIGURE 15 Summary of performance of SPL model 203
FIGURE 16 Summary of performance of all response mapping models 205
FIGURE 17 Summary of performance of all OLS models 210
FIGURE 18 Summary of performance of all tobit models 213
FIGURE 19 Summary of performance of all TPMs 216
FIGURE 20 Summary of performance of all splining models 218
List of boxes
List of abbreviations
AIC Akaike information criterion
AMD age-related macular degeneration
AML acute myeloid leukaemia
ANOVA analysis of variance
BDI-SF Beck Depression Inventory–short form
BIC Bayesian information criterion
CHQ child health questionnaire
CINAHL Cumulative Index to Nursing and Allied Health
CLAD censored least absolute deviation
DLQI Dermatology Life Quality Index
ECOG Eastern Co-operative Oncology
Group
EORTC QLQ-C30
European Organisation for Research and Treatment of Cancer Quality-of-life Questionnaire Core 30
EORTC QLQ-C38
European Organisation for Research and Treatment of Cancer Quality-of-life Questionnaire Core 38
EQ-VAS EuroQol visual analogue scale
ES effect size
FACT-An Functional Assessment of Cancer Therapy–Anaemia
FACT-C Functional Assessment of Cancer Therapy–Colorectal subscale
FACT-F Functional Assessment of Cancer Therapy–Fatigue Module
FACT-G Functional Assessment of Cancer Therapy–General Scale
FACT-N Functional Assessment of Cancer Therapy–Neutropenia
FAI Frenchay Activities Index
FLIC Functional Living Index–Cancer
GPBM Generic preference-based measure
HADS Hospital Anxiety and Depression
Scale
HAQ Health Assessment Questionnaire
HAQ-DI Health Assessment Questionnaire
Disability Index
HRQL health-related quality of life
HTA Health Technology Assessment
HUI1 Health Utilities Index Mark 1
HUI2 Health Utilities Index Mark 2
HUI3 Health Utilities Index Mark 3
LDVMM Limited Dependent Variable
Mixture Model
MAE mean absolute error
ML malignant lymphoma
MM multiple myeloma
MRC Medical Research Council
MVH Measurement and Valuation of
Health
MYCaW Measure Yourself Concerns and
Well-being questionnaire
NAPSI Nail Psoriasis Severity Index
NICE National Institute for Health and Care Excellence
OLS ordinary least squares
PASI Psoriasis Area Severity Index
PCQ Psychological Consequences
Questionnaire
PedsQL Paediatric Quality-of-Life Inventory
PsAQoL Psoriatic Arthritis Quality-of-life scale
PTA pure-tone average
QALY quality-adjusted life-year
QoL quality of life
QWB Quality of Well-Being scale
RCT randomised controlled trial
RE random effects
RESET Regression Equation Specification Error Test
RSCL Rotterdam Symptom Checklist
SAPASI self-administered PASI
Sβ2M serum beta-2-microglobulin
SD standard deviation
SE standard error
SF-12 Short Form questionnaire-12
dimensions
SF-36 Short Form questionnaire-36
dimensions
SF-MPQ Short Form McGill pain
questionnaire
SG standard gamble
STAI State-Trait Anxiety Inventory
TNM tumour node metastasis
TPM two-part model
TTO time trade-off
VA visual acuity
VAS visual analogue scale
VF-14 Visual Function Questionnaire
(14 item)
VF-4D Visual Function Questionnaire
(4 dimension)
VFA Visual Function Assessment
VFQ-20/25 Visual Function Questionnaire-20/25
VISTA Velcade as Initial Standard Therapy
LIST OF ABBREVIATIONS
xx
Scienti
fi
c summary
Background
Generic preference-based measures (GPBMs) of health-related quality of life (HRQL) are commonly used in the economic evaluation of health interventions. They provide a multidimensional description of health that is combined with survival to generate quality-adjusted life-years (QALYs). To enhance comparability, the National Institute for Health and Care Excellence (NICE) prefers the use of one of the GPBMs, EQ-5D, for measuring HRQL. This report addresses a number of important methodological issues arising from the use of GPBMs in NICE decision-making. It describes a series of studies undertaken to address the key questions of how to determine whether a GPBM is valid for use in calculating QALYs, what to do when the GPBM is not available (and specifically the use of‘mapping’or‘cross-walking’techniques to predict EQ-5D values) and what to do when the GPBM is found to miss important components of HRQL for a specific condition through the use of a new approach using‘bolt-on’dimensions.
Objectives
l To examine the appropriateness of three GPBMs of HRQL [EQ-5D, Health Utilities Index Mark 3 (HUI3) and SF-6D] for vision loss, hearing loss, skin disorders and cancer.
l To compare alternative methods for mapping from condition-specific or clinical measures onto EQ-5D, and to conduct exploratory analysis of the incorporation of uncertainty in the predicted estimates. l To estimate mapping functions for use by researchers and policy-makers in conditions in which the
EQ-5D has been found to be appropriate.
l To explore a new method for measuring HRQL in patient groups in which a generic measure has been shown to miss important dimensions (‘bolt-ons’).
l To estimate the impact of three‘bolt-on’dimensions on the value of EQ-5D health states.
l To estimate a new value set containing one of the EQ-5D bolt-ons and compare it with a value set without the EQ-5D bolt-ons.
Methods and results
Study 1: a systematic review of the performance of generic
preference-based measures of health in four disease areas – visual disorders, hearing impairments, skin conditions and cancer
Methods
A systematic review of the literature was conducted for three GPBMs of HRQL: EQ-5D, HUI3 and SF-6D. Search strategies included free text and controlled terms. The following electronic databases were
searched: BIOSIS (1969 to 2010), Cumulative Index to Nursing and Allied Health (CINAHL) (1982 to 2010), Cochrane Library comprising the Cochrane Database of Systematic Reviews (CDSR), Cochrane Central Register of Controlled Trials (CENTRAL), Cochrane Methodology Register, NHS Economic Evaluations Database (NHS EED) (1991 to 2010), EMBASE (1980 to 2010), MEDLINE (in process and non-indexed to 2010), PsycINFO (1806 to 2010) and Web of Science (1900 to 2010). Relevant websites were also searched. For inclusion, the studies had to report dimensions and/or index values and another measure of HRQL or clinical severity to allow an assessment of validity. Searching was completed in August 2010.
people with and without the condition (case–control); (2)convergent validity, the strength of association between the EQ-5D and other measures of HRQL or clinical severity assessed using correlation coefficients or statistical significance and regression methods; (3)responsiveness, the extent (size and statistical significance) to which EQ-5D shows change where change has been observed using other HRQL or clinical measures; and (4)reliability, the extent to which the EQ-5D shows no change where no change in health has been observed using other measures.
Results
Visual disorders
Most of the 31 studies considered in this review found a worsening of utility values as visual impairment increases. Most evidence was found for the EQ-5D. Nearly all studies found significant differences between patients with the condition and a control group without it. Studies comparing EQ-5D scores across severity groups were more mixed, with mostfinding little or no difference between groups defined by clinical measures of visual impairment. No studies reported evidence on reliability for any of the measures. Three studies only allowed assessment of responsiveness and these identified changes consistent with an effective intervention, but differences were statistically significant in only two of three studies. The assessment of convergent validity was more concerning, with several studies not demonstrating a
statistically significant correlation with clinical measures. While there was less evidence for the HUI3, all but one study demonstrated good validity and no studies assessed responsiveness. There was very limited evidence on the SF-6D.
Hearing impairment
Of the 18 studies found in the review, the HUI3 was the most commonly used measure. In all six cases that used the HUI3, this measure detected differences between groups defined by their severity and statistically significant changes were detected infive out of six cases as a result of intervention. Differences picked up by the HUI3 were driven by the hearing dimensions, and, in some cases, the speech and emotion dimensions. Thefindings suggested relatively poor responsiveness of EQ-5D in this condition as in four out offive cases it failed to detect change. A study suggested it only had weak ability to discriminate differences between severity groups. Only one study involved the SF-6D; thus, the information is too limited to conclude on its performance. No studies reported evidence to allow an assessment of reliability for any of the measures.
Skin diseases
Out of the 16 papers found, there was evidence to suggest the EQ-5D has good construct and convergent validity and responsiveness in skin disorders. All six studies reporting data for groups defined according to severity showed EQ-5D was able to reflect differences between groups and only one was not significant. EQ-5D was able to significantly differentiate patient and general populations in four case–control studies (one study did not report statistical tests), as well as groups defined by non-severity. Moderate to strong correlations were found between EQ-5D and other measures. Nine out of ten studies demonstrated that the EQ-5D measure was able to detect change appropriately over time, and, among them, only one study was not statistically significant. Most of the studies included patients with psoriasis or psoriatic arthritis. No studies reported evidence for HUI3 and SF-6D, and no studies reported evidence on reliability for any of the measures.
Cancer
Ninety-eight studies were found across 20 different types of cancer. Most evidence was found for the EQ-5D and the results were, overall, satisfactory. The majority of studies found significant differences in EQ-5D values between patients with various cancers and a control group. In most cases, the EQ-5D differentiated between severity groups, although the differences were not always statistically significant. Correlations between EQ-5D and other measures were mixed. In terms of responsiveness, overall EQ-5D
SCIENTIFIC SUMMARY
xxii
scores or dimensions were able to detect appropriate change over time points, but sometimes the change in scores was small or not statistically significant. Evidence on the performance of EQ-5D varied in different types of cancer. There was some limited evidence of reliability for the EQ-5D, but most studies had not been specifically designed to assess reliability. There was evidence to support the ability of the HUI3 to differentiate between severity groups and between patients with or without cancer. The responsiveness of the HUI3 was also found to be satisfactory but evidence of reliability was mainly limited to assessments of inter-rater reliability. Few studies reported evidence to allow a judgement to be made on the validity, reliability or responsiveness of the SF-6D.
Study 2: mapping from cancer-specific measures to EQ-5D – a comparison of methods
Methods
The aims of this study were to estimate mapping functions from two cancer-specific HRQL measures, the European Organisation for Research and Treatment of Cancer Quality-of-life Questionnaire Core 30 (EORTC QLQ-C30) and Functional Assessment of Cancer Therapy–General Scale (FACT-G), for estimating EQ-5D and to test the applicability of different mapping approaches that have been used in the literature. In particular, the analysis aimed to provide comprehensive information on how to select the mapping function and incorporate information on uncertainties around the predictions. Ordinary least squares (OLS), tobit model, two-part models (TPMs), splining models and response mapping models were used and an illustrative analysis using a limited dependent mixture model for a selected FACT-G model was also
conducted. We used a range of criteria to identify the most appropriate mapping functions including mean absolute error (MAE), severity groups and shrinkage. Analysis for the FACT-G instrument was based on 530 patients with various cancers and the EORTC QLQ-C30 was based on 771 patients with multiple myeloma (MM), breast cancer and lung cancer.
Results
The mean observed EQ-5D value for the FACT-G data set was 0.722 [standard deviation (SD) = 0.224], ranging from–0.135 to 1, with 17% of participants reporting full health. For the sample with EORTC QLQ-C30 data, the mean, range and per cent in full health was 0.57 (SD = 0.35),–0.594 to 1 and 11% respectively.
Based on the range of criteria used, response mapping using all the domain scores was the
best-performing model for the EORTC QLQ-C30. This was followed by OLS and tobit model, both of which were based on significant item-level models. Results for the FACT-G showed OLS gave the best
predictions, followed by tobit model, with both based on item-level models. Response mapping and TPMs gave the poorest predictions. The limited dependent variable mixture model (LDVMM) performed better than an equivalent linear model in an exploratory analysis.
Generally, both OLS and tobit models using item levels gave some of the best estimates for EORTC QLQ-C30 and, for FACT-G, produced the most reliable models. Response mapping worked best for the EORTC QLQ-C30 functions but did not perform well for the FACT-G. This is because the FACT-G data set did not cover the full range of severity on both the EQ-5D scale and FACT-G; therefore, the mapping functions for this measure should be used only in non-severe populations.
Different selection methods for choosing the best model are currently used in mapping studies and can result in selecting different models therefore a range of criteria should be considered. We used criteria that were common across the different modelling techniques to select the best models. Further work is
Study 3: a new approach to dealing with inappropriateness – developing ‘bolt-on’ items to EQ-5D
Study 3a: testing the impact of three‘bolt-ons’to the EQ-5D methods
Three‘bolt-on’dimensions were developed following the systematic review of the performance of the EQ-5D. Two were developed in conditions in which EQ-5D was shown to be problematic: hearing and vision. A third was developed in fatigue, since this has been raised as a problem area in cancer (although, overall, EQ-5D was found to be satisfactory for cases of cancer). The description of levels follows the approach used for EQ-5D (‘no problems’as level 1,‘some problems’as level 2 and‘extreme problems’as level 3). Three core EQ-5D health states were selected for valuation covering a range of severity: a mild state, a moderate state and a severe state. To each of these states, three levels of the extra dimension (with severity levels of 1, 2 or 3) were added, resulting in nine EQ-5D states for each bolt-on. The three core EQ-5D states without the bolt-ons were also valued, plus another six EQ-5D states. A valuation survey was undertaken using a sample of the general public in South Yorkshire, UK, using face-to-face interviews and the time trade-off (TTO) method. Individuals were allocated into four groups–three groups each valued one of the bolt-on variants and one group valued EQ-5D with no bolt-ons.
Mean values for each bolt-on health state were compared with the corresponding core EQ-5D state using pairedt-tests. Regression analyses were used to further examine whether any differences between the groups could explain any potential differences between the values for the bolt-on states. Random effects (RE) models were used to take account of the clustering of data by respondents.
Results
Three hundred interviews were successfully completed, evenly split (n= 75) across three groups valuing each of the three bolt-ons and a group valuing EQ-5D alone. The characteristics of the groups were well balanced with the exception of fewer people in the group allocated to valuing the EQ + vision reporting current problems with vision.
Each of the bolt-on items had a significant impact on at least one EQ-5D health state. The extent and direction of the impact of the bolt-on varied according to the severity of the bolt-on and the state to which it was added. Adding a level 1 bolt-on to a mild state had no impact, but adding more severe levels led to lower values. Adding a level 1 or 2 bolt-on to the moderate state led to higher values, but was only statistically significant for the level 1 hearing bolt-on. Adding a level 3 bolt-on to the moderate state led to statistically significant lower values for the vision bolt-on. Adding a level 1 or 2 to the severe state has little impact or increased the health state values, though not significantly. Adding level 3 to the severe state reduced the value, but not significantly. The severe state had the highest SDs associated with the mean values and so the comparisons had the lowest power. The regression analysis confirmed that the differences in characteristics did not have a significant impact upon the valuations.
Study 3b: estimating the impact of a vision bolt-on to EQ-5D valuation model
Methods
The aim was to examine the impact of the vision bolt-on on EQ-5D health state values and the overall model parameters. A valuation study was undertaken using face-to-face interviews to obtain TTO values from members of the general public in South Yorkshire, UK. Half of respondents valued health states described using the EQ-5D plus vision bolt-on (EQ-5D + vision), and for comparative purposes, half of respondents valued EQ-5D states without the bolt-on. An orthogonal design of a six-dimension three-level instrument included 18 states, most of which were severe. Starting from these, 20 health states each for EQ-5D + vision and EQ-5D were selected for valuation, including two mild states. The set of EQ-5D states consisted of the same EQ-5D + vision states but without the vision bolt-on item. Two RE models were estimated for both instruments separately. TTO values were regressed on dimension or level models and coefficients for each of thefive EQ-5D dimensions were compared for the two models usingz-values.
SCIENTIFIC SUMMARY
xxiv
Results
Three hundred people completed the interviews and 3120 TTO values were obtained. The two groups valuing EQ-5D and EQ-5D + vision were comparable in terms of age, gender, education, and health status. The results indicate that the inclusion of a vision bolt-on has a statistically significant impact on the
valuation of EQ-5D health states. As with the exploratory analysis, the results suggest a somewhat complex relationship between the bolt-on and EQ-5D. Health states with a level 3 (extreme) vision problems
included are unsurprisingly lower than the corresponding EQ-5D health state; however, the values given to severe EQ-5D states are higher if‘no problems’on vision are explicitly mentioned (EQ + vision) compared with if vision is not mentioned at all (EQ-5D only). There was also a suggestion that the coefficients on usual activity and anxiety and depression dimensions were lower with the introduction of the vision bolt-on; however, this difference did not quite reach the 5% level of significance.
Conclusion
This report has presented three substantial pieces of research.
The reviews of performance of the GPBMs were limited by the amount of evidence available, particularly for HUI3 and SF-6D. It is also difficult to prove the validity or otherwise of EQ-5D given the absence of a gold standard. However, the systematic review established that EQ-5D was a valid and responsive method for cases of cancer and some skin conditions, performance varied according to aetiology for vision, and performance was poor for hearing disorders. The HUI3 performed well for hearing and vision disorders and it also performed well in cases of cancer, although evidence was limited and there was no evidence for skin-related conditions. There were limited data for the SF-6D in all four conditions. There was very little evidence on reliability of all the instruments in all four conditions.
Mapping algorithms were estimated to predict EQ-5D values from alternative cancer-specific measures of health (FACT-G and EORTC QLQ-C30). While some differences were found in performance between models examined and some models did perform noticeably better across most criteria, conclusions about the best method are hard to draw owing to small sample sizes and the limited coverage of the patient groups. Further work is needed to determine the most important criteria for model selection. Ideally, all the mapping functions would be estimated in bigger data sets spanning the full spectrum of disease and then validated against an external, but similar, sample. Such data sets were not available for us to conduct this analysis but would be useful for further research.
The exploratory valuation study found that bolt-on items for vision, hearing and tiredness significantly impacted on values of the health states. The direction and magnitude of differences depended on the severity of the health state. A full model to obtain values for all EQ-5D + vision health states was
Recommendations for further research
l Extend the reviews of the psychometric literature to more conditions.
l Undertake more primary research or analyses of primary data sets into the psychometric properties of GPBM particularly in cancer.
l Compare alternative statistical models in larger data sets, including those for EORTC QLQ-C30 and FACT-G.
l Develop a systematic programme of research into bolt-ons for EQ-5D.
Funding
This project was funded by the UK Medical Research Council (MRC) as part of the MRC-NIHR
methodology research programme (ref: G0901486) and will be published in full inHealth Technology Assessment; Vol. 18, No. 9. See the NIHR Journals Library website for further project information.
SCIENTIFIC SUMMARY
xxvi
Chapter 1
Introduction
T
his report addresses a range of important methodological issues arising from the use of generic and condition specific measures of health-related quality of life (HRQL) in the decision-making of the National Institute for Health and Care Excellence (NICE). It describes a series of studies undertaken to address the key questions of how to determine whether a generic measure of HRQL is valid for use in calculating quality-adjusted life-years (QALYs), what to do when the generic measure is not available (and specifically the use of‘mapping’techniques) and examines a new approach to dealing with situations where the generic measure is found to miss important components of HRQL for specific conditions (i.e. the use of‘bolt-on’dimensions). The rest of this chapter describes the rationale for looking at these questions and presents the key objectives of the research.Background
Generic preference-based measures (GPBMs) of HRQL are commonly used in the economic evaluation of health interventions. These instruments have many advantages, including that they can incorporate the impact of treatment or ill health on a multidimensional scale and can be combined with data on survival in the form of QALYs. Furthermore, they facilitate comparisons between interventions and across conditions, which is important if there is a need for consistency in decision-making between interventions or if there is a need to compare with a common benchmark or cost-effectiveness threshold. The questionnaires can usually be easily administered to patients for self-completion and the data can incorporate a reflection of the value associated with different levels of health (usually based on values from members of the general population).
In the UK, NICE has specified that Health Technology Assessments (HTAs) submitted to its Technology Appraisal programme should be based on an incremental cost per QALY framework and recommends the use of the EQ-5D as the preferred GPBM.1The EQ-5D descriptive classi
fication consists offive dimensions of health: mobility, self-care, usual activities, anxiety/depression, and pain/discomfort.2In the older and
most commonly used version, each dimension of health has three levels of severity; however, a new
five-level version has recently been published.3The 3-level version can describe 243 unique health states,
to which a preference value can be assigned based on a set of values obtained from a large UK general population survey.4
The decision by NICE to recommend the EQ-5D was, in part, a pragmatic decision.5It is now widely
recognised that the various GPBMs produce different values,6–8and this can be problematic for an
organisation wanting to make consistent, transparent and predictable decisions. The GPBMs, including EQ-5D, have been criticised for being insensitive or failing to capture important aspects of health.9,10While
NICE recommends the use of the EQ-5D for its HTAs, in itsGuide to the methods of technology appraisal,1
it recognises that the EQ-5D may not be an appropriate measure for all conditions.1NICE requests
evidence to show that EQ-5D is inappropriate for the condition of interest; however, it does not specify areas where EQ-5D is inappropriate, nor does it provide criteria to determine when a measure is appropriate for a particular condition or treatment.
as a result of new symptoms or side effects from treatment. However, judgements can be made transparently and systematically based on the totality of the evidence available. The reviews presented here draw on published research and established psychometric methods to establish the performance of the GPBMs.
In addition to acknowledging that the EQ-5D may not always be appropriate, the NICEGuide to the methods of technology appraisal1also acknowledges that EQ-5D data may not always be available. This
may be for a variety of reasons, such as planning the economic evaluation after the trial design, concerns about obtaining data directly from patients and concerns about the views of regulators regarding non-significant differences in HRQL between treatments. In these circumstances NICE suggests
incorporating data from other measures of health through the use of‘mapping’.‘Mapping’(sometimes referred to as‘cross-walking’) describes a method by which values obtained from GPBMs, such as EQ-5D, can be predicted from other measures or indicators of health.11,12No speci
fic guidance is provided on the best methods of mapping other than to state that it must be based on empirical analysis and the methods must be clearly described. In 2013, recommendations on the use of mapping were described;13however,
these acknowledge that there is limited evidence to provide clear guidelines on many aspects of mapping, in particular the most appropriate model specifications. A recent review of mapping functions showed use of a range of different models including linear models, tobit models, censored least absolute deviation (CLAD), two-part models (TPMs) and response mapping to predict quality of life (QoL).11Studies also report
a variety of methods to assess model and predictive performance including predicted mean and standard deviation (SD), median, Akaike information criterion (AIC), Bayesian information criterion (BIC),R2,
pseudo-R2, mean estimates across severity groups, root-mean-square error (RMSE) and mean square error.
A further issue in mapping is uncertainty, which is typically ignored. There is uncertainty in utility
measure weights, the mapping coefficients, the choice of coefficients and the choice of model and these have not been addressed in the literature.
The second section of this report aims to establish the most appropriate model specifications for mapping based on two separate data sets. The analysis draws on the results of the systematic reviews reported in
Chapter 2and focuses on conditions where the EQ-5D measure has been found to be appropriate based on the published evidence. An exploratory analysis demonstrates how the uncertainty in the estimates can be better incorporated into analyses.
The third section of the report examines an alternative method for dealing with the situations when the EQ-5D has been demonstrated to be inappropriate for a given condition owing to insensitivity or failing to cover an important dimension of HRQL. One option could be to use alternative GPBMs, but, as discussed above, this leads to a lack of comparability in the estimates compared with the standard EQ-5D approach and also may not cover missing dimension(s). Recently, there has been growing interest to explore an alternative approach by developing preference-based measures from existing and validated condition-specific measures of HRQL (for a full review of this approach, see the HTA monograph by Brazieret al.14and for recent examples, see papers by Yanget al.15,16). This approach can offer a useful
solution in some situations. There have, however, been concerns raised that these condition-specific preference-based measures also produce very different values to the GPBMs and so may compromise comparability17and these differences may continue to arise even when the methods of valuation
are designed to be similar with GPBMs.14
One possible solution to this problem is to not use comparable methods of valuation only, but also to keep the health state classification systems as similar as possible through the development of‘bolt-on’items to the EQ-5D or the GPBM of interest. Bolt-ons are dimensions that can be appended to another instrument and to which utility values can be attributed to the health states described by the instrument with the bolt-on. Previous research has examined the impact of modifying the EQ-5D descriptive system to include additional dimensions of health.18,19Krabbeet al.18valued EQ-5D health states including a
‘cognition’ dimension of health and found that it significantly impacted upon health state values.18More recently,
Yanget al.19developed a
‘sleep’dimension to add to the EQ-5D but found that it did not significantly
INTRODUCTION
2
impact on values.19The value of any potential
‘bolt-on’dimension to EQ-5D depends crucially on whether its inclusion significantly impacts on the values given to the EQ-5D health states. The design and
complexity of‘bolt-on’valuation studies will depend on how the values of the bolt-on levels are affected by the EQ-5D states accompanying it and whether the inclusion of the bolt-on items has a significant impact on the values given to the EQ-5D dimensions. Furthermore, the methods of bolt-on development and valuation are not well developed. Two studies are described in this report to develop potential bolt-ons to the EQ-5D, to quantify the impact they have on EQ-5D values and to assess the implications of this for future bolt-on developments. In undertaking this, a full valuation model is provided for one of the EQ-5D bolt-ons.
Aims and objectives of the report
The overall aim of the study was to develop methods for systematically incorporating information from condition-specific measures into the NICE decision-making framework. Specifically, the project had three related objectives:
1. To examine whether the EQ-5D and other commonly used generic HRQL measures are appropriate for use in calculating QALYs for NICE decision-making in selected specific conditions.
2. To develop mapping functions to predict EQ-5D data from condition-specific or clinical measures, to compare alternative model specifications and to conduct an exploratory analysis around the
incorporation of uncertainty in the predicted estimates.
3. To investigate the development and valuation of bolt-ons to expand the EQ-5D descriptive system for those conditions in which the EQ-5D is not appropriate.
The results from the analysis to meet thefirst objective are used to inform the second and third objectives. Mapping will not be successful if the measure to be predicted does not adequately capture HRQL;
Chapter 2
A systematic review of the
psychometric properties of generic preference-based
measures of health in four conditions
Introduction
The aim of the review reported in this chapter was to assess the reliability, validity and responsiveness of the EQ-5D, Health Utilities Index Mark 3 (HUI3) and SF-6D for measuring HRQL in four broadly defined conditions: visual disorders, hearing disorders, skin conditions and cancer.
The three GPBMs focused on (EQ-5D, HUI3 and SF-6D) were chosen to represent commonly used GPBMs of HRQL in NICE Technology Appraisals.20Speci
fically, as noted previously, the EQ-5D is recommended as the preferred measure by NICE and is the most commonly used measure in its Technology Appraisals.1,20
The HUI3 was chosen as it is commonly used internationally and is the second most frequently used in NICE Technology Appraisals.20The SF-6D was also chosen as it has properties considered important
by NICE (as a validated and generic measure of HRQL that also has a set of UK general population values elicited using a choice based method). In addition, the SF-6D questionnaire was derived from the short form questionnaire-36 dimensions (SF-36), which is widely used in clinical trials.
The four conditions were chosen to represent areas where the EQ-5D measure may not be appropriate based on previous published research21–24or concerns reported during the development of NICE
Technology Appraisals.25,26Previous research has reported that the generic instruments, particularly the
EQ-5D, do not adequately capture changes in health as a result of visual or hearing loss, butfindings are mixed.21–23,24In addition, the measurement of HRQL in these conditions has been the subject of debate
within NICE Technology Appraisals of treatments for these conditions.25,26The appraisals of treatments for
skin conditions by NICE have frequently relied upon data from condition-specific measures in analyses rather than directly using generic measures of HRQL. Finally, the condition for which treatments are most frequently appraised by NICE is cancer. There have been suggestions that generic measures, such as the EQ-5D, may not adequately reflect the effects of cancer and related treatments that are considered important to patients (e.g. fatigue); however, a comprehensive review of the evidence has not been previously reported. A similar review has been conducted to examine the appropriateness of the EQ-5D in mental health as part of another Medical Research Council (MRC) funded project.27,28
The rest of this chapter discusses the methods used for the systematic literature reviews, thefindings and results for the four conditions, each discussed separately, andfinally a brief discussion and conclusion is provided.
Methods
The generic preference-based measures
EQ-5D
The EQ-5D describes HRQL in terms offive dimensions: mobility, self-care, usual activities, pain/discomfort and anxiety/depression.2Each dimension is usually described in terms of three levels of severity, although a
version withfive levels has recently been published.3The health classi
SF-6D
Derived from the SF-36 and Short Form questionnaire-12 dimensions (SF-12) health questionnaires, the SF-6D has six dimensions (physical functioning, role limitation, social functioning, bodily pain, mental health and vitality) and each dimension has four to six severity levels.6,30Any patient who completes the
SF-36 or the SF-12 can be uniquely classified according to the SF-6D. The health classification system of SF-6D describes a total of 18,000 health states and a tariff of values for each health state is available for several countries, including the UK. The UK value set was obtained from valuations provided by 611 members of the general population using the standard gamble (SG) valuation method.30
Health Utilities Index Mark 3
Health Utilities Index is a group of GPBMs for measuring comprehensive health status and HRQL,
including Health Utilities Index Mark 1(HUI1), Health Utilities Index Mark 2 (HUI2) and HUI3. HUI3 has nine dimensions (vision, hearing, speech, ambulation/mobility, pain, dexterity, self-care, emotion and cognition) and each dimension has three to six levels. The health classification system of HUI3 describes almost a million unique health states and a tariff of values for each health state is available for Canada. The Canadian value set was obtained from valuations provided by 504 members of the general population using the visual analogue scale (VAS) and SG valuation methods.31
Search strategy and data identification
The search strategy aimed to identify relevant journal papers providing evidence on the reliability, validity and responsiveness of EQ-5D, HUI3 or SF-6D in the following four clinical conditions: vision disorders, hearing impairments, skin disorders and cancer.
Four separate search strategies were developed, one for each of the conditions. The search strategies were developed following consultation with experts in information resources and health economics. An iterative approach to the searches was adopted. The strategies consisted of a broad search to identify studies reporting the use of the GPBMs in patients with each of the four clinical conditions. The search included both free text and controlled terms. Free text words included‘euroqol’,‘hui3’,‘sf6d’(all with alternative spellings). Condition-specific terms were also included (seeAppendix 2for the full searches used). The following electronic databases were searched: BIOSIS (1969 to 2010), Cumulative Index to Nursing and Allied Health (CINAHL) (1982 to 2010), Cochrane Library comprising the Cochrane Database of Systematic Reviews (CDSR), Cochrane Central Register of Controlled Trials (CENTRAL), Cochrane Methodology Register, NHS Economic Evaluations Database (NHS EED) (1991 to 2010), EMBASE (1980 to 2010), MEDLINE (in process and non-indexed to 2010), PsycINFO (1806 to 2010) and Web of Science (1900 to 2010).
In addition, a database of studies held on the website of the EuroQol Group32was searched to check for
any missing papers reporting EQ-5D and to check that the search strategies were identifying relevant papers. Comparable databases for the SF-6D and HUI3 are not available. The search strategies are presented inAppendix 2.
The inclusion criteria were that (1) the study reported dimensions and/or index values for at least one of the generic instruments EQ-5D, HUI3 or SF-6D and (2) the study reported another measure of QoL [including VAS or EuroQol VAS (EQ-VAS), TTO, SG direct valuation of QoL or another utility measure] or a measure of clinical severity/symptoms that would enable an assessment of validity, responsiveness or reliability.
The condition-specific inclusion criteria were that the studies reported the above data for people with one of the following conditions: vision disorders, hearing disorders, skin disorders or cancer.
There was no restriction relating to the type of study or type of condition within the overall definitions. Owing to resource limitations, only English language studies were reviewed.
6
NIHR Journals Librarywww.journalslibrary.nihr.ac.uk
Data extraction
Data were extracted from the studies using a standardised set of forms developed for this study after reviewing forms used for similar studies in other disease areas.27The data extracted included general
characteristics of the study and participants, instruments used in the study, methods and results used in the study for assessment of reliability, construct validity and responsiveness. Data extraction for the different clinical conditions was undertaken by one member of the research team and summarised using items presented inTable 1.
Data analysis
Assessment of quality and relevance
For the review, of most importance was the relevance of the study in terms of the patient population and inclusion of evidence to establish the psychometric performance of the generic measures. Studies including a mixed population of patients (i.e. with various conditions) were only included if they reported
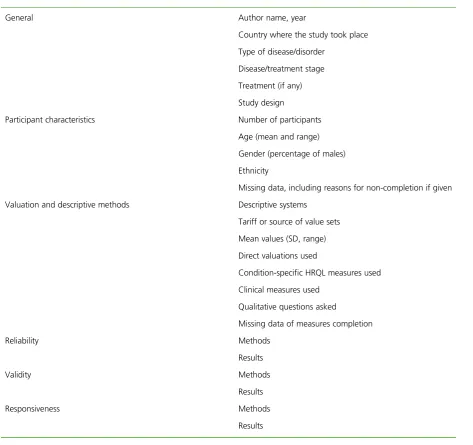
[image:36.595.59.533.321.766.2]health-related utility values or dimension responses for subgroups of patients with one of the four specific conditions being evaluated. Nevertheless, a judgment regarding the risk of bias for each study was
TABLE 1 Information extracted from included papers
General Author name, year
Country where the study took place
Type of disease/disorder
Disease/treatment stage
Treatment (if any)
Study design
Participant characteristics Number of participants
Age (mean and range)
Gender (percentage of males)
Ethnicity
Missing data, including reasons for non-completion if given
Valuation and descriptive methods Descriptive systems
Tariff or source of value sets
Mean values (SD, range)
Direct valuations used
Condition-specific HRQL measures used
Clinical measures used
Qualitative questions asked
Missing data of measures completion
Reliability Methods
Results
Validity Methods
Results
Responsiveness Methods