A STUDY OF THE EVOLUTION
OF CONCENTRATION
IN THE PRESS AND
GENERAL PUBLISHING INDUSTRY
IN THE UNITED KINGDOM
ducts, cycles and motorcycles, agricultural machinery, office machinery, textile machinery, civil engineering equipment, hoisting and handling equipment, electronic and audio equipment, radio and television receivers, domestic electrical appliances, food and drink manufacturing industries).
The aims, criteria and principal results of this research are set out in the document "Methodology of concentration analysis applied to the study of industries and markets", by Dr. Remo LINDA, (ref. 8756 --English version), September 1976.
In 1977 the research programme has been extended to the press and publishing industry. This particular volume has as its subject the evolution of concentration in the press and general publishing industry in the United Kingdom, including a detailed analysis of newspapers by categories, of regional markets, of school textbooks. The volume also contains the three Linda matrices of oligopolistic interdependence (Matrix no. 1 : Oligopolistic Inequality; Matrix no. 2: Comparative Performance; Matrix no. 3: Com-parative Growth Rates) referring to the publishing industry as a whole.
COMMISSION OF THE EUROPEAN COMMUNITIES
~/
A STUDY OF THE EVOLUTION
OF CONCENTRATION
IN THE PRESS AND
GENERAL PUBLISHING INDUSTRY
IN THE UNITED KINGDOM
--by ~ .. Fishwick
Cranfield School of Management
Manuscript finished in October 1977
© Copyright ECSC/ EEC/ EAEC, Brussels and Luxembourg, 1977 Printed in Belgium
The present volume is part of a series of sectoral studies on the evolution of concentration in the member states of the European Community.
Those reports were compiled by the different national Institutes and
experts, engaged b,y the Commission to effect the study programme in question.
Regarding the specific and general interest of these reports and the responsibility taken by the Commission with regard to the European Parliament, they are published wholly in the original version.
The Commission refrains from commenting, only stating that the responsibility for the data and opinions appearing in the reports, rests solely with the Institute or the expert who is the author.
Other reports on the sectoral programme will be published by the Commission as soon as they are received.
The Cranfield School of Management and the author individually wish to express thanks to all who have co-operated in this study. These include representatives of seven newspaper companies, the Advertising Association and Newspaper Publishers• Association; local
education offices and school teachers discussed with us our survey of educational schools and the teachers from 390 schools who completed questionnaires which involved them, in some instances, in hours of work.
Introduction
SECTION I - THE PUBLISHING INDUSTRY AS A WHOLE
Definitions
A. ANALYSIS OF SALES AND PRODUCTION OF PUBLISHED MATTER
1. Statistical Analysis
2. Overseas trade in published matter 3. Further analysis of sales of books
B. CONCENTRATION IN PUBLISHING AS A WHOLE Methodology
1. Trends in sales revenue and profits (Econ. Acitivity Units) 2. Some general comments regarding concentration
3. Standard concentration ratios and their interpretation 4. Analysis of other financial variables
Tables of Concentration for Enterprise Data and Matrices of Oligopolistic Interdependence
SECTION II - CONCENTRATION IN THE NEWSPAPER AND PERIODICALS INDUSTRY
Definitions
A. GENERAL SURVEY OF TRENDS IN THE U.K. PRESS 1. Total revenue
2. More detailed analysis of advertising 3. Trends in circulation
B. MORE DETAILED ANALYSIS OF NEWSPAPERS BY CATEGORY 1. National Dailies
2. National Sundays
3. Regional (or provincial dailies) 4. Regional Sundays
5. Local weeklies
C. THE DISTRIBUTION OF NEWSPAPERS AND PERIODICALS 1. Distribution of national newspapers and periodicals 2. Distribution of provincial newspapers
3. Newspaper retailers 4. Distribution margins
D. THE STRUCTURE OF THE NEWSPAPER PUBLISHING INDUSTRY 1. Selection of sample
2. Approach to analysis of concentration 3. Links between companies in the sample and
interests in small press companies
4.
Competitive media and investment in them by the Press
E. ANALYSIS OF NATIONAL CONCENTRATION
1 0
Analysis of Turnover and Profits
2.
Analysis of Circulation (copies sold)
F. REGIONAL MARKETS
G. ANTI-MONOPOLY LEGISLATION
&
LOCAL NEWSPAPERS
H. CONCENTRATION OF PERIODICAL SALES
SECTION III - SURVEY OF CONCENTRATION IN PUBLISHING OF SCHOOL TEXTBOOKS
A.
INTRODUCTION
B. DESCRIPTION OF SURVEY
C. STATISTICAL SIGNIFICANCE
D. ANALYSIS OF RESULTS - TOTAL MARKET
E. ANALYSIS OF RESULTS BY SUBJECT
APPENDIX A.
DEFINITIONS
&
BASIC PROPERTIES OF CONCENTRATION INDICES
APPENDIX B. HOLDINGS BY NEWSPAPER COMPANIES IN COMMERCIAL TELEVISION
AND RADIO. 30TH JUNE
1975.
1.
Television
2. Radio
APPENDIX C. MAP SHOWING PRESS REGIONS
APPENDIX D. PROFILES OF MAJOR COMPANIES
1.
Reed International
2. The Thomson Organisation
3. S. Pearson
&
Son Limited
75
79
79
83
86
91
92
94
94
94
97
98
100
103
108
108
109
111
112
112
Sales turnover profits
ALL of variables 01-08 + Net cahs flow
Net assets
Retail value of sales t/o
(market share)
Circulation (copies sold)
Circulation (titles)
1968-1975 EAU publishing
pp. 19-21
EAU Press 1968, 1973
&
1975p. 81
Enter~rises with matrices pp. 26-54
1975 periodicals
p. 93
1968-1975
(Press nationally) 1968 & 1975
p. 85
1976-77
S c h oo L text s
p. 100
Six regions of U.K.1975
p. 88
The terms of reference from the Commission of the European Communities define three topics for investigation: the evolution of concentration in publishing as a whole, a more detailed study of concentration in the publishing of newspapers and periodicals and another detailed study of the sale of books in schools. This report is divided into sections corresponding with these three topics. Section I includes an examination of trends in the publishing industry and an analysis of concentration of sales turnover and of all the other financial variables specified by the Conmission. 1 Section II contains a similar analysis of trends in the publishing of newspapers and periodicals (described more briefly as the Press). Section III is a report of a survey of stocks and purchases of textbooks in British schools in the academic year; the objective of this survey was to identify the degree of specialisation by publishers in particular subject areas.
SECTION I - THE PUBLISHING INDUSTRY AS A WHOLE Definition of Publishing
This study covers two industries as defined by the Business Statistics Office of the United Kingdom1
-Minimum List Headings 485 and 486: printing and publishing of national daily and Sunday newspapers, local newspapers published at least once per week and periodicals issued regularly at intervals exceeding 24 hours.
Minimum List Heading 489 (part): publishing of books, maps, music, religious tracts, almanacs etc.
As far as possible, printing activities not directly associated with the publication of these products have been excluded. These excluded activities are job and contract printing, production of banknotes, stamps, tickets, playing cards and similar printed matter. Where these activities are undertaken on the same premises as the production of published matter (e.g. job printing by a newspaper company) it has not always been possible to exclude them but any distortion is believed to be small.
A. ANALYSIS OF SALES AND PRODUCTION OF PUBLISHED ~1ATTER
1. Statistical Analysis
Table I-1 Analysis of Publishing Sales in Recent Years Value of sales (£ millions) at current prices. Press
Copy Sales Advertising Books Other
1968 227 255 127 31
1970 272 320 161 42
1973 362 496 222 73
1974 430 521 272 78
1975 531 548 332 98
1976 613 652 391 119
Sources: Census of Production 1968 and 1973
Business Monitor 1970, 1974, 1975 and 1976
Total
640 795 1153 1301 1509 1775
(The 1970 figures are adjusted for incomplete coverage on the basis of the two sets of figures published in the Business Monitor Series for 1971, quarter 4)
Figures relate to establishments with 25 or more employees.
Table I-1 shows newspapers and periodicals account for a dominant part of sales revenue from publishing in this country and that sale of advertising space is the major source of income for the Press.
Inflation seriously distorts comparisons over the period 1968 to 1976. Correction for inflation can take two forms:
a) adjustment to constant purchasing power, which is useful for comparison of the .. real11
value of expenditure on published material or the 11
real11
value of comp.any sales, or b) adjustment by a price index relating to published matter, which is useful for measuring
changes in the volume of production. Both adjustments are shown in Table
I-2:-Table I-2 Indices of Publishing Sales Turnover 1968-76 a) in terms of constant purchasing power - deflator used:
Index of Retail Prices (all items)
b) in terms of production volume (derived by manipulation of data published in the Business Monitor series)
(a) (b)
1968 90 n.a.
1970 100 100
1973 114.3 117
1974 111.3 113
1975 103.9 96
1976 104.9 99
Table I-2 shows a substantial rise in activity in publishing between 1970 and 1973; over this period the volume of production rose by 17 per cent and the real value of total sales by over 14 per cent. During the recession from 1973 to 1976 the real value of sales turnover fell sharply and there was an even greater fall in the volume of production. This difference was due to an increase in average price per copy of newspapers and periodicals approximately 1.3 times that in the index of all retail prices.
Table I-3 Production and Employment in Publishing 1970-76
(Second quarter of each year~
Newspapers
&
Periodicals Other Printing and PublishingProduction Emeloyment Production Employment
(1970=100) (OOOs) (1970=100) {OOOs)
1970 100 149 100 226
1971 98.2 146 95.8 220
1972 104.5 139 100.2 212
1973 119.1 138 103.5 212
1974 117.0 149 105.1 208
1975 99.1 136 99.3 206
1976 101 . 5 131 99.4 196
Source: Business Statistics Office and Dept. of Employment.
From Table I-3 it may be calculated that in the production of newspapers and periodicals, output per person employed in 1976 was only 15 per cent higher than in 1970 and was 10 per cent lower than in 1973. Overmanning in the Press was one of topics emphasised in the recent investigation by the Royal Commission on the Press. 1 The prospects for a significant increase in labour productivity with a highly organised skilled labour force and a background of heavy unemployment appear rather slender and negotiations in this respect seem to have progressed only slowly.
In other printing and publishing, increases in labour productivity have also been slow-in 1976, it was only 15 per cent greater than slow-in 1970 and was less than 4 per cent greater than in 1973. Increases in labour costs in relation to sales revenue have con-tributed to the decline of profitability in the publishing industry in recent years.
2. Overseas Trade in Published Matter
Exports and imports of newspapers and periodicals are fairly small in relation to the value of U.K. sales. In 1975, exports aMounted to only £27 millions, or about 5 per cent of the value of production. The main destination countries were Australia, New Zealand and the Irish Republic. Imports amounted to £11m. and were mainly from E.E.C. countries, especially Italy (£4m.) or from the U.S.A.
In the case of books, foreign trade is more significant. Table I-4 shows exports, home sales of U.K. producers and imports annually from 1970 to 1975.
Table I-4 Value of Trade in Books 1970-75 {£m.}
+ + Home sales
*
U.K.Exports Imports of U.K. eroducers market
1970 46.9 22.6 95.8 118.4
1971 59.7 25.9 107.8 133.7
1972 69.7 29.6 133.8 163.4
1973 72.2 31.6 142.1 173.7
1974 81.7 39.3 172.2 211.5
1975 101 .8 51.2 218.0 269.2
Sources: Overseas Trade Statistics and Business Statistics Office.
+Exports are valued f.o.h. {11
free on board11
value on leaving the U.K. port) while imports are valued c.i.f. (value on arrival at the U.K. port, including carriage, insurance and freight).
*
This column is derived by subtracting from sales by U.K. publishers the sales ofbooks exported directly or known to be destined to export. Because of time lags, the total value of this export production exceeds the value of exports shown by Overseas Trade Statistics. The sum of columns (1) and (3) of this table is consequently less than column (3) in Table I-1.
The books exported from the U.K. are more expensive in relation to weight than those imported. In 1975 the f.o.b. value of exports was 0.178 pence per gram while that of imports was 0.113 pence per gram. This is partly because imports include a higher prop-ortion of children's books with larger print but the principal reason is the predominance among exports of literary, technical and scientific books.
The largest single market for exports is the U.S.A., the destination of 23 per cent (by value) of books exported in 1975. Other English-soeaking countries accounted for much of the rest. The U.S.A. was the source of 40 per cent (by value) of books imported. Trade with other E.E.C. countries was less important, presumably because of language differences.
[image:16.575.100.503.119.267.2]3. Further Analysis of Sales of Books
In Section II of this report we examine in some detail the segmentation of the total market for newspapers and periodicals and in Section III we report on our survey of text-books used in schools. The market for text-books is very diverse and, because the topic is not covered elsewhere in this report, we have set out in Table 1-5 an analysis of sales of books by U.K. publishers in 1971, 1973 and 1975.
Table 1-5 Analysis of Book Sales by Value (£millions)
Hard-back 1971 1973
- -
1975School textbooks 15.5 19.7 28.1
Technical
&
Scientific 33.7 37.6 54.0Fiction, literature
&
classics 23.4 28.0 41.2
Children's 15.7 17.6 26.9
Other 39.5 49.9 80.7
Paper-back
School textbooks 14.2 17.2 28.2
Technical
&
Scientific 5.0 7.5 11.8Fiction, literature
&
classics 18.4 23.1 40.7
Children's 4.4 7.0 l 0. 3
Other 9.7 14.0 18.3
TOTAL 179.5 221.6 340.1
Source: Business Monitor Series
The proportion of sales turnover accounted for by paper-backs rose from 28.8 per cent in 1971 to 32.1 per cent in 1975. The data in Table 1-5 reveals no other substantial changes in the composition of book sales over the four year period.
B.CONCENTRATION IN PUBLISHING AS A WHOLE Methodology
The methodology for the measurement of the concentration has been laid down by the Commission of the European Communities. 1 A summary of this methodology is given in Appendix A of this report.
The analysis of concentration is based on two sets of data relating to samples of firms in the industry studied. The first of these refers to sales by establishments within the United Kingdom of the products of that industry; data are collected for sales turnover and any other variables from a list specified by the Commission for which data are available.
[image:17.576.62.443.181.431.2]This level of investigation is concerned with the Economic Activity Unit and the criterion for inclusion of any undertaking in the sample of companies studied is a minimum level of sales from U.K. establishments of the relevant products in a key year. In the present study, the firms included are the first 60 of a larger sample ranked according to sales turnover from published matter in 1970. Another firm which was formed in 1970 and became larger than some of these 60 was added to the sample from 1971 onwards 1.
The second set of data relates to all activities in the U.K. and elsewhere of any enter-prise included in the first sample, for which sales of the relevant products from U.K. establishments account for more than 50% of total world turnover in a given year (1970). The term 11
enterprise11
is defined here as in the official definition of the Business Statistics Office:- 11
a business consisting of one establishment, or of two or more establishments under common ownership or control.11
Effective control is deemed to occur when any single person or institution or an identical group of persons and/or institutions has an absolute majority of voting shares.
The difference between the Enterprise and Economic Activity Unit (EAU) approaches is demonstrated by the inclusion of the S. Pearson group in both (publishing of books, news-papers and periodicals accounted for 61 percent of group turnover in 1970) but the inclusion of Reed International Ltd. only in the EAU analysis(U.K. publishing accounted for 41 per cent of 1970 turnover).
Because Reed International is the firm with the largest publishing activities in the United Kingdom, its necessary exclusion from the Enterprise analysis means that more meaningful conclusions about concentration in publishing can be drawn from the EAU approach. However, for the EAU analysis, it was possible to obtain data for only two of the ten financial variables specified by the Commission. This is because companies with interests outside publishing normally provide a breakdown by product only for sales turn-over and net profits.
In order to study the concentration of other financial variables and to compare the relative financial strengths of the companies concerned, it is necessary to refer to the Enterprise analysis, even though some of the firms with the largest publishing interests are excluded.
The results of the EAU analysis for each of the calendar years are presented and discussed in the following part of the text,(Sub-sections 1-3). The more extensive tables for the Enterprise analysis produced by the Commission's own computer are described in Sections 4 and 5 below.
1. Trends in Sales Revenue and Profits- Economic Activity Units
Table I-6 shows the total values of sales and net profits before tax for the sample of firms annually from 1968 to 1975. The third column of data refers to the total of profits and losses by EAU's, the fourth column shows the total of profits only.
Table I-6 Turnover and Profits 1968-75 (Total of EAUs)
No. of Sales Total profits Total of No. of
firms turnover + losses profits profit-making firms ( £ mi 11.) (£ mill.) (£ mill.)
1968 59 577.1 60.03 60.11 56
1969 60 630.6 52.91 53.35 52
1970 60 695.0 43.62 48.31 53
1971 61 741.5 59.81 61.00 59
1972 61 851.7 94.12 94.12 61
1973 61 999.9 100.54 100.54 61
1974 61 1151 . 7 77.95 81 .18 59
1975 62 1368.2 93.44 96.76 61
N .B. Profits
=
net profits before tax, attributable to publishing Source: Company Accounts.Comparison with Table I-1 shows that the sample of around 60 firms accounts for the majority of sales turnover in publishing represented by establishments with 25 or more employees. The percentage covered by the sample was about 90 per cent throughout the period.
The data in Table I-6 can better he understood in terms of constant purchasing power. Table I-7 shows changes in each of the three totals in index form.
Table I-7 Indices of Turnover and Profits at Constant Purchasing Power (Total of EAUs)
(Deflator used is Index of Reta i 1 Prices - all items)
Sales turnover Profits + losses Profits only
1968 100 100.0 100.0
1969 103.6 83.5 84.2
1970 107.3 64.7 71.7
1971 104.7 81.2 82.7
1972 112.3 119.2 119.2
1973 120.7 116.7 116.7
1974 119.8 77.9 81.1
1975 114.6 75.2 77.8
years:-Table I-8 Net Profits before Tax as Percentage of Sales (Total of EAUs; 1 osses included in average)
% %
1968 10.40 1972 11.05
1969 8.39 1973 10.06
1970 6.28 1974 6.77
1971 8.07 1975 6.82
2. Some general comments regarding Concentration in Publishing
The combination in a single set of calculations of the Press and the publishing of books tends to distort slightly the analysis of concentration. Only four of the 61 firms incl-uded in the EAU analysis had significant sales of both books ~nd newspapers/periodicals. These
were:-S. Pearson and Son Ltd. (owners of the Financial Times, Westminster Press, Longmans and Penguin Books Ltd.);
Reed International (Mirror Group newspapers and the International Publishing Corporation with its book-publishing interests in Butterworth and Hamlyn); The Thomson Organisation (the Times, the Sunday Times, regional newspapers, a range of
periodicals and books published by Nelson, Pelham, Hamish Hamil-ton, and other subsidiaries;
Scottish and Universal Investments Ltd. (a major newspaper publisher in Scotland and owner of Holmes McDougall, book publishers).
Some indication of the distortion is provided by analysis of the EAU data for 1968 and comparison with the Census data for that year. The five-firm concentration ratio for each product range were as follows (our own EAU
data):-Publishing in total 59.5 per cent of the totals Newspaper
&
Periodicals 66.9 for the sample of Other publishing 42.8 .. 59 firms.The Census of Production for 1968 gave the five-firm ratio for published books as only 32.2 per cent. The discrepancy between this and our own estimate for books and other publishing is explained by the fact that 23 of the 59 firms in the 1968 sample did not publish books at all. This means that the sample included only 36 publishers of books and, while we are satisfied that these were the 36 largest publishers, the structure of book publishing was - and remains - fairly atomistic. The 1968 census showed 88 separate enterprises employing 25 or more people, and there was a large number of book publishers operating on an even smaller scale and accounting for 14 per cent of book sales. 1
Even in the newspaper/periodical sub-sector the concentration ratios overlook the existence of a large number of small companies not included in our sample.Data are published on the distribution of these companies and these are analysed in Section II below.
[image:20.575.151.447.68.185.2]3. Standard Concentration Ratios and their Interpretation
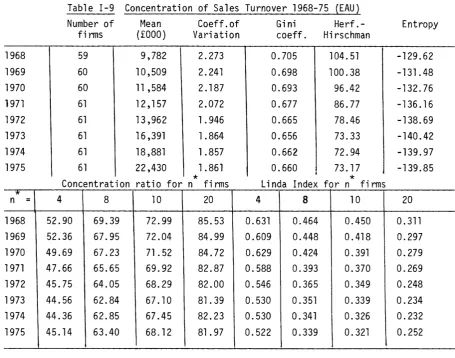
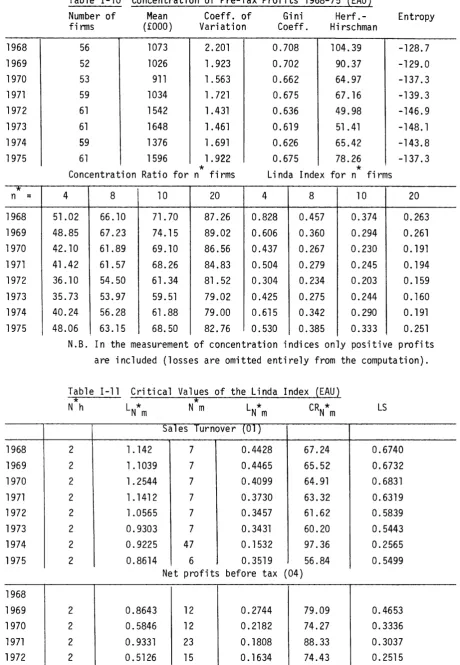
Tables 1-9 to I-ll show values of the standard concentration ratios for turnover and profits annually from 1968 to 1975, applied to the EAU data.
1968 1969 1970 1971 1972 1973 1974 1975 "'C n
=
1968 1969 1970 1971 1972 1973 1974 1975
Table I-9 Concentration of Sales Turnover 1968-75 (EAU)
Number of Mean Coeff.of Gini
Herf.-firms (£000) Variation coeff. Hirschman
59 9,782 2.273
60 10,509 2.241
60 11 '584 2.187
61 12 '157 2.072
61 13,962 1. 946
61 16 ,391 1.864
61 18,881 1 .857
61 22,430 1. 861
*
Concentration ratio for n firms
4 8 10 20
52.90 69.39 72.99 85.53 52.36 67.95 72.04 84.99 49.69 67.23 71.52 84.72 47.66 65.65 69.92 82.87 45.75 64.05 68.29 82.00 44.56 62.84 67 010 81.39 44.36 62.85 67.45 82.23 45.14 63.40 68.12 81 0 97
0.705 104.51 0.698 100.38 0.693 96.42 0.677 86.77 0.665 78.46 0.656 73.33 0.662 72.94 0.660 73.17
*
Linda Index for n firms
4 8 10
0.631 0.464 0.450 0.609 0.448 0.418 0.629 0.424 0.391 0.588 0.393 0.370 0.546 0.365 0.349 0.530 0.351 0.339 0.530 0.341 0.326 0.522 0.339 0. 321
Entropy -129.62 -131.48 -132.76 -136. 16 -138.69 -140.42 -139.97 -139.85 20 0.311 0.297 0.279 0.269 0.248 0.234 0.232 0.252
Table I-9 shows a distinct decrease in concentration in publishing from 1968 to 1973. All the indices show a progressive annual decrease over this period. After 1973 there are indications of stability. From Table 1-11 below, which shows critical values of the Linda index, it will be seen that this Index shows the existence in each of the years 1968 to 1973 of an oligopoly group of seven enterprises. Table I-ll also shows that their combined share of industry sales fell from 67.2 per cent in 1968 to 60.2 per cent in 1973. The seven companies concerned and their individual shares of the market over the complete seven year period are shown in Table I-12.
[image:21.575.52.508.131.489.2]1968 1969 1970 1971 1972 1973 1974 1975 "'I:
n
=
1968 1969 1970 1971 1972 1973 1974 1975 1968 1969 1970 1971 1972 1973 1974 1975
•
1968 1969 1970 1971 1972 1973 1974 1975Table 1-10 Concentration of Pre-Tax Profits 1968-75 (EAU}
Number of Mean Coeff. of Gi ni Herf.- Entropy
firms (£000) Variation Coeff. Hirschman
56 1073 2.201 0.708 104.39 -128.7
52 1026 1. 923 0.702 90.37 -129.0
53 911 1. 563 0.662 64.97 -137.3
59 1034 1. 721 0.675 67.16 -139.3
61 1542 1. 431 0.636 49.98 -146.9
61 1648 l. 461 0.619 51.41 -148.1
59 1376 l. 691 0.626 65.42 -143.8
61 1596 1.922 0.675 78.26 -137.3
* *
Concentration Ratio for n firms Linda Index for n firms
4 8 10 20 4 8 10 20
51.02 66.10 71.70 87.26 0.828 0.457 0.374 0.263 48.85 67.23 74.15 89.02 0.606 0.360 0.294 0.261 42.10 61.89 69.10 86.56 0.437 0.267 0.230 0.191 41 .42 61.57 68.26 84.83 0.504 0.279 0.245 0.194 36.10 54.50 61.34 81.52 0.304 0.234 0.203 0.159
35.73 53.97 59.51 79.02 0.425 0.275 0.244 0.160 40.24 56.28 61.88 79.00 0.615 0.342 0.290 0.191
48.06 63.15 68.50 82.76 0.530 0.385 0.333 0.251 N.B. In the measurement of concentration indices only positive profits
are included (losses are omitted entirely from the computation).
Table 1-11 Critical Values of the Linda Index (EAU}
*
N h LN*m N m
Sales Turnover (01)
2 1.142 7 0.4428
2 1.1039 7 0.4465
2 l. 2544 7 0.4099
2 1.1412 7 0.3730
2 l . 0565 7 0.3457
2 0.9303 7 0. 3431
2 0.9225 47 0.1532
2 0.8614 6 0.3519
Net profits before tax (04)
2 0.8643 12 0.2744
2 0.5846 12 0.2182
2 0.9331 23 0.1808
2 0.5126 15 0.1634
2 0.7452 34 0. 127 5
2 1.1029 37 0.1333
2 0.8299 14 0.2747
CR N
*
m [image:22.575.68.529.78.744.2] [image:22.575.68.525.460.786.2]Table 1-12 Shares of Industry Sales of Seven Largest Companies %of total publishing sales in year stated
1968 69 70 71 72 73 74 75
I PC/ Reed 26.3 25.6 25.3 23.2 21.1 19.6 19.4 18.9
Thomson 11.5 11.6 10. l 10. l l 0.0 10.6 10.5 11.0
Assocd. News 7.9 7.6 7.1 6.4 6.3 6.3 6.5 6.1
Beaverbrook 7.2 7.6 7.3 7.1 7.0 6.6 6.3 5.9
Pearson 6.5 5.5 6.7 7.3 7.6 7.8 8.0 9.1
Telegraph 4.1 3.9 3.7 4.1 4.3 3.9 3.7 3.4
News I ntl. 3.7 3.8 4.9 5.2 5.4 5.4 5.6 5.9
- -
- -
- -
- -
- - - -- -
-67.2 65.5 64.9 63.3 61.6 60.2 60.0 60.3
The main reasons for the comparative decline of some of the largest publishing companies are changes in the relative importance of different sectors of the Press. The circulation of the more popular daily newspapers fell during the survey period and there was also a sharp drop in the circulation of many of the general interest magazines. These changes are discussed in Section II which is concerned with concentration in the Press.
It is important to emphasise that the ranking of net profits is different from that of sales turnover. The seven largest companies in terMs of sales accounted for 67 per cent of turnover and 60 per cent of profits in 1968 ; by 1973 the proportions had fallen to 60 and 44 per cent respectively. In the difficult years of 1974 and 1975 some of the largest companies made losses.
In the analysis of market shares we have calculated the Index of Dynamism also defined by the Commission.1 For sales turnover and net profits the values of this Index in each year were as follows
:-1968-9 1969-70 1970-1 1972-3 1973-4 1974-5
D
=
ait - ait-1 . 100 !ait~ait-1
-2-Table 1-13 Index of Dynamism (EAU)
Sales turnover (01) Net profits (04)
3.46 12.91
3.78 15.90
4.28 17.85
3.17 14.85
3.03 16.44
3.85 36.03
[image:23.575.57.506.73.265.2]Because net profits represent a balance between flows, their distribution would normally be expected to change much more than that of sales turnover. The Index of Dynamism for sales turnover is unusually low,. The progression away from concentration indicated by the analysis of the concentration indices has been a steady one.
An investigation of the possibility of a statistical relationship between size and profit margin (net profits as percentage of sales versus absolute size of sales) produced no significant correlation. This computation was undertaken both with data ·for individual years and with averages for the eight years. The reason for this absence of correlation
is believed to be the compensating for economies of scale on the one hand by the relative decline of those particular activities (especially general periodicals and "popular" national newspapers) which are carried out by the largest publishing groups.
4. Analysis of Other Financial Variables - Enterprise Tables
The enterprise analysis is based on data for world-wide, all-product operations of those enterprises of whose turnover at least 50 per cent is derived from publishing activities in the United Kingdom. The principal companies included in the EAU analysis but excluded from the Enterprise Tables are the following
:-British Electric Traction Ltd. British Printing Corporation Ltd. Granada Group Ltd.
Reed International Ltd. Thomas Tilling Ltd.
U.K. publishing turnover 1975 (£m)
12.3 32.9 5.4 258.9 10.9
Total world-wide turnover 1975
437.1 127.5 ll9.6 1063.6 625.6
Reed International obtained nearly 19 per cent of publishing sales in 1975 (26 per cent in 1968- see Table l-12 above) and the other four companies obtained a coMbined share of 4.5 per cent. The exclusion of Reed International from the Enterprise analysis affects the interpretation of the Tables of Concentration.
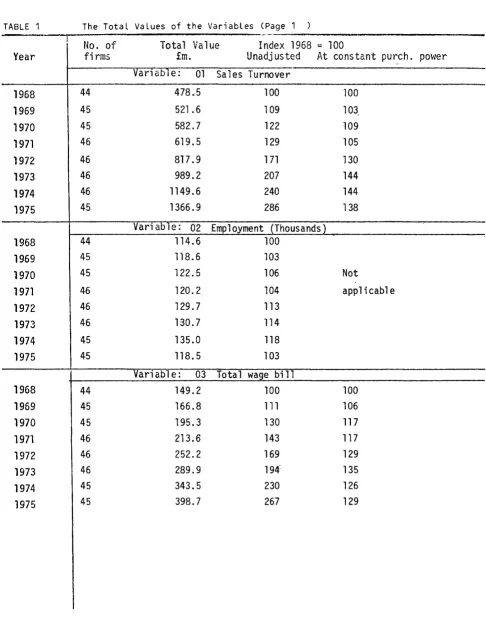
Table l shows the grow~h of the total for all enterprises in the sample with positive values of the variable concerned in any one year. It is interesting to note that the total value of sales turnover rose more quickly after 1972 than the total of the wage-bill. This may seem a paradox for an industry in which rising labour costs are blamed for
increasing financial difficulties. Much of the explanation lies in the inclusion in sales turnover of that from overseas operations, the sterling value of which has appreciated with the devaluation of the pound. The effects of devaluation are also evident in the data for total exports.
particularly volatile be even more evident.
if losses as well as profits were included this instability would
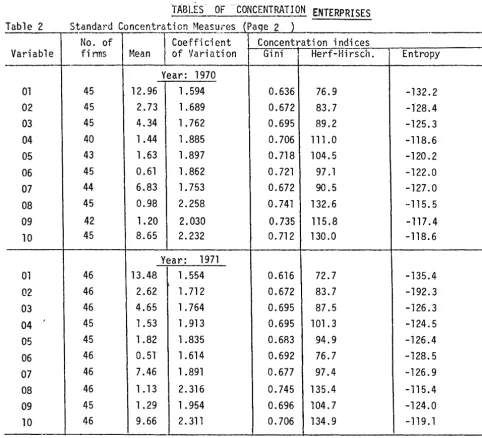
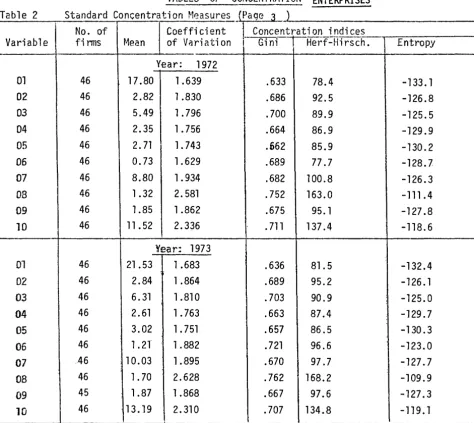
Table 2 shows the values of the mean of each variable, the coefficient of variation, the Gini, Herfindahl-Hirschman and Entropy measures of concentration in each of the years 1968-1974 (with data added for 1975 in the case of all variables except 06, gross additions to fixed assets). Most of the coefficients show sales turnover to be the least
concentrated of the ten variables in each of the eight years. This result, which casts doubt upon the increasingly-accepted theory that sales revenue maximisation is the primary objective of business, is consistent with results of most of the other studies undertaken by and for the Commission of the European Communities in this series.
Exports are more concentrated than the other variables mainly because exporting is
confined principally to book publishers and some of the companies included in the analysis do not publish books.
The concentration of equity capital (07- also known as 11
Shareholders• funds11
) is understated
in these Tables because some enterprises have significant minority holdings in others and the total value of equity is consequently over-stated. These inter-company holdings are confined mainly to the Press sub-sector and, since they also affect companies not included in the Enterprise analysis, they are listed in full in Table II- in the next section. The total value of the double-counted equity in the Enterprise analysis was £8.0 millions in 1975. ~Jhile this is only 1.5 per cent of the total figure for equity capital in that year, the degree of concentration is under-stated in that control is in a smaller number of
groups. The implications for competition are discussed in Section II.
Table 3 shows the concentration ratios and Linda coefficients for each of the ten
variables in each of the seven years. For sales turnover, the Linda coefficients indicate the existence of an oligopoly group of six enterprises in 1968 and of five enterprises from 1969 onwards. A similar distinct size-group is shown for the first four years in the Linda analysis of employment and, throughout the period, in the analysis of wage-bill. It is interesting to note that, except in occasional years, no oligopoly groupings are identified for any of the other variables. Although the concentration of sales turnover is less than that of the other variables, there appears to be a distinct oligopoly
11
threshold11
for this variable which is not observed for any of the others.
The three 11
matrices of oligopolistic interdependence .. which follow the Tables of Concentration are described by Linda in some detail 1 and only brief comments on interpretation are set out in this text.
Matrix No. 1 shows the ranking of each of the ten variables according to two criteria - the values of Lh*h and of LS (see Appendix A). The 11
Score11
in the body of the matrix is the sum of of the two rankings. The total 11
Scores11
of the variables over the eight years can be used to rank them according to their comparative inequality. In the case of profits, the total score is 80 while that for sales turnover is 95. This appears to lend some further
support to Linda • s finding 1 that the dis tri buti on of profits is generally more concentrated than that of sales turnover, though the evidence is less strong than corre~ponding evidence from other studies.
In only two of the eight years (1969-1976) exports again appear as the variable with the greatest inequality of distribution. The reason for this (the fact that many ne~;Jspaper
companies have negligible exports) has already been explained.
Matrix No. 2 is presented for only two years. (1968 and 1973), chosen to illustrate the entire period. The symbols used in this matrix are as follows
:-Rank
1 r
=
ranking of enterprises according to performance ~atio 2r net ~rofits before tax
tota sales turnover
Rank 2 = ranking of enterprises according to performance ratio 2r
2r
=
net profits before tax equity capitall x
=
ranking by sales turnover7 x
=
ranking by equityThe score in the matrix for each firm is the sum of Rank 1 and Rank 2. Where a company is among the top 13 according to one performance ratio but not according to the other the total score (the addition of the two rankings) is shown in parentheses at the end of the column or row.
The numbers representing each firm are merely for identification (Because some of the most profitable companies in the survey period were very small, the use of alphabetic codes to designate size proved impracticable).
Few conclusions can be drawn from Matrix 2
-(a) The rankings by the two criteria vary substantially. A major reason for this is the existence of minority interests in some of the publishing companies ; another is variation in the amount of 11
gearing11
(i.e., the extent to which companies use long-term loans as opposed to equity capital). Diversity of policy regarding asset revaluation during the period of rapid inflation may also have distorted the equity figures.
(b) The relationship between size and performance is very weak, as we have already explained on page 13 above, because economics of scale have been offset by changes in the composition of market demand.
A complete statistical investigation, in which each of the following regression calculations was undertaken, yielded no statistically significant correlation.
net profit before tax I sales turnover v sales turnover
II II II I equity v equity
II II II I net assets v net assets
cash flow before tax I sales turnover v sales turnover
II II II I equity v equity
II II II II I net assets v net assets
cash flow after tax I sales turnover v sales turnover
II II II II I equity v equity
II II II II I net assets v net assets
Matrix No. 3 shows the ranking of firms based on growth bebJeen successive years of sa 1 es turnover (Rank 1, with the growth shown as 1 c) and of net profits (Rank 4 with the growth shown as 4c).
The growth rates are expressed as absolute changes in the company•s percentage share of the total value of the variable achieved by all companies. For example, company 53 held 1.38 per cent of sales turnover in 1968 and 2.43 per cent in 1969, so that lc for 1968-9 was 1 .05. In the case of profits, only positive values are used for derivation of the tot a 1.
X company•s share of turnover in the earlier of the two years. 4 X company•s share of profits in the earlier of the two years.
The score in the matrix is the sum of the two rankings. As in Matrix 2, if a company falls within the first 12 according to one ranking but not according to the other, its 11
score .. is shown at the end of the column or row in which it appears.
This matrix has been constructed on the basis of the EAU data, because these more
TABLES OF CONCENTRATION
-
ENTERPRISE ANALYSISPlease refer to p. 13 for interpretation of ~P· 17 - 38.
TABLE 1 The Total Values of the Variables (Page 1 )
No. of Total Value Index 1968 = 100
Year firms
£m.
Unadjusted At constant purch. pm-JerVan able: 01 Sa 1 es Turnover
1968 44 478 .. 5 100 100
1969 45 521 .6 109 103.
1970 45 582.7 122 109
1971 46 619.5 129 105
1972 46 817.9 171 130
1973 46 989.2 207 144
1974 46 1149.6 240 144
1975 45 1366.9 286 138
Van able: 02 Employment (Thousands)
1968 44 114.6 100
1969 45 118.6 103
1970 45 122.5 106 Not
1971 46 120.2 104 applicable
1972 46 129.7 113
1973 46 130.7 114
1974 45 135.0 118
1975 45 118.5 103
Variable: 03 Total wage bill
1968 44 149.2 100 100
1969 45 166.8 111 106
1970 45 195.3 130 117
1971 46 213.6 143 117
1972 46 252.2 169 129
1973 46 289.9 194·- 135
1974 45 343.5 230 126
[image:28.577.58.545.119.739.2]TABLES
OF
CQNCENTRAT I ON - ENTERPRISE ANALYSIS Table 1 The Total·-·- Values of the Variables (Page 2 )
No. of Total Value Index 1968 = 100
Year firms £m. Unadjusted At constant purch. power Varia 51 e: 04 Net Profits before tax
1968 42 56.5 100 100
1969 38 53.7 95 90
1970 40 57.6 101 91
1971 45 68.7 121 99
1972 46 108.1 191 145
1973 46 119.9 212 148
1974 43 90.6 160 96
1975 43 108.2 192 93
Van able: 05 Cash flow
1968 43 68.2 100 100
1969 42 65.1 95 91
1970 43 70.0 102 92
1971 45 81.7 119 98
1972 46 124.4 182 139
1973 46 138.6 203 141
1974 43 119.9 176 106
1975 43 132.0 194 94
Variable: 06 Gross cap1tal eipend1 tu re
)968 44 17.92 100 100
1969 45 26.50 147 140
1970 45 27.25 152 136
1971 46 23.61 131 107
1972 46 33.41 186 142
1973 46 55.79 31T 217
1974 46 63.21 352 211
TABLES OF CONCENTRATION - ENTERPRISES
Table 1 The Total Values of the Variables (Page 3 ) No. of Total Value Index 1968
=
100Year firms
£m.
Unadjusted At constant purch. po\·Je) .. Var1a6le: 07 E:qu1 ty Cap1 ta 1 ~Sfiarefioloers' funosJ1968 44 257.9 100 100
1969 45 278.6 108 102
1970 44 300.4 116 104
1971 46 342.8 132 108
1972 46 404.1 156 119
1973 46 460.9 178 125
1974 45 486.9 189 113
1975 45 542.7 210 102
Var1 ao1e: 08 Exports
1968 44 34.9 100 100
1969 45 36.9 105 100
1970 45 44.3 126 113
1971 46 51.7 148 121
1972 46 60.4 173 132
1973 46 78.0 223 156
1974 45 99.2 284 170
1975 45 134.8 387 187
Variable: 09 Net Cas-n f1 ow
1968 43 48.1 100 100
1969 42 44.8 93 88
1970 42 50.6 105 94
1971 45 57.8 120 98
1972 46 85.1 176 135
1973 45 84.0 174' 122
1974 43 64.8 135 81
1975 42 128.4 267 129
Variable: 10 Net assets
1968 44 342.9 100 100
1969 45 348.2 101 96
1970 45 388.9 113 101
1971 46 443.9 129 105
1972 46 529.3 154
117
1973 46 606.0 176 123
1974 45 677.9 198 120
TABLES OF CONCENTRATION ENTERPRISES Tab·le 2 Standard Concentration Measures (Paqe 1 }
No. of Coefficient
~
CQncentrati on _ii.idi~~~_,-.
Variable fi nns ~1ean of Variation Gini 1 Herf-Hirsch. Entropy
Year: 1968
01 44 10.88 1.680 .647 85.0 -129.4
02 44 2.60 1. 715 .673 87.6 -126.9
03 44 3.39 1. 789 .692 93.3 -124.2
04 42 1.35 1 .797 .684 98.4 -123.5
05 43 1.59 1.814 .690 97.5 -123.7
06 44 0.41 1.582 .674 77.9 -128.5
07 44 5.86 1.805 .675 99.3 -124.9
08 44 0.79 2.068 .747 117.2 -115.8
09 43 1 .12 1. 991 .715 112.8 -119.4
10 44 7.79 2.256 . 711 135.3 -116.9
·-Year: 1969
I
01 45 11 .60 1.642 .643 R0.3 -131.3
02 45 2.64 1.685 .672 83.5 -128.5
03 45 3. 71 1.757 .691 88.9 -125.8
04 38 1.41 1.609 .673 92.0 -122.3
05 43 1. 55 1.694 .694 90.0 -123.6
06 45 0.59 1.821 .703 93.8 -124.1
07 45 6.19 1. 749 .675 91.9 -126.9
j_J_:~
0.82 1 .927 .718 102.5 -121.31 .07 1. 813 .710 99.7 -120.7
I ABLES OF --CONCENTRATION ·ENTERPRISES
Table 2 S~andard Concentration ~1eas~!'es (Paqe 2 )
-No. of Coefficient Concentration indices
Variable fi nns Mean of Variation Gini Herf-H1rsch. Entropy Year: 1970
01 45 12.96 1. 594 0.636 76.9 -132.2
02 45 2.73 1.689 0.672 83.7 -l28.4
03 45 4.34 1.762 0.695 89.2 -125.3
04 40 1 .44 1 .885 0.706 111.0 -118.6
05 43 1.63 1.897 0. 718 104.5 -120.2
06 45 0.61 1.862 0.721 97.1 -122.0
07 44 6.83 1.753 0.672 90.5 -127.0
08 45 0.98 2.258 0. 741 132.6 ··115. 5
09 42 1.20 2.030 0.735 115.8 -117.4
10 45 8.65 2.232 0.712 130.0 -118.6
Year: 1971
01 46 13.48 1.554 0.616 72.7 -135.4
02 46 2.62 1. 712 0.672 83.7 -192.3
03 46 4.65 1.764 0.695 87.5 -126.3
04 45 1.53 1. 913 0.695 101.3 -124.5
05 45 1.82 1 .835 0.683 94.9 -126.4
06 46 0.5l 1. 614 0.692 76.7 -128.5
07 46 7.46 1 .891 0.677 97.4 -126.9
08 46 1 .13 2.316 0.745 135.4 -115.4
09 45 1. 29 1.954 0.696 104.7 -124.0
[image:32.581.60.542.70.507.2]TABLES . OF--· CONCENTRATION· ·ENTERPRISES
-No. of
I
Coefficient Concentration indicesVariab 1 e fi nns t~ean of Variation
r-
Gi ni-IRerf.:H; rsch. Entropys
ta nda rd Concentration ~leas ures(r
a qe_3_Table 2
Y-ear: 1972
01 46 17.80 1.639 .633 78.4 -133.1
02 46 2.82 1 .830 .686 92.5 -126.8
03 46 5.49 1.796 .700 89.9 -125.5
04 46 2.35 1. 756 .664 86.9 -129.9
05 46 2. 71 1. 743 .662 85.9 -130.2
06 46 0.73 1.629 .689 77.7 -128.7
07 46 8.80 1.934 .682 100.8 -126.3
08 46 1.32 2. 581 .752 163.0 -111.4
09 46 1.85 1 .862 .675 95.1 -127.8
10 46 11 . 52 2.336 . 711 137.4 -118.6
Year: 1973
01 46 21 .53 1 .683 .636 81.5 -132.4
02 46 2.84 1 .864 .689 95.2 -126.1
03 46 6. 31 1 .810 .703 90.9 :
-125.0
:
04 46 2.61 1. 763 .663 87.4 -129.7
05 46 3.02 1. 751 .657 86.5 -130.3
06 46 1.2l 1.882 . 721 96.6 -123.0
07 .46 : 10.03 1.895 .670 97.7 -127.7
i
08 46 1. 70 2.628 .762 168.2 -109.9
09 45 1.87 1.868 .667 97.6 -127.3
[image:33.582.38.513.77.500.2]TABLES OF CONCENTRATION ENTERPRISES
Table 2 Standard Concentration Measures (Page 4 )
---No. of Coefficient Concentration indices
Variable firms ~1ean of Variation
---r---
Gini Hert-Hirsch. Entropy-Year: 1974
01 46 25.00 1. 658 .639 81.5 -131.7
02 46 2.93 1 .832 .676 94.7 -126.7
03 46 7.47 1.799 .697 92.1 -124.9
04 44 2.06 1.687 .644 87.4 -129.4
05 44 2.73 1. 601 .643 81.0 -130.3
06 46 1.41 1.579 .680 75.9 -129.2
07 46 10.58 1. 903 .659 100.4 -127.7
08 37 2.68 2.330 .699 173.8 -109.3
09 44 1.47 1.855 .656 101.0 -126.4
10 46 14.73 2.263 .707 133.1 -118.5
Year: 1975
01 45 30.38 1.649 .627 82.7 -131.7
02 45 2.64 1.656 .657 83.1 -129.4
03 45 8.86 1 .815 .689 95.4 -124.4
04 43 2.52 1. 751 .661 94.6 -126.1
05 43 3.07 1. 727 .657 92.6 -126.5
06
-
-
not available-
-
-07 45 12.06 1.873 .671 100.2 -125.7
08 36 3.75 2.199 .732 162.2 -105.7
09 42 3.06 2.982 .779 235.6 - 97.6
TABLES OF CONCENTRATION - ENTERPRISES Table 3 Linda indices (L) and Concentration Ratios (CR) (Page 1 )
No. of firms = 4 8 10 N"kh L N"km L
Variable: 01 Sales Turnov r
1968 CR 51.7 68.5 72.8 2 .690 6 .361
L .420 .405 .377 LS= 0.472
1969 CR '+::1.0 b!. ts 72.5 2 .785 5 .340
L .396 .364 .338 LS=O. 509
1970 CR 48.1 67.0 71.8 2 .626 5 .306
L .385 .355 . 331 LS=O. 449
1971 CR
4o.z
b4.4
0~.4z
.~IY 0 .::SJJL .402 .340 .309 LS=O. 551
1972 CR 48.0 65.6 70.1 3 . 573 5 .363
L .448 .364 .344 LS=O .472
1973
CR 49.3 66.1 70.6 3 .597 5 .398L .478 .376 .354 LS= 0. 507
1974 CR 49.5 66.0 71.2 3 . 571 5 .404
L .470 .373 .334 LS=0.498
wrs---c-R 50.3 66.3 /I. 2 3
.ooo
5 .417L .464 .377 .343 LS=0.488
Variable: 02 Employment
•
1968
CR
53.2 69.0 74.0 2 . 513 5 .356L .399 .406 .355 LS= 0. 422
1969 CR t>l.5 68.8 73.9 2 .543 6 .358
L .399 . 371 .334 LS=0.418
1970 CR 51.3 68.ts 73.8
z
.~zz !) .::St>ZL .404 .379 .336 LS=0.427
1971
c~~
51.2 .419 67.7 .382 73.1 .327 2 . 507 LS=0.449 5 .3tl2T972--rR .. 52.9 69.3 74.2 2 .649 7 .409
L .508 .413 .366 LS= 0. 509
T973--CR1 53.7 70.3 75~0 2 .650 21 .265
L . 523 .415 .376 LS=0.379
1974~ 53.0 69.1 73.9 2 .704 17 .276
L .558 .428 .382 LS=0.411
1975 CR 50.3 67.8 73.3 2 .548 13 .268
TABLES OF CONCCNTR,~\TION ENTERPRISES Table 3 Linda indices (L~ and Concentration Ratios (CR) (Page 2 )
No. of firms
=
4 8 10 N h * L N m .·k L-·--- ..
-Variable: 03 Uage bill
1968 CR 55.8 72.1 76.5 2 .686 5 .348
L .366 .423 .387 LS= 0.460
19b9---cR-f--·
54.1 71.9 76.6 2 .693 5 .347
L .354 .362 .350 LS= 0.459
1970 CR 53.7 72.2 77.0 2 .694 5 .326
L .360 .366 .346 LS= 0.455
1971"- Cf~ 52.7 71.6 76.3
-
2 .648 5 .320L .368 .353 . 341 LS= 0.456
1972 CR 53.3 71.5 76.7 2 .525 5 .343
L .392 .368 .339 LS= 0.441
T9f3 CR 53.6 72.5 77.4 2 .506 5 .327
L .385 .360 .349 LS= 0.425
~L"R 53.9 71.9 77.0 2 .501 5 .354
L .411 . 371 .348 LS= 0.437
1975 CR 54.3 71.9 77.2 2 .537 5 .385
L .467 .394 .357 LS= 0.477
--
.._____
-Variable: 04 Net profi tc before tax
1968 CR 54.7 70!7 76.5 2 .687 5 .483
L .533 .407 .346 LS= 0. 571
T969 ___ CR-
1----11 .267
52.3 71.8 78.8 2 .542
L .478 .335 .283 LS= 0. 388
T970 ___ CR--·
73.7 79.8 3 .859 11 .332
54.6
L .641 .386 .339 LS= 0. 517
197T ____ CR-r· 52.1 70.6
76.5 2 1. 203 23 .249
H7~~
.580 .380 .332 LS= 0.39449.4 65.2 71.1 2 1.052 30 .202
. 515 .378 . 319 LS= 0.321
I
1~3
c~j
50.5 66.7 71.9 2 .847 31 .196.510 .393 .347 LS= 0.319
19/4
~-I
48.2 67.2 73.4 2 1. 205 11 .297. 541 .340 .298 LS= 0.491
!
T915--CR-- 52.1 69.4 74.1 2 .929 32 .206
L .536 .377 .363 LS= 0.329
I
I
TABLES OF CONCENTRATION ENTERPRISES
Table 3 Linda indices (L} and Concentration Ratios {CR) (Page 3 )
*
_'ICNo. of finns = 4 8 10 N h L N m L
Variable: 05 Cash flow
1968 CR 54.1 70.7 76.6 2 .682 11 .313
L .543 .405 .340 LS= 0.460
1969 CR 51.7 71.9 78.4 2 .512 11' .262
L .474 .309 .280 LS= 0.377
1970 lR 53.6 73.1 79.5 2 . 781 11 .307
L .610 .362 . 315 LS= 0.482
1971 CR 51.1 69.6 74.8 2 1.040 22 .243
L . 561 .369 .342 LS= 0. 381
19-72 CR 49.5 65.1 71.1 2 .943 31 .200
L . 512 .383 . 319 LS= 0.314
·---1973 CR 50.5 66.5 71.6 2 .785 31 .199
L .508 .394 .348 LS= 0.317
1974 CR 47.0 67.5 73.7 2 .976 11 .264
L .475 .300 .277 LS= 0.433
1975
CR
52.9 69.4 74.5 2 .980 10 .348L .475 .375 .348 LS= 0.495
-·
-Gross capi 1ai
expenditur~
Variable: 061968 CR 49.8 69.2 75.1 2 .554 4 . 321
l .320 .289 .278 LS= 0.433
1969 CR
I
52.6 72.9 77.1 2 .788 6 .355
L .466 .359 .368 LS= 0.515
1910 CR 54.2 73.3 79.6 2 .669 11 .302
L . 501 .358 . 313 LS= 0.419
T97i--cR 47.1 69.6 75.6 2 .546 6 .279
L .376 . 271 .264 LS= 0. 383
T97! CR 47.5 67.7 75.2 2 . 561 10 .246
L .407 .277 .246 LS= 0. 369
----T973---cR 51.9 72.1 77.9
2 .786 16 .267
L .543 .344 . 315 LS= 0.396
T9~ CR 47.0 68.3 74.1 2 .582 9 .273
l .387 .284 .274 LS= 0.366
1975 CR NOT AVAILABLE
L LS=
Table 3
TABLES OF CONCENTRATION ENTERPRISES Linda indices (L) and Concentration Ratios (CR) (Page 4
*
*
No. of firms = 4 8 10
N h
L N m Variable: 07 Equity Cap tal1968 CR 52.8 70.6 75.9 2 .896 12
L .669 .389 . 351 LS= 0.500
19o9 CR 53.0 69.7 75.3 2 .826 13'
L .497 .384 .339 LS= 0.445
1970 CR 50.3 69.8 75.7 2 .879 11
L .524 .331 .303 LS= 0.458
1971 CR 51.5 69.7 75.2 2 .948 11
L .597 .374 .337 LS= 0.507
1972 CR 51 .6 69.5 74.7 2 1.063 13
L .629 .392 .355 LS= 0.503
1973 CR 50.7 68.9 73.8 2 1.156 7
L .606 .384 .352 LS= 0.656
1974
·rR
50.0 68.7 74.0 2 1.426 13L . 661 .358 .336 LS= 0.529
1975
CR
52.5 71.0 76.0 2 1.139 12L .554 .353 .347 LS= 0.504
Variable: 08 Exports
1968 CR 56.8 73.3 78.9 2 1·.071 19
L .633 .453 .380 LS= 0.438
1969 CR 53.6 69.5 75.4 2 .953 3
L .629 .426 .355 LS= 0.790
T970 CR 57.8 72.2 77.3 2 1. 301 23
L .810 .523 .436 LS= 0.469
1971
CRhg
71.9 77.2 2 1.262 3L .900 .536 .439 LS= 1 .064
1972 ----cR 60. 1 72.7 77.6 2 1.698 3
L 1.085 . 619 .503 lS= l. 386
T973"" CR 60.5 74.8 79.2 2 1.807 24
l 1. 031 .582 . 512 lS= 0.561
T974 CR 61.1 75.1 79.3 2 2.002 24
L 1.001 .602 .529 LS= 0.582
·19r5 CR 66.0 79.2 83.5 3 1.076 23
L 0.841 .604 .530 LS= 0. 541
L
.330
.310
.286
. 314
. 313
.383
.309
.326
.259
.628
.264
.866
1 .074
.278
.283
Tt~BLES OF CONCENTRATION ENTERPRISES Table 3 Linda indices (L) and Concentration Ratios {CR) (Page 5 )
No. of firms = 4 8
1~\
L N*m LVariable: 09 Net cash f ow
"1968 CR 57.3 73.6 79.1 2 . 781 11 .350
L .616 .441 . 381 LS= 0. 519
1969--clf 54.7 73.7 80.3 2 .574
11 .291
L . 517 .349 .307 LS= 0.419
1970
CR
56.4 74.7 81.2 2 .875 11 .330L .649 .395 .340 LS= 0.530
19-71 CR 52.7 70.4 76.2 2 1.068 22 .263
L .646 .404 .350 LS= 0.411
1972 CR 50.9 67.0 72.7 2 1.032 27 .222
L .589 .391 .337 LS= 0.359
1973 CR 52.7 67.7 73.4 2 .913 5 . 512
L .572 .434 .359 LS= 0.693
1974 CR 51.8 68.8 74.8 2 1.044 10 .344
L .652 .412 .344 LS= 0.564
1975 CR 71.3 81.9 84.9 2 1. 520 33 .411
L 1. 226 .842 .777 LS= 0. 680
-
-Variable: 10 Net assets
1968 CR 59.7 73.6 78.3 4 .936 13 .417
L .936 .560 .474 LS= 0.624
1969 CR 60.2 73.4 78.0 3 .824 13 .409
L .672 .540 .471 LS= 0.568
T9-ro-
CR 58.5 73.3 78.2 3 .995 36 .255L .786 . 519 .441 LS= 0. 411
1971
-c-R
58.2 72.5 76.9 3 1.088 36 .241L .873 .537 .473 LS= 0.424
1972 CR 57.9 72.3 76.9 3 1.144 34 .253
L .912 .534 .465 LS= 0.436
T973 GR 57.9 72.6 77.4 3 1.084
ll~~
0.415.245
L .876 . 518 .449
1974 CR
I
58.9 74.3 78.3 2 1. 055 11 .446L
I
.784 .486 .471 LS= 0.6541975 CR 55.7 71.2 76.8 2 1.082 12 .371
[image:39.576.31.504.76.751.2]Ranking I 1 2 3 4 5 6 7 8 9 10
Variable 08 10 07 09 01 04 03 05 06 02
~
IRartk.i.ng I I · Variable
s
1.071 .936 .896 .781 .690 .687I
.686 .682 .554 . 5131 10 0.624 3
2 04 0.571 8
3 09 0.519 7
4 07 0. 500 7
5 01 0.472 10
6 03 0.460 13
7 05 0.460 15
8 08 0.438 9
9 06 0.433 18
--~ Ranking I 1 2 3 4 5 6 7 8 9 10
Variable 08 07 10 06 01 03 09 02 04 05
Ranking II Variable
~
s
.953 .826 .824 .788 .785 .693 .574 .543 0.542 0.5121 08 .790 2
2 10 .568 5
3 06 . 515 7
4 01 .509 9
5 03 .459 11
6 07 .445 8
7 09 .419 14
8 02 .418 16
9 04 .388 18
Ranking I 1 2 3 4 5 6 7 8 9 10
Variable 08 10 07 09 04 05 03 06 01 02
Ranking II Variable
~
s
1. 301 .995 .879 .875 .859 . 781 .694 .669 .626 .522i 09 .530 5
.
2 04 . 517 9
3 05 .482 9
4 08 .469
5 07 .458 8
6 03 .455 13
7 01 .449 8 16
8 02 ~427 18
9 06 .419 15
Ranking I 1 2 3 4 5 6 7 8 9 10
Variable 08 04 10 09 05 07 01 03 06 02
Ranking II Variable
~
1.262 1. 203 1.088 1.068 1.040 .948 . 919 .648 .546 .5071 08 1.064 2
,
2 01 . 551 9
3 07 . 507 9
4 03 .456 12
5 02 .449 15
6 10 .424 9
7 09 .411 ll
8 04 .394 10
9 06 .383 18
Ranking I 1 2 3 4 5 6 7 8 9
I
101
Variable
I
08 10 07 04 09 05 02 01 06I
03Ranking II Variable
~
s
1.698 1.144 1.063 1 .052 1-.032 ~943 .649 .573 . 561 .5251 08 1 .386 2
2 07 . 503 5
3 01 .472 11
1
03 .441 145 10 .436 7
6 02 .409 13
'
'7 06 .369
16
,
8 09 .359 13
9 04 . 321 13
Ranking I 1 2 3 4 5 6 7 8 9
110
'variable 08 07 10 09 04 06 05 02 01 03
Ranking II Variable
~
s
1.807 1 . 156 1.084 . 913 .847 ~786 .785 .650 0.597 0.5061 09 .693 5
2 07 .656 4
f - - ·
3 08 .561 4
4 01 .507 13
- - - ·
--,
5 03 .425
l
156 10 .415 9
7 06 .396 13
8 04 .319 13
-9 05 .317 I 16
--Ranking I 1 2 3 4 5 6 7 8 9 10
Variable 08 07 04 10 09 05 02 06 01 03
Ranking II Variable
~
s
2.002 1. 42E 1.205 1.055 1-.044 .976I
.704 .582 .571 . 5011 10 .654 5
2 08 .582 3
3 09 .564 8
4 07 .529 6
5 01 .498 14
6 04 .491 9
1-·
7 03 .437 17
8 05 .433 14
-9 06 .366 17
Variable 06 omitted.
--Ranking I 1 2 3 4 5 6 7 8 9 10
·-Variable 09 07 10 08 05 04 01 02 03
Ranking II Variable
~
1. 520 1.139 1.082 1.076 .980 .929 .556 .548 .5371 09 .680 2
2 10 .606 5
3 08 . 541 7
·l 07 .504
1--·
5 05 .495 10
6 01 .488 13
1-·
7 03 .477 16
1
-8 04 .329 14
f--·
9 02 .268 17
---10
c-·
I
-lr Rank 1 1 2 3 4 5 6 7 8 9 10 11 12 13
Firm 16 56 46 53 49 22 33 48 5 50 34 7 38
2r lr 31.9 28.8 23.0 23.0 22.8 20.7 20.4 19.3 18.8 18.8' 17.5 17.4 16.6
I
Rank2. 1 Firm 2r
~
X 7 30 29 14 25 33 28 10 15 2 8 19 20
1 38 47.2 29 14
2 33 42.7 31 9
3 49 35.6 23 8
4 4 33.4 22 (22)
5 53 32.7 11 9
6 44 32.5 40 (33)
7 56 32.1 19 9
8 16 30. 1 5 9
9 34 30.0 9 20
10 55 26.7 34 (42)
11 7 26.4 16 23
12 22 25.8 26 18
13 1 25.5 27 ( 41)
:
(23) (39) {36) (36)