Int. J. Electrochem. Sci., 7 (2012) 11768 - 11795
International Journal of
ELECTROCHEMICAL
SCIENCE
www.electrochemsci.org
Redox, pH sensing and Electrolytic Water Splitting Properties
of Electrochemically Generated Nickel Hydroxide Thin Films in
Aqueous Alkaline Solution
Michael E G Lyons*, Anja Cakara, , Patrick O’Brien, Ian Godwin, Richard L Doyle
Trinity Electrochemical Energy Conversion & Electrocatalysis (TEECE) Group, School of Chemistry & CRANN, University of Dublin, Trinity College, Dublin 2, Ireland.
*
E-mail: [email protected]
Received: 17 September 2012 / Accepted: 6 October 2012 / Published: 1 December 2012
The formation via repetitive potential cycling of a thin nickel oxy-hydroxide film on conductive Au, GC and Pt support surfaces is described. The redox and acid/base behavior and electro-catalytic activity with respect to water oxidation to form molecular oxygen of nickel oxyhydroxide thin films on gold support surfaces in aqueous base are described. A novel OER mechanism involving Ni surfaquo groups is keeping with current ideas on homogeneous water splitting is proposed. Finally the potential of the oxide modified electrode with respect to real time pH sensing is examined.
Keywords: Nickel oxy-hydroxide thin film modified electrode; anodic oxygen evolution; oxygen evolution kinetics and mechanism; Metal oxide pH sensing.
1. INTRODUCTION
The physical electrochemistry of nickel and its oxides are been a rich source of innovative research for nearly fifty years. This work has been prompted by the uses that nickel hydroxide has found in energy storage technology. For instance Ni(OH)2 is widely used as a cathode material in NiCd
series of investigations on metal oxides of the iron group which are currently ongoing in our laboratory [13-22] following on from work initially published some time ago [23-26].
Nickel oxide films on metal support electrodes have been extensively studied. Several chemical / electrochemical methods of preparing these films have been described in the literature. These include electro-dissolution of nickel substrates in alkaline solutions [27], chemical precipitation by alternate immersion in alkaline and Ni2+ ion containing solutions [28], cathodization of the conducting substrate which is in contact with a Ni2+ solution to form Ni(OH)2 films [29,30], by anodization of a nickel salt
solution to generate higher oxidation state NiOOH films [31] and finally by application of a repetitive potential sweep multicycling potential programme between fixed defined cathodic and anodic limits to a metal electrode in contact with a Ni2+ plating solution [32]. In the present paper we adopt the latter potential method proposed by Fantini and Gorenstein [32] since it is similar to the technique adopted by us to form hydrated metal oxy-hydroxide thin films on the parent metal surface [13-22].
It is well established that detailed analysis of the pure crystalline phases of Ni(OH)2 and
NiOOH has enabled the existence of different structures to be inferred: a somewhat stable -Ni(OH)2
form and a more unstable hydrated -Ni(OH2) structure which has been shown to exist in two distinct
forms. It should be noted that the nickel hydroxide species formed by electrochemical deposition do not necessarily exhibit a well crystallized form. However the terminology just presented has been used extensively in the electrochemical literature for the and –Ni(II) species. If the latter films are subjected to oxidation in alkaline solution then the oxidation products are referred to as NiOOH oxy-hydroxides and are designated as -NiOOH and -NiOOH respectively. The latter structure is the more stable of the two oxy-hydroxide species and has been shown to exist in two separate forms. Furthermore by subjecting the nickel oxide thin film to repetitive potential cycling in aqueous alkaline solution between limits defining the stability of water, a distinctive voltammetric profile is obtained which contains peaks corresponding to the reversible Ni(OH)2/NiOOH redox transformation which in
its most simple representation is given by Ni(OH)2 NiOOH + H+ + e-. It should be noted however
that the stoichiometry of the latter redox switching reaction is considerably more complex and has been recently elucidated by the use of the EQCM method [33-36]. A non-stoichiometric structural model to characterize changes in the nickel hydroxide thin film during potential cycling has been recently provided by Weidner et al. [37]. The oxidized and reduced states of the nickel hydroxide films have different colours and so the thin film gives rise to an electrochromic effect. It has been established that nickel hydroxide is transparent or green (depending on the film thickness) and nickel oxyhydroxide exhibits a bronze like colour [38,39]. In potentiodynamic experiments coloration is observed during the anodic half cycle and bleaching in the cathodic half cycle. This sequence of coloration/bleaching is similar to that observed for anodic iridium oxide [40] and opposite to that for tungsten oxide [41]. It is also important to note that Ni(OH)2 is an electronically insulating material
whereas NiOOH is an n-type semiconductor with low electronic resistance [29]. Ni(OH)2 is however a
very good protonic conductor [42,43].
comprehensive kinetic analysis of the water oxidation kinetics and mechanism at such thin films. We compare these results with our recently published work on hydrated nickel oxyhydroxide films grown via potential cycling on nickel support electrodes in aqueous base [13].
2. EXPERIMENTAL
All experiments were conducted in a conventional three electrode cell. The working electrode was a CHI 101 inlaid gold disc electrode of 2mm diameter and geometric area 0.1 cm2. Prior to each experiment the surface of the working electrode was polished with 1200 grit carbimet paper, dipped in H2SO4, wiped, and polished with a slurry of 0.3 micron alumina powder until a
“mirror bright” finish was achieved. A platinum wire electrode (CH Instruments, cat no. CHI 115) was employed as the counter electrode and a mercury-mercuric oxide (Hg/HgO) reference electrode (CH Instruments, cat no. CHI 152) was utilised as the reference standard, therefore all voltages are quoted against this reference electrode1. When used in NaOH solutions of different concentrations, the potential of the Hg/HgO electrode was checked relative to a second Hg/HgO, 1 M NaOH electode, both before and after the experiment. No significant potential drift was noted after such experiments, implying that the concentration of the NaOH in the reference electrode chamber remains effectively constant over the time scale of typical polarisation measurements. In any case, the 1M NaOH solution in the reference electrode, was changed regularly to ensure experimental consistency.
Aqueous NaOH solutions (in the range between 0.1 and 5.0 M) served as the supporting electrolyte for the redox switching and electrocatalytic studies. This solution was prepared from sodium hydroxide pellets (Sigma-Aldrich, minimum 99% purity) using Millipore water (resistivity > 15 MΩ cm). Before commencing each experiment, nitrogen gas was bubbled through the electrolyte solution for 20 min. The nickel hydroxide thin films were prepared following the method of Fantini and Gorenstein [32]. In these electrodeposition experiments an acetate buffer electrolyte consisting of Nickel sulfate (0.1 M), sodium acetate (0.1 M) and potassium hydroxide (0.001M) with a pH value of 7.6 was used to cathodically deposit the nickel hydroxide thin film onto the gold disc electrode. The potential was cycled from – 900 mV to + 1200 mV (the latter potentials were measured w.r.t a SCE in the acetate buffer medium) at a potential sweep rate of 50 mV/s. Films of different thicknesses were prepared by varying the number of growth cycles.
The electroprecipitated Ni oxy-hydroxide films were transferred to aqueous base solution and the redox behavior examined using cyclic voltammetry and Tafel Plot analysis. Films formed after extended (> 45 cycles) tended to exhibit instability when subjected to extended polarization during electrochemical experiments performed under conditions of vigorous oxygen evolution in aqueous base. Hence much of our results will pertain to films grown after 30 cycles.
1
The equilibrium potential of the cell Pt/H2/OH
The electrochemical measurements were performed using a number of high performance digital potentiostats including a BAS 100B Electrochemical Analyser and a CH Model 760 D Bi-potentiostat system. Both workstations were controlled by high end desktop Personal Computers (Dell). The uncompensated solution resistance was determined using a method developed by He and Faulkner [45]. Typically the uncompensated solution resistance (90% compensation level) varies from ca. 0.60 Ω for [OH
-] = 5.0 M to ca. 12.1 Ω for [OH-] = 0.1 M. This parameter was specifically considered in the Tafel plot measurements, where the data is presented in iR compensated form. Unless otherwise specified, all values of current density are normalised with respect to the geometric surface area.
Charge storage capacity (redox capacity), Q, were determined via integration of the peaks recorded in the voltammetric profiles at slow sweep rates. The redox capacity is directly proportional to the layer thickness. The charge storage capacity or redox capacity (Q) was determined, following the growth of each film, by integration of the peaks in a voltammetric profile recorded at a slow sweep rate (40 mV s-1). The redox capacity is directly proportional to the layer thickness. Tafel plots were recorded for each film using linear sweep voltammetry performed at a sweep rate of 1 mV s-1.
3. RESULTS AND DISCUSSION
3.1 The electrodeposition process
Figure 1. Repetitive potential sweep voltammograms corresponding to nickel hydroxide film formation at a gold support electrode from an acetate buffer solution, pH 7.6 containing Ni2+.
Figure 2. Repetitive potential sweep voltammograms corresponding to nickel hydroxide film formation at a platinum support electrode from an acetate buffer solution, pH 7.6 containing Ni2+.
We note that the electro-deposition process may proceed as follows:
Ni2+ (aq) + 2 OH- Ni(OH)2 (1)
The following process may also occur as the applied potential becomes more anodic:
OH- OHads + e- (2)
Ni2+ (aq) + H2O + OHads NiOOH + 2 H+ (aq) (3)
Au electrode
[image:5.596.150.448.66.284.2] [image:5.596.151.445.363.573.2]
Figure 3. Repetitive potential sweep voltammograms corresponding to nickel hydroxide film formation at a glassy carbon support electrode from an acetate buffer solution, pH 7.6 containing Ni2+.
The following process may also occur in the solution:
Ac- + H2O HAc + OH- (4)
Ni2+ (aq) + OH- NiOH+(aq) (5)
NiOH+ + OHads NiOOH + 2 H+ (6)
Hence we infer that both Ni(OH)2 and NiOOH may well be formed during the course of the
potential sweep perturbation. The reactions presented in eqn.1-6 have been identified as reasonable in the classic work by Briggs and Fleischmann [31]. The latter reaction sequence should be compared with the more common method by which nickel hydroxide thin films are prepared in which Nickel nitrate and potassium nitrate solutions in 50% ethanol/water mixtures are used [43] and the latter solution subjected to a cathodic current density of ca 1 mA/cm2 for a fixed period of time. Under such circumstances the deposition chemistry is considerably more complex and involves the direct reduction of nitrate ion NO3- to either nitrous acid (HNO2), hydroxylamine (NH2OH), or by indirect
reduction of nitrate ion to nitrite ion (NO2-) or hydroxylamine. In all cases the hydroxyl ion OH
-generated as a result will form either -Ni(OH)2 or -Ni(OH)2 according to eqn.1. The use of a water
ethanol mixture has been shown to enhance the adhesion of the oxide film to the metal support surface. This methodology has been well described by Subbaiah et al [45] and by Weidner et al [46].
The cyclic voltammetric responses of an unmodified Au electrode and a gold electrode modified with a nickel hydroxide thin film are compared in fig.4 and fig. 5 respectively. Both were recorded at a sweep rate of 40 mV/s in 1.0 M NaOH. In these experiments potentials were measured and quoted with reference to the Hg/HgO (1 M NaOH) reference electrode.
[image:6.596.149.446.66.281.2]
Figure 4. Cyclic voltammogram recorded for a bright polycrystalline gold electrode in 1.0 M NaOH. Sweep rate, 40 mV/s. Potentials are quoted with respect to Hg/HgO reference electrode (1 M OH-)
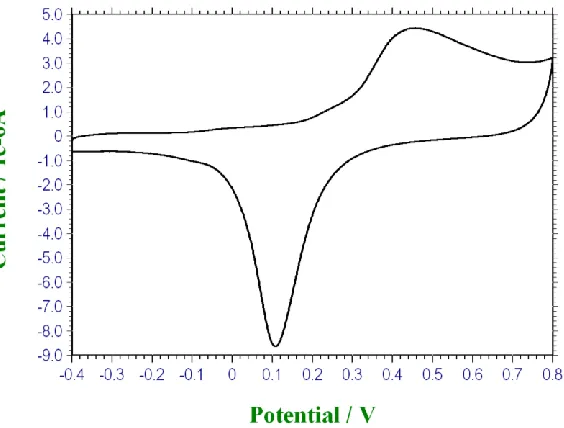
Figure 5. Cyclic voltammogram recorded for a polycrystalline gold electrode modified with a thin nickel hydroxide film (30 growth cycles) in 1.0 M NaOH. Sweep rate, 40 mV/s. Potentials are quoted with respect to Hg/HgO reference electrode (1 M OH-)
The cyclic voltammogram illustrated in fig. 4 for a polycrystalline Au electrode in 1.0 M NaOH is quite characteristic. The redox electrochemistry of gold in acid and base has been reviewed by Burke [47]. The anodic sweep is characterized initially by a featureless double layer region which extends from ca. -0.4 V to 0.2 V, which is followed by a broad oxidation feature with a peak close to 0.48 V (Vs Hg/HgO). This is ascribed to monolayer compact oxide Au2O3 formation according to:
Au + 3 H2O Au2O3 + 6 H+ + 6 e- (7)
The corresponding oxide reduction peak is noted at 0.15 V (vs Hg/HgO). The area under the latter reduction peak may be used to estimate the real surface area of the polycrystalline gold electrode. By
[image:7.596.167.429.365.555.2]
contrast, the voltammogram obtained in 1.0 M NaOH for a polycrystalline gold electrode which has been modified with a thin Ni(OH)2 layer (30 oxide growth cycles in pH 7.6 acetate buffer containing
Ni2+ ions) is presented in fig. 5. The voltammogram is quite different in shape from that outlined in fig.4. Again a well defined double layer region is observed initially during the anodic sweep until the onset of an anodic oxidation peak with a maximum at 0.406 V. This is followed by a minor anodic peak at 0.553 V. Water oxidation commences at ca. 0.65 V. On the reverse sweep in the cathodic direction a minor peak is observed at 0.44 V followed by a reductive peak of greater current intensity at 0.332 V. Finally at the lower cathodic limit of the sweep a rather broad reduction peak centered at 0.15 V can be noted. The latter feature may well be ascribed to the reduction of the Au(III) oxide Au2O3 to metallic Au (the reverse of eqn.7). It is interesting to note that the current values are
considerably larger for the nickel hydroxide modified electrode than for the unmodified electrode. The major redox transition with a standard potential of ca.E0 = 0.37 V can be assigned to the Ni (II/III) surface transformation:
-Ni(OH)2 + OH- - NiOOH + H2O + e- (8)
We assume that the hydrated - Ni(II) species is preferentially formed. The -Ni(II) then transforms to the -Ni(III) species. The standard potential measured in the present work for this major redox peak pair is some 0.1 V less anodic than that quoted by Subbaiah et al [45] for the -Ni(II/III) transition. The peak potential separation Ep = 74 mV which points to the suggestion that the
Ni(II)/Ni(III) surface redox transformation is not quite reversible. The minor oxidation peak observed at 0.553 V and its cathodic counterpart at 0.44 V, could in principle be ascribed to the -Ni(II)/-Ni(III) redox transition with E0 = 0.496 V. Hence we write:
-Ni(OH)2 + OH- - NiOOH + H2O + e- (9)
The latter value is exactly that proposed by Subbaiah and co-workers [45]. Furthermore for this pair of redox peaks Ep = 113 mV. Hence the second set of redox peaks is electrochemically more
irreversible than the former set. This interpretation seems reasonable since Bode and co-workers [48] envisaged that the oxidation of -Ni(OH)2 to -NiOOH would occur at a lower potential than the redox
transition between the two phases. The redox chemistry may therefore be rationalized in terms of the transitions outlined in scheme 1 below.
Our suggestion is strengthened by data reported by Weherns-Dijksma and Notten [35] and by Kim et al [49,50]. The latter workers focused attention on a combined CV/EQCM analysis of electro-precipitated -Ni(OH)2 and - Ni(OH)2 thin films. The former phase may be formed readily from the
phase by ageing and dehydrating the latter in strong base (6 M KOH) at elevated temperature (50 ºC). Kim et al showed that the and phases exhibited redox peaks at distinctly different potentials. The redox transition occurred at a lower potential than the transition. Furthermore it was demonstrated that the transition was more electrochemically reversible than the transition (Ep = 75 mV compared with Ep = 117 mV). The latter quantitative results are almost exactly similar
to our present result where the two sets of peaks are present conjointly in the film during the same voltammetric scan. EQCM analysis indicated that the -Ni(OH)2 and the -Ni(OH)2 mass changes
exhibited significant differences. It was noted that the potential range over which the -Ni(OH)2 film
exhibits a mass change coincides with that within the current peaks appear in the corresponding voltammogram. This suggests that the redox transition induces the mass change within the film. The film mass was found to remain constant as the potential was swept anodically from 0.25 V to ca. 0.39 V (vs Hg/HgO) and increased significantly once an onset potential of ca. 0.40 V was attained. The sharp rise in mass increase was limited to a potential window of ca. 20-30 mV. After 0.45 V the mass change remaind relatively invariant. On reversal of the sweep at 0.55 V and sweeping in a cathodic direction the mass change remaind constant until a potential of ca. 0.4 V was attained. Subsequent to that the mass decreased sharply until a potential of 0.35 V where it again attaind a constant value. The latter mass was slightly higher than that measured at the beginning of the anodic sweep. In contrast it was noted for the -Ni(OH)2 film the anodic peak maximum occurred at ca. 0.50
V prior to the onset of oxygen evolution which occurred at potentials greater than 550 mV (vs Hg/HgO). This Ni(II/III) transition was some 70 mV more positive than the corresponding peak observed for the -phase material. It was also observed that the mass of the film remained constant on sweeping the potential anodically from ca. 300 mV to ca. 480 mV but subsequently decreased at potentials close to the location of the anodic peak maximum. The mass remained constant again when sweeping to potentials more positive than 530 mV. Reversal of the direction of the potential sweep resulted in a constant mass until a potential value close to 400 mV was attained. Sweeping to potentials more cathodic than this threshold value (corresponding to the cathodic peak maximum) resulted in an increase in mass. Hence the mass change behavior associated with redox switching of the -Ni(OH)2
film is opposite to that observed for the -Ni(OH)2 film. This can be rationalized in terms of the
differing structural features of the two phases, most notably the differing inter-slab differences (the latter being much smaller for the -material than for the ) as outlined schematically in scheme 2 below.
It is important to note however that it is somewhat inappropriate to think about the formation of a compound or phase with a definite stoichiometry during the complex Ni(OH)2 to NiOOH
Scheme B.
Schematic representation of Bode Scheme of squares. The discharged or reduced Ni(OH)2
material can exist either as a largely anhydrous phase designated as – Ni(OH)2 (denoted
-Ni(II)) or as a hydrated phase denoted as -Ni(OH)2 (in short represented as -Ni(II)). Oxidation
of the -Ni(II) material is envisaged to produce a phase referred to as -NiOOH or -Ni(III). In contrast oxidation of the -Ni(II) material produces -Ni(III) or -NiOOH. Hence one expects two distinct redox transitions : (II)/(III) and (II)/(III).
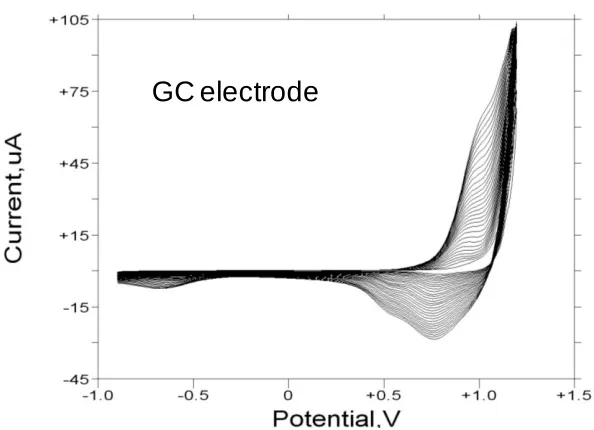
In fig.6 we illustrate the voltammogram recorded for a Nickel hydroxide film grown on a glassy carbon support electrode for 30 cycles from the Ni2+ plating solution via the potential sweep method previously described and recorded in 1.0 M NaOH. Unlike the result presented in fig.5 only a single pair of clearly defined voltammetric peaks are noted in the voltammogram. In this case the anodic peak at ca. 0.40 V is quite sharp and well defined and is followe d by an ill defined shoulder located at a potential close to 0.50 V. The onset of visible oxygen evolution occurs at ca. 0.65 V. On the reverse sweep a shoulder at ca. Ca. 0.44 V may be discerned followed by a somewhat better defined broad reduction peak at ca. 0.33 V. Again both Ni(OH)2 phases may be
Figure 6. Cyclic voltammogram recorded for a glassy carbon electrode modified with a thin nickel hydroxide film (30 growth cycles) in 1.0 M NaOH. Sweep rate, 40 mV/s. Potentials are quoted with respect to Hg/HgO reference electrode (1 M OH-).
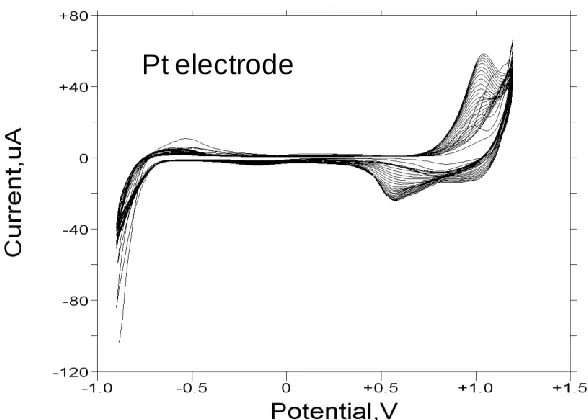
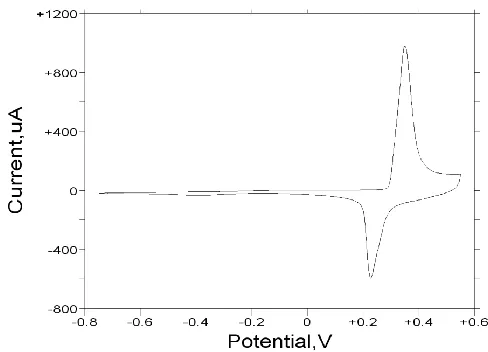
[image:11.596.179.422.72.244.2]In fig.7 we illustrate the voltammogram recorded for a Nickel hydroxide film grown on a Pt support electrode for 30 cycles from the Ni2+ plating solution via the potential sweep method previously described and recorded in 1.0 M NaOH. Here the voltammetric response is less complex than that exhibited in fig.5 and fig.6. Only a single well defined pair of redox peaks is observed.
Figure 7. Cyclic voltammogram recorded for a Pt electrode modified with a thin nickel hydroxide film (30 growth cycles) in 1.0 M NaOH. Sweep rate, 40 mV/s. Potentials are quoted with respect to Hg/HgO reference electrode (1 M OH-).
Here both the oxidation and corresponding reduction peaks are narrow, although the cathodic charge capacity is somewhat less than the anodic.
[image:11.596.175.419.407.583.2]
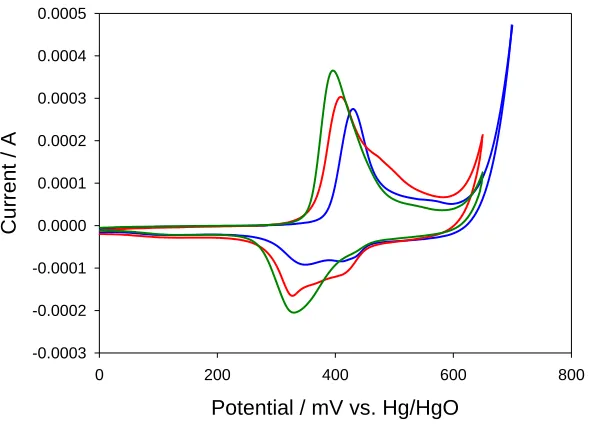
mV/s) for N = 30 growth cycles and the resulting voltammogram examined in 1.0 M NaOH at a sweep rate of 40 mV/s. The results obtained are presented in fig.8 below.
Figure 8. Cyclic voltammogram recorded for a Au electrode modified with a thin nickel hydroxide film (30 growth cycles) in 1.0 M NaOH. Sweep rate, 40 mV/s. Potentials are quoted with respect to Hg/HgO reference electrode (1 M OH-). Growth sweep rate : 10 mV/s (----); 20 mV/s (----); 50 mV/s (----)
A number of interesting features may be discerned from fig.8. First, a single anodic and a cathodic doublet is observed for the layer grown for 30 cycles at 10 mV/s. An anodic peak doublet and a corresponding cathodic peak doublet is observed for the layer grown at 20 mV/s in a similar deposition medium. Finally only a single broad anodic and cathodic peak is observed for the layer grown at 50 mV/s. Hence we conclude that the timescale adopted for the layer deposition reaction clearly effects the composition of the deposited oxide layer. Both the Ni(II/III) transition and the -Ni(II/III) transitions are observed for the layers grown at low sweep rates (long time scales) whereas only the transition is to be noted for layers grown at shorter time scales. This is to be expected since one may well expect dehydration within the layer to occur with increasing experimental duration and this would be reflected in the appearance of the set of redox peaks at more elevated potentials than the set. Second, the voltammetric peak corresponding to the Ni(II/III) redox transition is located at lower anodic potentials for layers grown at higher sweep rates. For instance the peak potential is located at ca. 420 mV for the layer grown at 10 mV/s whereas the peak is at ca. 400 mV for the layer formed via potential cycling at 50 mV/s. The corresponding reduction peak exhibits a similar decrease in anodic potential. Third, the double layer region at low potentials appears to remain invariant with respect to the value of the sweep rate utilized during film formation.
The ageing of the electro-precipitated nickel oxide layer was examined in a further series of experiments. The layer was grown on a gold substrate via repetitive potential cycling (-900 to 1200 mV (vs SCE), 20 mV/s) from a Ni2+ containing aqueous sulfate solution for 30 cycles. It was then
Potential / mV vs. Hg/HgO
0 200 400 600 800
Cu
rr
ent
/
A
[image:12.596.137.432.128.340.2]
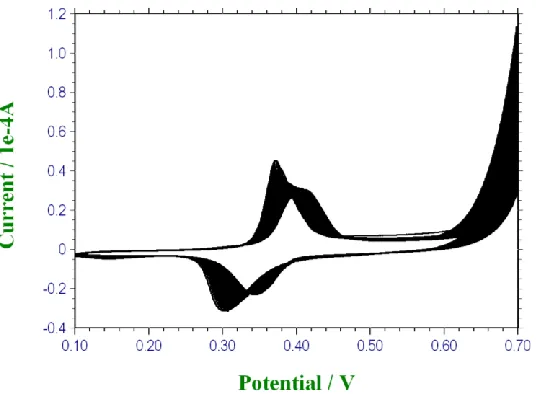
placed in 5.0 M NaOH and cycled between the limits of 0.1 to 0.7 V at 10 mV/s for 85 cycles. The results of this procedure are illustrated in fig.9 and fig.10.
Figure 9. Typical voltammetric response recorded for an electroprecipitated nickel oxide film deposited on a polycrystalline gold substrate subjected to slow multicycling (sweep rate 10 mV/s) between 0.1 and 0.7 V (vs Hg/HgO) in 5.0 M NaOH.
Figure 10. Typical voltammetric response recorded for an electroprecipitated nickel oxide film deposited on a polycrystalline gold substrate subjected to slow multicycling (sweep rate 10 mV/s) between 0.1 and 0.7 V (vs Hg/HgO) in 5.0 M NaOH. The initial and final response profiles are presented.
A number of interesting features arise from the latter experiments. As outlined in fig.9 there is a clear transition in voltammetric response with increasing number of cycles in strong base solution. The most obvious result in fig.10 concerns the marked shift in redox peak position to more anodic values as a result of layer ageing in strong base under electrochemical cycling conditions. The standard potential for the Ni(II)/Ni(III) transformation varies from an initial value (N = 1) of E0 = 341 mV to
Initial Cycle
[image:13.596.167.435.123.320.2] [image:13.596.168.429.397.593.2]
E0 = 379 mV after N = 85 cycles. It is also of interest to note that the Ni(II)/Ni(III) redox transformation does not become more kinetically irreversible with aging to any significant extent. For instance the anodic/cathodic peak separation E varies from 74 mV for cycle 1 to 68 mV for cycle 85. Finally, and perhaps most importantly, it is clear from fig.10 that the onset of oxygen evolution decreases as a result of electrochemically multicycling the nickel oxide electrode in strong base from ca. 650 mV for the initial cycle to ca.600 mV for the final cycle examined. Also the oxygen evolution rate (manifested as a current) at fixed potential (E = 0.7 V vs Hg/HgO)) increases with increasing number of potential cycles from ca. 5.5 x 10⁻⁵A to 1.08 x 10⁻⁴A respectively. Hence we can conclude that a structural transformation occurs within the nickel oxide layer during the aging process in strong base.
The electrochemical ageing experiments were repeated with the nickel oxide material cycled in 1.0 M NaOH. The results are presented in fig.11. In this case cycling in more dilute base results in a layer which transforms from a situation where the Ni(II/III) redox transition is more reversible (E = 61 mV for N = 1) to somewhat less reversible (E = 77 mV, N = 85). Furthermore the anodic peaks shifts to more positive potential values (Ep,A = 392 mV for N =1 as opposed to Ep,A = 412 mV for N =
85). In contrast the reduction peak potential remains relatively invariant on electrochemical ageing (331 mV as opposed to 335 mV). Interestingly, the visible oxygen evolution current diminishes and the OER onset potential increases on layer ageing. This is in marked contrast with the situation observed for electrochemical ageing in strong base solution. It is also interesting that an ill defined anodic shoulder at 490 mV and a cathodic counterpart at 420 mV appears after N = 85 cycles.
Figure 11. Typical voltammetric response recorded for an electroprecipitated nickel oxide film deposited on a polycrystalline gold substrate subjected to slow multicycling (sweep rate 10 mV/s) between 0.1 and 0.7 V (vs Hg/HgO) in 1.0 M NaOH. The initial and final response profiles are presented.
[image:14.596.143.460.427.663.2]
3.2 Redox switching within the electrodeposited layer
We now consider the results of a series of experiments, conducted to quant ify the rate of charge percolation through the hyrated layer. As previously noted for hydrous Nickel oxide layers grown via repetitive potential cycling on the parent metal in aqueous base [13], t he redox switching reaction (associated with the Ni(II/III) voltammetric peaks) reflects the change in oxidation state of the film as a result of a potential perturbation. Redox centres immediately adjacent to the support electrode are directly affected by the electrode potential, whereas charge is further propagated along the oxy-iron polymer strands in the porous oxide layer via a sequence of electron self exchange reactions between neighbouring oxy-metal sites. This process is envisaged to be analogous to redox conduction exhibited by electroactive polymer films. In the simplest terms this electron “hopping” may be modelled in terms of a diffusional process, and so the charge percolation rate may be quantified in terms of a charge transport diffusion coefficient, DCT. In the
case of hydrous iron oxide, the latter may reflect either the electron hopping rate or the diffusion of of OH- (or equivalently H3O+) ions via a rapid Grotthus type mechanism. The charge transport
diffusion coefficient may be quantitatively estimated using cyclic voltammetry and potential step chronoamperometry. We adopt a similar viewpoint here for the electroprecipitated nickel oxide film.
As previously noted the charge/discharge reaction involving a Ni(II)/Ni(III) redox transition within the oxide is simplistically viewed as a Ni(OH)2/NiOOH transition of the type
previously mentioned. MacArthur [53], Zimmerman and Effa [54] Weidner and co-workers[55] and Mao et al [56] have suggested that the charge/discharge process is controlled by the diffusion of protons. The details of the redox switching process as illuminated by EQCM measurements have been discussed by Wehrens-Dijksma and Notten [35]. In extended studies reported by Hillman et al [33] using probe beam deflection (PBD) and EQCM techniques it was conclude d that the overall mass change detected was dependent of experimental timescale (sweep rate) and electrolyte concentration (LiOH was used). This conclusion coulkd be used to rationalise the rather wide range of assignments used in the literature to explain the redox switching mechanism exhibited by electroprecipitated nickel hydroxide thin films in aqueous base. Hillman et al [33] concluded that neutral species transfer was incomplete on the timescales of most voltammetric experiments while redox transfer is complete. Redox transfer depends on electrolyte concentration where neutral species transfer doers not. The experiments performed also suggested that the reactions occurring in and - films are similar, differing only in the balance established between hydroxide/proton contributions to ionic transport through the layer. They suggested that -films are characterized by dominant OH- ion transfers (as compared with H+ and OH2 species transport).
In contrast -films are characterized by increased participation of water and protons to the exchange dynamics. A mechanism was suggested where at potentials less positive than the peak value protons within the lattice deintercalate upon nickel hydroxide oxide oxidation, followed by combination with OH- ion from the electrolyte to produce H2O at the oxide film/solution interface.
Hence it was suggested that while OH- ions enter the oxide H2O molecules leave . This arises
hydroxide ions are expelled, prior to the dissociation of water at the interface to produce H+ and OH-. The protons are then re-intercalated into the layer structure whilst OH- ions are expelled into solution. This idea is presented schematically in figure 12 below.
Figure 12. Schematic representation for the redox switching mechanism associated with a-nickel hydroxide according to Hillman et al [33]. On oxidation prior to the peak potential protons leave and hydroxide ions enter the film and combine with protons to produce water. Hydroxide ion predominates at potentials greater than the peak potential. On reduction water molecules dissociate to produce protons which are re-intercalated into the film lattice concurrently with hydroxide ion expulsion.
The redox chemistry associated with the Ni(II)/Ni(III) transition within nickel oxyhydroxide thin films may be further understood by examining the manner in which the peak potentials derived from the cyclic voltammograms vary in magnitude with changes in solution pH. Burke and Lyons [27] have shown that, for an ideal oxide electrode system in aqueous solution at 25ºC, the potential decreases with increasing pH by ca. 59 mV/pH unit with respect to a pH independent reference electrode such as the NHE or the saturated calomel electrode (SCE). Such a potential-pH shift is
OH
-H
+H
2O
OH
-H
+H
2O
Oxidation
Reduction
Electrode
Film
e
-e
-charge
2 discharge 2
(
)
[image:16.596.132.465.139.534.2]
referred to as a Nernstian shift, since it is predicted by the Nernst equation. Alternatively, if the reference electrode is pH dependent, such as the reversible hydrogen electrode (RHE) or the Hg/HgO electrode, no potential pH shift will be observed, since the potential of this type of electrode also alters by ca. 59 mV per unit change in pH at 25ºC. Furthermore, Burke and Lyons [26] have discussed super-Nernstian shifts that have been observed for various hydrous oxide systems – in these cases the potential/pH shift differs from the expected 0.059V/pH unit at 25oC. The mathematical treatment of this situation is beyond the scope of the present paper, but suffice to say, the phenomena have recently been qualitatively summarized [19]. Thus, a zero potential shift (with respect to a pH dependent reference electrode) implies that both the reactants and the product possess the same net charge. A positive potential shift with pH, is indicative of an oxidised state that is more positive than the reduced state, whereas the converse is true in the case of an observed negative potential/pH shift.
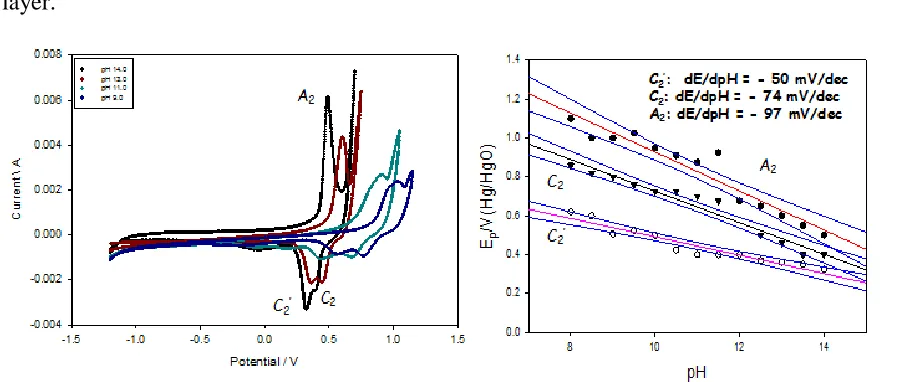
We have recently shown [57,58] for hydrous nickel oxyhhydroxide thin films deposited electrochemically on Ni metal supports in aqueous base that the characteristic redox peaks exhibit clear variations with changes in solution pH as illustrated in fig.13. In particular the anhydrous A2’/C’2 peaks exhibit a regular Nernstian shift whereas the hydrous counterparts A2/C2 exhibit the
characteristic of a hydrous or hyper-extended oxide [26,57,58], i.e. a super-nernstian potential-pH shift, which typically has the value of dE/dpH = -2.303(3RT/2F) = -0.088V/pH unit at T = 298 K. Accordingly, by analogy with a scheme produced by Burke and Whelan [59] for redox switching of iridium oxide films, it has been proposed that the main redox switching reaction (corresponding to the peak set A2/C2 may be written as:
[Ni2(OH)6(OH2)3]n2- + 3nOH- → [Ni2O3(OH)3(OH2)3]n3- +3nH2O + 2ne- (10)
[image:17.596.49.501.505.696.2]corresponding to an Ni(II)/Ni(III) redox transition in a polymeric microdispersed hydrous oxide layer.
The redox switching reaction presented in eqn.10 is illustrated schematically in scheme C below.
Scheme C
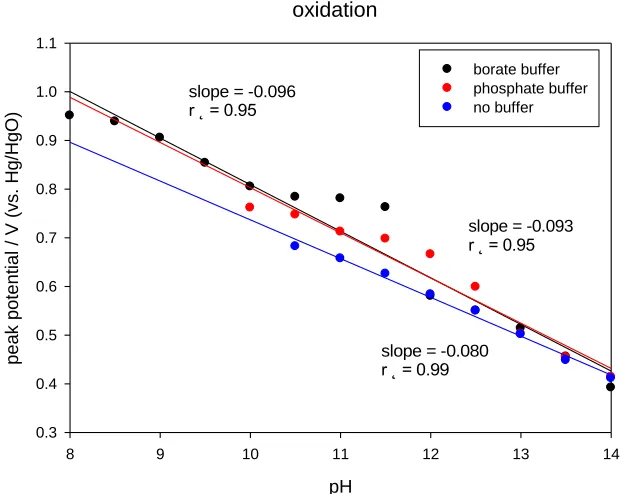
We have repeated the latter experiments for nickel oxyhydroxide thin films prepared via potential cycling on Au support electrodes, and the results are presented in fig. 14 below. The oxidation peak potential decreases significantly with increase in solution pH and the decrease is linear. Typically super-Nernstian shifts of ca. – 0.096 V/dec, - 0.093 V/dec and – 0.080 V/dec were obtained for phosphate and borate buffer solutions and un-buffered solution respectively. It is interesting to note that a marked deviation from linear behavior was observed between pH The significant point to note here is that one may postulate that a redox reaction involving anionic connected surfaquo groups similar to that presented in scheme A operates for the electro-precipitated nickel oxy-hydroxide thin film on Au supports. 11-12 in borate buffer. This could well be due to adsorption of buffer components on electrode surface.
Figure 14. (a) Variation of voltammetric peak potentials (corresponding to Ni(II)/Ni(III) oxidation peak) with solution pH. Nickel oxy-hydroxide thin film electrodeposited via potential cycling (N = 30 cycles, sweep rate 50 mV/s) on Au support electrode. Data recorded both in borate (0.5 M H3BO3 + 1M Na2SO4) and phosphate (0.05 M Na2HPO4) buffer solutions and in un-buffered
solution (1 M NaOH + 1M Na2SO4).
oxidation
pH
8 9 10 11 12 13 14
pea
k
potential
/
V
(v
s
.
H
g
/H
g
O)
0.3 0.4 0.5 0.6 0.7 0.8 0.9 1.0 1.1
borate buffer phosphate buffer no buffer
slope = -0.096 r ˛ = 0.95
slope = -0.093 V/pH r ˛ = 0.95
[image:18.596.134.445.414.661.2]
The super-Nernstian pH variation exhibited by the electro-precipitated oxide film suggests that the latter modified electrodes may prove to be useful and sensitive pH sensor materials, especially for physiological applications [60]. Anodically prepared iridium oxide appears to be an excellent example of a pH sensor [61]. The variation of the open circuit potential for a series of electroprecipitated nickel oxy-hydroxide modified gold electrodes with immersion time is outlined in fig. 15. The latter data was obtained for an extensive range of pH values spanning the range of interest in pH sensing. It appears that the electrodeposited nickel oxy-hydroxide films are stable under immersion at open circuit for considerable lengths of time (104-105 s). The open circuit potential rapidly drops to less positive values for times greater than 104s in solutions of low pH, typically when pH < 4. The latter is due to film dissolution in the more acidic solution.
[image:19.596.166.439.283.441.2]Figure 15. (a) Variation of open circuit potential with time obtained for a series of nickel oxy-hydroxide modified Au electrodes immersed in solutions of various pH values in the range 1-14.
Figure 16. Variation of open circuit potential with solution pH values in the range 1-14 recorded for a nickel oxy-hydroxide modified Au electrode..
Potential Response to pH
pH
0 2 4 6 8 10 12 14
P
o
te
n
tia
l
vs
(H
g/HgO)
/V
0.2 0.4 0.6 0.8 1.0 1.2 1.4 1.6
[image:19.596.160.410.522.734.2]
The variation of open circuit potential with solution pH is outlined in fig.16. The potential values were recorded over a range of times from 200 to 15,000 seconds. A good linear correlation is obtained with dEOC dpH 0.080V dec/ . Again the response is super-Nernstian signifying a sensitive response of the oxide electrode to changes in pH. The response of the nickel oxide electrode to changes in solution pH recorded during a Strong Acid/ Strong Base titration (1M H2SO4/ 1M
NaOH) are presented in fig. 17 below. It is clear that the nickel oxy-hydroxide modified electrode follows the course of the titration very effectively. The open circuit potential responds very well to the rapid pH change observed near the equivalence point. The response is at least as good as that recorded for a commercial glass pH sensing electrode.
Figure 17. Strong acid/strong base titration followed in real time using a commercial glass pH electrode and the nickel oxy-hydroxide modified Au electrode.
Indeed further analysis has shown that the relationship between the pH value calculated via the open circuit oxide electrode potential and the pH value measured via the glass electrode is linear with
1.01 0.74
oxide glass
pH pH . Hence we conclude that the nickel oxy-hydroxide electrode offers excellent potential as a solid state pH sensor.
3.3 Electrolytic water splitting: anodic evolution of molecular oxygen
In this section we describe the results of a comprehensive kinetic analysis on the anodic oxygen evolution reaction (OER) carried out at nickel oxy-hydroxide coated Au electrodes in aqueous alkaline solution. These studies were performed both as a function of base concentration and follow on from recent papers [19,57,58] which described enhanced oxygen evolution at hydrous oxy-hydroxide modified iron and nickel electrodes in aqueous alkaline solution. We also refer to an earlier paper
Volume Sulphuric Acid Added / cm^3
0 10 20 30 40 50
pH
0 2 4 6 8 10 12 14 16
P
ot
en
tial
v
s S
CE
/
V
[image:20.596.105.496.250.512.2]
written by Lyons and Brandon [14] which describes the OER mechanism and kinetics at oxidized (but not potential multicycled) Ni electrodes in base.
[image:21.596.118.435.136.377.2]Figure 18. Typical steady state Tafel plots recorded for electro-precipitated nickel oxy-hydroxide coated Au electrodes in 1 M NaOH. The oxide electrodes were formed via potential cycling at sweep rates in the range 10 – 50 mV/s.
Figure 19. (a) Typical steady state Tafel plots recorded for electro-precipitated nickel oxy-hydroxide coated Au electrodes as a function of base concentration. The oxide electrodes were formed via potential cycling at a sweep rates 10 mV/s for N = 30 cycles. (b) Typical reaction order plot recorded at a 30 cycled nickel oxy-hydroxide coated Au electrode in the low Tafel slope region. Average gradient over three runs is 1.12.
/ V (vs. Hg/HgO)
0.1 0.2 0.3 0.4 0.5 0.6 0.7
log c urrent / A -7 -6 -5 -4 -3 -2 10 mV/s 20 mV/s 50 mV/s
/ V (vs. Hg/HgO)
0.0 0.1 0.2 0.3 0.4 0.5 0.6
log I / A -7 -6 -5 -4 -3 -2 0.1M 0.5M 1M 2M 4M
Log (aOH-)
-1.5 -1.0 -0.5 0.0 0.5 1.0
[image:21.596.47.548.452.647.2]
Typical steady state Tafel plots recorded for as series of nickel oxy-hydroxide modified Au electrodes in 1.0 M NaOH are presented in fig.18. The oxide films were grown via potential cycling at sweep rates of 10, 20 and 50 mV/s between limits of– 900 mV to + 1200 mV (the latter potentials were measured with respect to a SCE in the acetate buffer medium) for N = 30 cycles as noted previously. Twin Tafel slope regions may be readily discerned. The first at low over- potentials, typically between 250 and 370 mV, is characterized by Tafel slopes in the range 51-54 mV/dec. At higher overpotential the Tafel slope is typically in the range 126 – 132 mV/dec. For example for layers grown at a sweep rate of 10 mV/s the Tafel slope at low overpotential is ca. 54 mV/dec, whereas for a layer grown at 50 mV/s the slope reduces to ca. 52 mV/dec.
[image:22.596.53.512.445.610.2]The reaction order with respect to hydroxide ion activity was subsequently determined by analysis of the steady state Tafel plots recorded as a function of base concentration (fig.19(a)). The reaction order plot is linear (fig. 19(b)). Typically for an oxide layer grown for 30 cycles at 10 mV/s the reaction order in the low Tafel slope region is mOH 1.12 . Further experimental analysis (not shown here) indicated that the reaction order at high overpotentials was close to unity. It should be noted from fig.20 below that the Tafel slope values vary with base concentration. At low overpotentials, Tafel slope values vary from ca. 75 mV/dec at low base concentration to ca.45 mV/dec at 5 M base. In contrast at higher overpotentials the Tafel slope remains relatively invariant with base concentration (typically ca. 123 mV/dec) over the range examined. Hence the oxide surface becomes more catalytically active with respect to the OER reaction as the solution becomes more alkaline. This can be attributed to the fact that the -nickel oxyhydroxide phase becomes more stable in strong base and that the oxide ages in the latter media over time.
Figure 20. Variation of Tafel slope value for OER with base concentration at (a) low potentials and (b) at high potentials.
The kinetic data presented in fig.18-20 can be rationalised in terms of a kinetic scheme outlined in scheme C. Our mechanistic thinking is guided by the earlier work of Kobussen and Broers [62]. The mechanism is presented in schematic form in scheme D. Note that octahedrally co-ordinated oxy-nickel surfaquo groups are identified as the catalytically active species and are located within the hydrous layer of the nickel oxy-hydroxide thin film.
cOH- / M
0 1 2 3 4 5 6
b / m V d e c -1 30 40 50 60 70 80 90 Run 1 Run 2 Run 3
cOH- /M
0 1 2 3 4 5 6
Scheme D
The following reaction sequence based on scheme D may be outlined:
(11) (12) (13) (14) (15) (16) (17)
In the latter scheme S represents the surfaquo group which is attached to the hydrous oxide surface by bridging oxygen ligands. The proposed catalytic cycle for the OER outlined in Scheme D, involves an octahedrally coordinated Ni(III) species located in the hydrous layer. This scheme is analogous to those depicted for various different photocatalyst systems [63-65]. A common feature of these schemes is that the starting point for the OER catalytic cycle is usually represented as a metal coordinated water molecule. However, in the strongly alkaline conditions used in this system it is likely that a significant proportion of these coordinated water molecules will be deprotonated. The pKa
H yd ro u s La ye r
H2O
O2 e
-OH -e -e -OH -OH -OH -OH
-H2O
e-, H 2O
Low ηRDS: T.S.=60 mV/dec
mOH-= 1
High ηRDS (θ→1): T.S.=120 mV/dec
mOH-= 1 SOH2 SOH -SOH SO -SOOH SO SO2
Octahedrally co-ordinated Ni(III)
Fast initial deprotonation
Metal oxide
Metal oxo
Low RDS
TS = 40 mV/dec
mOH-= 1
Metal peroxide
Low RDS
TS = 40 mV/dec
value for a water molecule coordinated to a highly charged metal atom is generally in the range pKa
5-9 [66]. In light of this, it is more reasonable to assume that the initial deprotonation step is facile and will occur outside of the catalytic cycle. Hence, the initial deprotonation step is depicted as a pre-step in Scheme B and the OER catalytic cycle begins with the resultant coordinated OH− ion which we label . A second point of note regarding Scheme B is that the formation of the metal oxide (eqn. 13) and metal oxo (eqn. 14) species are designated as rate determining. Interestingly, in a recent theoretical study Muckermann et al. [67] showed, through the use of DFT calculations, that for a GaN/ZnO surface with high coverage of adsorbed OH− ions the intermediate associated with the highest energy was an oxide radical. Similarly, Rossmeisl et al. [68] performed a DFT study of the OER at RuO2 surfaces. They too found, for a surface saturated with adsorbed OH, that the highest
energy intermediate was a surface oxygen species, in this case an oxo species. Considering these studies, the present mechanistic interpretation brings together a number of strands in the current understanding of the OER at metal oxides, and is clearly more satisfying than our previous presentation.
We note that the first step in the reaction sequence (eqn.11) occurs rapidly and need not be included in the steady state kinetic analysis. If we assume that the step outlined in eqn.13 is rate determining then the net reaction flux is given by:
(18)
In the latter expression represents the activity of hydroxyl ion and denotes the surface coverage. We use the quasi steady state approximation to evaluate the surface coverage of SOH as follows:
(19)
We may readily solve to obtain an expression for the surface coverage:
(20)
Hence the net flux is given by
(21)
In the latter expression the primed quantities represent heterogeneous electrochemical rate constants whose potential dependence is assumed to be given by the Butler-Volmer rate equation:
In this expression denotes the overpotential and is the symmetry factor. In contrast the chemical rate constant is given by its standard value and there is no potential dependence:
(23)
Hence the net flux is given by
(24)
Now if the step outlined in eqn.13 is rate determining then we can safely assume that and so eqn.24 reduces to
(25)
This expression can be readily shown to predict a reaction order of unity with respect to hydroxide ion activity and a Tafel slope at 298 K of ca. 60 mV/dec ( ).
In contrast, if the subsequent step outlined in eqn.14 becomes rate limiting then we can write that
(26)
Again using the quasi-steady state approximation we can show that
(27)
Solving for the surfaquo group coverage we obtain
(28)
Hence the net reaction flux is given by
(29)
Now at high overpotentials we assume that and also and so we obtain that
(30)
activity and a Tafel slope of ca. 120 mV/decade at 298 K will be observed assuming that . Hence the kinetic analysis is in excellent agreement with experiment. Our kinetic analysis resonates with one proposed earlier by Burke and O’Sullivan [69].
3. CONCLUSIONS
In the present paper we have described the growth of hydrous nickel oxyhydroxide thin films on Au, GC and Pt substrates in aqueous base and examined the dynamics of redox switching in the latter films. A number of important conclusions arise from the present paper. First, hydrous microdispersed nickel oxy-hydroxide films are readily prepared via the repetitive cyclic potential sweep method applied to a foreign conductive substrate in aqueous alkaline solution. The latter method is very similar to that employed in the electropolymerization of Electronically Conducting Polymer (ECP) films such as poly(pyrrole) or poly(aniline). The oxide/solution interface formed via the latter procedure has a duplex character, consisting of an inner, largely anhydrous compact oxide, and an outer, hydrated microdisperse oxide layer which exhibits significant electrocatalytic activity with respect to anodic oxygen evolution. Second, the acid/ base behaviour of anodically formed transition metal oxide is important when considering the mechanism of both redox switching and oxygen evolution. Furthermore, hydrous oxides are more difficult to reduce than less hydrated compact materials, and this may well have a significant implication for the catalysis of the cathodic ORR. Third, the electrodeposited oxide exhibits excellent potential as a pH detecting solid state electrode and shows response times as good as that displayed by a more conventional glass electrode. Fourth, an OER mechanism in keeping with current ideas derived from experiments on molecular inorganic transition metal complexes for OER catalysts has been proposed. This extends the classic work of Kobussen and Broers [62] and utilizes the concept of a surfaquo groups involving a metal oxide and metal oxo species as participants in the rate determining step of the oxygen evolution reaction under electrochemical conditions [69]. Indeed we can conclude that the chemistry of the surfaquo group determines the chemistry of the OER catalytic cycle.
ACKNOWLEDGEMENT
MEGL is grateful for the financial support of Enterprise Ireland Grant Number SC/2003/0049, IRCSET Grant Number SC/2002/0169 and the HEA-PRTLI Program. This publication has emanated in part from research conducted with the financial support of Science Foundation Ireland (SFI) under Grant Number SFI/10/IN.1/I2969.
References
1. (a) G.W. Briggs, E. Jones, W.F.K. Wynne-Jones, Trans. Faraday Soc., 51 (1955) 1433 ; (b) E. Jones, W.F.K. Wynne-Jones, ibid., 52 (1956) 1261 ; (c) R. Barnard, C.F. Randell, F.L. Tye, J. Appl. Electrochem., 10 (1980) 109 ; (d) D. Linden (Ed), Handbook of batteries, Mc Graw Hill, New York, 1995.
4. S. Trasatti, Electrochim Acta, 29 (1984) 1503.
5. A.C.C. Tseung, S. Jasem, Electrochim. Acta, 22 (1977) 31.
6. R.S. Schrebler Guzman, J.R. Vilche, A.J. Arvia, Corrosion Sci., 18 (1978) 765.
7. (a) P.W.T. Lu, S. Srinivasan, J. Appl. Electrochem., 9 (1979) 269. (b) P.W.T. Lu, S. Srinivasan, J. Electrochem. Soc., 125 (1978) 1416.
8. D.E. Hall, J. Electrochem. Soc., 128 (1981) 740.
9. H. Willerns, A.G.C. Kobussen, J.H.W. De Witt, G.H.J. Broers, J. Electroanal. Chem., 177 (1984) 227.
10.(a) L. Brossard, Int. J. Hydrogen Energy, 16 (1991) 87 ; (b) M. Cappadonia, J. Divisek, T. von der Heyden, U. Stimming, Electrochim. Acta, 39 (1994) 1559.
11.(a) D.E. Hall, J. Electrochem. Soc., 130 (1983) 317; (b) K. Zeng, D. Zhang, Prog. Energy Combust. Sci., 36 (2010) 307; (c) H. Tributsch, Int. J. Hydrogen Energy, 33 (2008) 5911; G.W. Crabtree, M.S. Dresselhaus, M.V. Buchanan, Phys. Today, Dec 2004, 39.
12.K. Kinoshita, Electrochemical oxygen technology, Wiley – Interscience, New York, 1992, Chapter 2, pp. 78-99.
13.M.E.G. Lyons, L. Russell, M. O’Brien, R.L. Doyle, I. Godwin, M.P. Brandon, Int. J. Electrochem. Sci., 7 (2012), 2710-2763.
14.M.E.G. Lyons, M.P. Brandon, Int. J. Electrochem. Sci., 3 (2008) 1386. 15.M.E.G. Lyons, M.P. Brandon, Int. J. Electrochem. Sci., 3 (2008) 1425. 16.M.E.G. Lyons, M.P. Brandon, Int. J. Electrochem. Sci., 3 (2008) 1463. 17.M.E.G. Lyons, M.P. Brandon, Phys. Chem. Chem.Phys., 11 (2009) 2203. 18.M.E.G. Lyons, R.L. Doyle, Int. J. Electrochem. Sci., 6 (2011) 5710.
19.M.E.G. Lyons, R.L. Doyle, M.P. Brandon, Phys. Chem. Chem. Phys.,13 (2011) 21530. 20.M.E.G. Lyons, S. Floquet, Phys. Chem. Chem. Phys., 13 (2011) 5314.
21.M.E.G. Lyons, M.P. Brandon, J. Electroanal. Chem., 631 (2009) 62.
22.M.E.G. Lyons, S. Rebouillat, M.P. Brandon, R.L. Doyle, Int. J. Electrochem. Sci., 6 (2011) 5830. 23.L.D. Burke, M.E.G. Lyons, O.J. Murphy, J. Electroanal. Chem., 132 (1982) 247.
24.M.E.G. Lyons, L.D. Burke, J. Electroanal. Chem., 170 (1984) 377. 25.L.D. Burke, M.E.G. Lyons, J. Electroanal. Chem., 198 (1986) 347. 26.L.D. Burke, M.E.G. Lyons, Mod. Asp. Electrochem., 18 (1986) 169-248.
27.(a) R.S.S. Guzmann, J.R. Vilche, A.J. Arvia, J. Electrochem. Soc., 125 (1978) 1578; (b) R.S.S. Guzmann, J.R. Vilche, A.J. Arvia,J. Appl. Electrochem., 8 (1978) 67; R.S.S. Guzmann, J.R. Vilche, A.J. Arvia, J. Appl. Electrochem., 9 (1979) 183.
28.M.E. Folquer, J.R. Vilche, A.J. Arvia, J. Electrochem. Soc., 127 (1980) 2634. 29.D. Tuomi, J. Electrochem. Soc., 112 (1965) 1.
30.(a) C.C. Streinz, A.P. Hartman, S. Molupally, J.W. Weidner, J. Electrochem. Soc., 142 (1995) 1084. (b) M. Murthy, G.S. Nagarajan, J.W. Weidner, J.W. Van Zee, J. Electrochem. Soc., 143 (1996) 2319.
31.G.W.D. Briggs, M. Fleischmann, Trans. Faraday Soc. 62 (1966) 3217. 32.M. Fantini, A. Gorenstein, Solar Energy Mater., 16 (1987) 487.
33.(a) M. Gonsalves, A.R. Hillman, J. Electroanal. Chem., 454 (1998) 183. (b) M. Gonsalves, A.R. Hillman Proc. Electrochem. Soc., 97-18 (1997) 738; (c) H.M. French, M.J. Henderson, A.R. Hillman, E. Viel, J. Electroanal. Chem., 500 (2001) 192-207.
34.G.T. Cheek, W.E. O’Grady, J. Electroanal. Chem., 421 (1997) 173. 35.M. Wehrens-Dijksma, P.H.L. Notten, Electrochim. Acta, 51 (2006) 3609. 36.R. Etchenique, E.J. Calvo, J. Electrochem. Soc., 148(20010 A361.
37.V. Srinivasan, B.C. Cornilsen, J.W. Weidner, J. Solid State Electrochem., 9 (2005) 61. 38.J. Ord, Surf. Sci., 56 (1976) 413.
40.(a) W.C. Dautremont-Smith, Displays, 3 (1982) 67. (b) S. Gottesfeld, Appl. Phys. Lett., 33 (1978) 208.
41.(a) W.C.Dautremont-Smith, Displays, 3 (1982) 3. (b) F. Fabregat-Santiago, G. Garcia-Belmonte, J. Bisquert, Noemi S. Ferriols, P.R. Bueno, Elson, Longo, J.S. Anton, S. Castro-Garcia, J. Electrochem. Soc., 148 (2001) E302.
42.P. Oliva, J. Leonardi, J.F. Laurent, C. DElmas, J.J. Braconnier, M. Figlarz, F. Fievet, A. de Guibert, J. Power Sources, 8 (1982) 229.
43.(a) D.M. MacArthur, J. Electrochem,. Soc., 117 (1970) 422. (b) D.M. MacArthur, J. Electrochem. Soc., 117 (1970) 729.
44.S. Motupally, C.C. Streinz, J.W. Weidner, J. Electrochem. Soc., 145 (1998) 29.
45.T. Subbaiah, S.C. Mallick, K.G. Mishra, K. Sanjay, R.P. Das, J. Power Sources, 12 (2002) 562. 46.M. Murthy, G.S. Nagarajan, J.W. Weidner, J.W.Van Zee, J. Electrochem. Soc., 143 (1996) 2319. 47.L.D. Burke, P.F. Nugent, Gold Bull., 30 (1997) 43.
48.H. Bode, K. Dehmelt, J. Witte, Electrochim. Acta., 11 (1966)1079.
49.M.S. Kim, T.S. Hwang, K.B. Kim, J. Electrochem. Soc., 144 (1997) 1537. 50.M.S. Kim, K.B. Kim, J. Electrochem. Soc., 145 (1998) 507.
51.N. Sac-Epee, M.R. Palacin, B. Beaudoin, A. Delahaye-Vidal, T. Jamin, Y. Chabre, J.M. Tarascon, J. Electrochem. Soc., 144 (1997) 3896.
52.N. Sac-Epee, M.R. Palacin, A. Delahaye-Vidal, Y. Chabre, J.M. Tarascon, J. Electrochem. Soc., 145 (1998) 1434.
53.(a) D.M. MacArthur, J. Electrochem. Soc., 117 (1970) 422.(b) D.M. MacArthur, J. Electrochem. Soc., 117 (1970) 729.
54.A.H. Zimmerman, P.K. Effa, J. Electrochem. Soc., 129 (1984) 983.
55.(a) J.W. Weidner, P. Timmerman, J. Electrochem. Soc., 141 (1994) 346. (b) S. Motupally, C.C. Streinz, J.W. Weidner, J. Electrochem. Soc., 142 (1995) 1401.
56.Z. Mao, P. De Vidts, R.E. White, J. Newman, J. Electrochem. Soc., 141 (1994) 54.
57.M.E.G. Lyons, L. Russell, M. O’Brien, R.L. Doyle, I. Godwin, M.P. Brandon, Int. J. Electrochem. Sci.,7 (2012) 2710.
58.M.O’Brien, L. Russell, I. Godwin, R.L. Doyle, M.E.G. Lyons, ECS Transactions, 221st ECS Meeting, Seattle, Washington USA, May 2012, 45 (2012) in press.
59.L.D. Burke, D.P. Whelan, J. Electroanal. Chem., 162 (1984) 121.
60.D. O’Hare, K.H. Parker, C.P. Winlove, Medical Engineering & Physics, 28 (2006) 982.
61.(a) A. Osaka, T. Takatsuna, Y. Miura, J. Non-Crystalline Solids, 178 (1994) 313. (b) M.F. Yuen, I. Lauks, W.C. Dautremont-Smith, Solid State Ionics, 11 (1983) 19. (c) S. Yao, M. Wang, M. Madou, J. Electrochem. Soc., 148 (2001) H29-H36.
62.A.G.C. Kobussen, G.H.J. Boers, J. Electroanal. Chem., 126 (1981) 221. 63.M. Busch, E. Ahlberg, I. Panas, Phys. Chem. Chem. Phys., 13 (2011) 15069. 64.L.P. Wang, Q. Wu, T. Van Voorhis, Inorg. Chem., 49 (2010) 4543.
65.L. Duan, F. Bozoglian, S. Mandal, B. Stewart, T. Privalov, A. Llobet, L. Sun, Nature, 4 (2012) 418. 66.G.A. Lawrence, Introduction to Coordination Chemistry, p.199, J. Wiley & Sons, West Sussex,
UK, 2010.
67.X. Shen, Y.A. Small, J. Wang, P.B. Allen, M.V. Fernandez-Serra, M.S. Hybertsen, J.T. Muckerman, J. Phys. Chem.B, 114 (2010) 13695.
68.J. Rossmeisl, Z.W. Qu, H. Zhu, G.J. Kroes, J.K. Norskov, J. Electroanal. Chem., 607 (2007) 83. 69.(a) E.J.M. O’Sullivan, L.D. Burke, Proc. Symp. Electrocatalysis, W.E. O’Grady, P.N. Ross, F.G.
Will, Eds, Electrochemical Society, Pennington, NJ, 1982, pp.209-223. (b) E.J.M. O’Sullivan, L.D. Burke, J. Electrochem. Soc., 137 (1990) 466.

![Figure 12. Schematic representation for the redox switching mechanism associated with a-nickel hydroxide according to Hillman et al [33]](https://thumb-us.123doks.com/thumbv2/123dok_us/1931533.152720/16.596.132.465.139.534/schematic-representation-switching-mechanism-associated-hydroxide-according-hillman.webp)