City, University of London Institutional Repository
Citation
:
Fonseca, J., Bésuelle, P. & Viggiani, G. (2013). Microstructure evolution on
sandstones with different degrees of cementation. Paper presented at the Workshop on
Experimental Micromechanics for Geomaterials (ISSMGE TC101-TC105), 23-5-2013 -
24-5-2013, Hong Kong.
This is the accepted version of the paper.
This version of the publication may differ from the final published
version.
Permanent repository link:
http://openaccess.city.ac.uk/12098/
Link to published version
:
Copyright and reuse:
City Research Online aims to make research
outputs of City, University of London available to a wider audience.
Copyright and Moral Rights remain with the author(s) and/or copyright
holders. URLs from City Research Online may be freely distributed and
linked to.
City Research Online:
http://openaccess.city.ac.uk/
[email protected]
Microstructure evolution in sandstones with different degrees of
cementation
J. Fonseca, P. Bésuelle, G. Viggiani
Grenoble-INP, UJF-Grenoble 1, CNRS UMR 5521, Laboratoire 3SR, Grenoble F-38041, France
Keywords: fabric-structure of soils, soft rock, laboratory tests, x-ray micro-tomography
ABSTRACT
This study investigates the grain scale mechanisms that lead to failure by strain localisation in specimens of Fontainebleau sandstone with different degrees of cementation. While the effects of inter-particle bonding on the mechanical behaviour of granular geomaterials, including soft rocks, have been largely studied, the physical micro-scale mechanisms governing the material deformation are still poorly understood. In this study, laboratory techniques have been developed to allow a non-invasive investigation of the internal deformation of sandstones during triaxial compression to failure. The material investigated was Fontainebleau sandstone, a quartzite formation from the Paris Basin (France) which can be found as very hard, tightly cemented sandstone or more permeable and less cemented material. Specimens with porosities 6% and 21% were investigated. Triaxial compression tests at confining pressures of 2MPa and 7MPa were conducted on dry cylindrical specimens of 11mm diameter by 22mm height. Three-dimensional images of the full specimen were obtained by carrying out x-ray micro-tomography scans at key points throughout the test. The high-resolution tomographic images have a voxel size of 8.5m (0.033d50) allowing a clear identification of the grains. The analysis suggests that dilatancy of the material which depends on the degree of bonding between grains, plays a fundamental role on the failure mode of the granular media.
1. INTRODUCTION
Predicting the occurrence of failure in cohesive geomaterials by strain localisation is a key aspect in many geotechnical applications, e.g., drilling technology, nuclear waste disposal and sequestration of carbon dioxide. Previous studies have shown that the failure mechanisms in porous soft rocks are highly dependent on the stress level (e.g., Sulem and Ouffroukh, 2006; Bésuelle et al., 2000). Deformation bands have mechanical and structural evolutions that distinguish them from fractures and slip surfaces and in the case of permeability reduction, these bands could act as barriers to fluid flow in otherwise more permeable rock, impacting extraction and storage of fluids (e.g., Issen and Rudnicki, 2000; Fossen et al., 2007). This study investigates the deformation of sandstones with different degrees of cementation tested in triaxial compression at different confining pressures and the micro-scale mechanisms associated to the macroscopic behaviour.
2. EXPERIMENTAL METHOD 2.1. Material description
permeable and less cemented material. In its intact state this rock can be found with in a wide range of porosities varying from 2% to 30% without noticeable grain size modification (Bourbie and Zinszner, 1985). Silicification processes occurring after deposition of Fontainebleau sands, have developed grain cementation by quartz overgrowths (Grisoni and Thiry, 1988; Thiry et al., 1988). Subangular grains with some very angular facets, rare grain interpenetrations and an absence of matrix material characterise this shallowly buried sandstone (Thiry and Marechal, 2001).
In this study specimens from two different locations and with porosities of 6% and 21% were used. This difference in porosity is a consequence of the degree of cementation which results in two very distinct micro-structures, as illustrated in Figures 1(a) and 1(b). Figure 1(a) shows a section through x-ray tomographic data (acquired at a resolution 6.5m) for the stiff sandstone, i.e. the specimen with 6% porosity. This material exhibits a very dense packing with abundant subhedral overgrowths that have developed during sandstone cementation (Thiry and Marechal, 2001). Polygonal contacts, rectilinear and often convergent to triple junctions can be observed. The microstructure of the soft sandstone (21% porosity) is shown in Figure 2(a). This lightly cemented material exhibits nonetheless a dense packing with extensive contacts between grains. These microstructure characteristics are often associated with a locked structure (Dusseault and Morgenstern, 1979). The topology of this sandstone presents large similarities with Reigate sand (from Southeast England), a locked sand with virtually no bonding between grains and for which this strong fabric plays a fundamental role on the behaviour of the intact material (Fonseca et al. 2012). Fontainebleau is not likely to fit into the locked material classification; it is a geological recent formation and does not appear to exhibit interpenetrative or sutured contacts. The subangular particle shape and the existence of grains with flat sides allows the formation of extensive contacts which could have an impact on the shear stiffness and peak strength of the material (Fonseca et al. 2013a).
Figure 1: Sections through x-ray tomographic data of Fontainebleau sandstone with (a) 6% porosity and (b) 21% porosity
2.1. Triaxial tests
The specimens were cored from large blocks retrieved from the site to approximately 11mm diameter and the length of the cylindrical cores was reduced to approximately 22mm using a coarse sand paper. The ends of the cylinder were smoothed using a very thin layer of epoxy resin. This resin layer allowed smoothing the ends of the sample, avoiding leakage due to damage of the membrane, as well as helping to obtain flat and parallel ends. This technique was particular helpful for the stiff material given the difficulty in obtaining flat ends by grain plucking as the grains tend to be removed in small clusters rather than individual grains.
[image:3.612.139.476.369.546.2]The triaxial compression tests were carried out on dry specimens following isotropic compression at pressures of 2MPa and 7MPa. The tests were performed in a small high-pressure triaxial cell designed to operate inside the x-ray scanner, which allows in-situ scans to be carried out (in-situ
meaning x-ray scanning at the same time as loading). Deviatoric loading was applied by an ascending piston at a rate of 21m/min. Between six and seven loading stages were imaged during each test, as indicated in Figure 2. The scans were taken at a spatial resolution of 8.5m, which means that the diameter of a mean size grain is represented by approximately 30 pixels. Due to detector size limitations, the top and bottom parts of the sample were scanned separately and stitched together to obtain the full specimen.
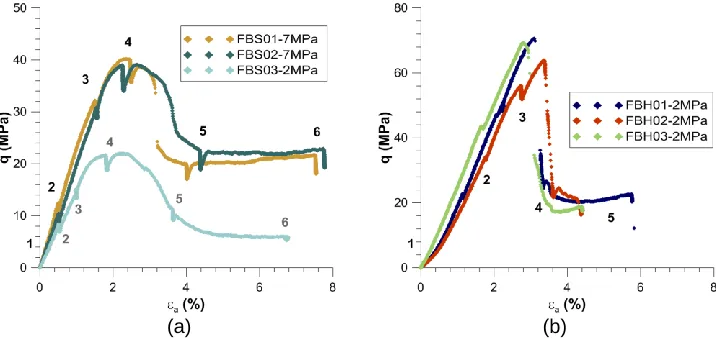
Figure 2 shows the mechanical response of all the soft and stiff specimens. The loading stages chosen for imaging are marked by small axial stress relaxations, taking place in a few minutes when the loading is stopped in order to perform an x-ray scan. It takes approximately 4hrs to scan top and bottom of the specimen.
For the soft material (Figure 2a) two samples were tested at 7MPa and one sample at 2MPa. The three specimens exhibit brittle behaviour when subjected to an increase in deviatoric stress with the specimens tested at 7MPa showing a higher peak and residual stresses. The results presented in Fonseca et al. (2013b) for the 2MPa confining pressure test showed a more gradual reduction towards a residual stress level which is believed to be related to the variations of confining pressure throughout the test. This may suggest that the cement between grains is damaged during isotropic unloading as reported by Alvarado et al. (2012) for weak sandstones. Once unbonded, the grains are less restrained to rearrange and consequently the deformations are less localised leading to the formation of multiple and diffuse shear planes. All the specimens had end lubrication with exception of sample FBS01-7MPa and this may explain the slight difference between FBS01-7MPa and FBS02-7MPa in the strain softening regime.
Figure 2(b) shows the behaviour of the three stiff specimens tested at 2MPa (higher pressures were not possible due to the axial transducer limitation of 10kN). The material shows a brittle behaviour up to peak stress, followed by an abrupt drop to a residual stress value.
(a) (b)
Figure 2: Sress-strain curve for the specimens tested with indication of the loading stages chosen for imaging (marked by small relaxations in the stress deviator) for the (a) soft sandstone (b) stiff
sandstone
3. OBSERVATIONS
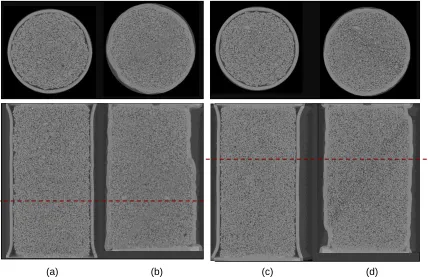
[image:4.612.128.486.418.587.2]48º for the 2MPa and 7MPa respectively. Figure 3 shows cross sections (perpendicular to the axis of symmetry of the specimen) and vertical sections taken at load stage 0 (prior to isotropic loading) and load stage 6 for the samples FBS02-7MPa and 2MPa respectively. The shear zone can be clearly identified as a region of intense grain breakage and for the 7MPa samples intense grain crushing as well. The thickness is approximately 4-6d50 (1.5 mm). The fundamental difference observed in the shear band for the last stage of loading was that the FBS02-7MPa specimen shows a void space invariably filled with crushed material while the 2MPa exhibit both large clean voids and in some parts small grain fragments fill the pore space. Despite the grain damaged observed for the FBS02-7MPa sample, some large grains remain apparently intact. Outside the shear band, grain fracturing can be observed throughout the specimen with a significant number of fractures showing an orientation close to the vertical direction, i.e. parallel to the orientation of the major stress, again this phenomenon is more pronounced in the FBS02-7MPa specimen. Following the formation of the shear band in the soft material the consequent development of two sliding rigid bodies, three regions can be identified with respect to the kinematics of the grains. The shear plane that has unique deformation characteristics, the region above the shear plane, where the changes are almost insignificant and the lower part of the shear band where the grains undergo small displacements and rotations as the material exhibits considerable dilation.
[image:5.612.94.522.290.567.2](a) (b) (c) (d)
Figure 3: Cross sections (top) and vertical sections (bottom) for the (a) sample FBS02-7MPa at load stage 0 (b) sample FBS02-7MPa at load stage 6 (c) sample FBS03-2MPa at load stage 0 (d) sample FBS03-2MPa at load stage 6, (Location of the cross section indicated by the dashed line)
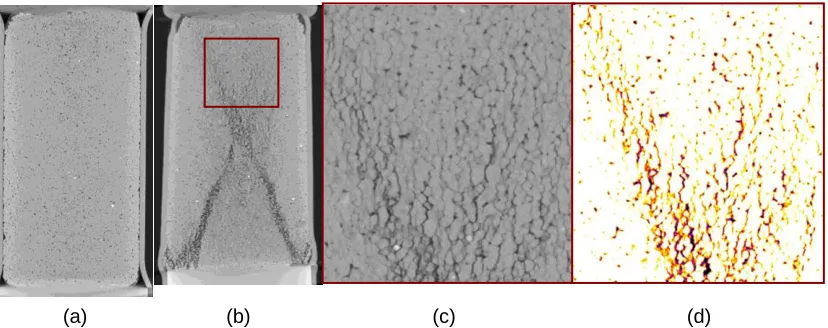
grains. As illustrated in the vertical sections from Figure 5, the cement breaks along vertical ridges which allow the formation of vertical columns of horizontally unbonded grains able to transfer stresses along the direction of the major principal stress direction. Grain crushing was observed in the regions of more intense deformation. Some grains seem to deform in small clusters in which contacts between grains are preserved. Fissures in the grains as observed for the soft FBS02-7MPa test are not found in the stiff material which is believed to be related to the cement that works as a coating against grain susceptibility to open small cracks.
[image:6.612.94.525.163.295.2](a) (b) (c) (d)
Figure 4: Cross sections of the sample tested at FBH01-2MPa at the following stages: (a) prior to loading (b) loading stage 3 (c) stage 4 and (d) stage 5
(a) (b) (c) (d)
Figure 5: Vertical sections of the sample FBH02-2MPa (a) prior to loading (b) at the last stage of loading (c) detailed view of region marked in (b) and (d) detailed image highlighting the regions of
cement damage
4. SUMMARY AND CONCLUSIONS
[image:6.612.102.516.346.510.2]sandstone prior to loading have not shown signs of pre-existing cracks as it would be expected for this shallow buried sandstone that was unlikely to have experienced large inter-particle stresses during the diagenesis process.
The formation and evolution of a deformation band involves, generally, grain rotation and translation. The examples shown in this study indicate that these bands can include grain crushing or merely rotation and frictional sliding along grain boundaries. Significant differences were found in the shear band of the soft material tested at different confining pressures which suggest a direct implication of the confining pressure on the permeability of the material post-failure.
The dilatancy characteristics which depend on the degree of bonding between grains play a fundamental role on the failure mode of the material. In the soft sandstone, local rupture of the cement leads to shear banding and associated dilation of the material. For the stiff sandstone initial crack propagation through the cement appears to occur followed by shear deformation of the material with further damage of the cement and a consequent ability of the grains to rearrange either individually or in clusters.
This qualitative analysis has shown that important insights into the micro-scale deformation of a cohesive material can be gained using 3D images acquired during loading. Future work will focus on the development of tools for a quantitative description into the mechanisms that underlie the complexity of the material response.
5. ACKNOWLEDGEMENTS
This work was carried out within the framework of the project GEOBRIDGE funded by the French research agency, ANR (contract number: ANR-09-BLAN-0096).
6. REFERENCES
Alvarado, G., Coop, M.R., and Willson, S.M. 2012. On the role of bond breakage due to unloading in the behaviour of weak sandstones. Géotechnique, 62(4): 303–316. doi:10.1680/geot.8.P.017
Bésuelle P., Desrues J., and Raynaud S. (2000) Experimental characterisation of the localisation phenomenon inside a Vosges sandstone in a triaxial cell. Int. J. R. M. Min. Sci., 37(8) 1223-1237
Dusseault, M.B., and Morgenstern, N.R. (1979) Locked sands. Journal Eng. Geology,12, 117-131
Fonseca, J., O’Sullivan, C., Coop, MR. and Lee, P.D. (2013a) Quantifying the evolution of soil fabric during shearing using scalar parameters Géotechnique, in print
Fonseca, J, Bésuelle P., Viggiani, G. (2013b) An experimental study of micro-scale deformation in a soft sandstone, Proceeding of the 1st Int. Conf. on Tomography of Materials and Structures
Fonseca, J., O’Sullivan, C., Coop, MR. and Lee, P.D. (2012) Quantifying the evolution of soil fabric during shearing using directional parameters. Géotechnique, 10.1680/geot.12.P.003
Fossen, H., Schultz, R. A., Shipton, Z. K. And Mair, K. (2007) Deformation bands in sandstone: a review, Journal of the Geological Society, London,164, 755-769
Grisoni, J .C. and Thiry M. (1988) - Répartition des grès dans les Sables de Fontainebleau. implications géotechniques des études récentes. Bull. Liaison Lab P. et Ch., 157
Issen, K.A. and Rudnicki, J.W., (2000) Conditions for compaction bands in porous rock. Journal of Geophysical Research, 105, 21529-21536.
flow in Berea sandstone. Journal of Structural Geology,18,1-16.
Sulem, J. and Ouffroukh, H. (2006) Shear banding in drained and undrained triaxial tests on a saturated sandstone: Porosity and permeability evolution Int. J. Rock Mech Min. Sci., 43, 292-310
Thiry, M., Bertrand-Ayrault, M., and Grisoni, J.C., (1988) Ground water silicification and leaching in sands: Example of the Fontainebleau Sand (Oligocene) in the Paris Basin: Geological Society of America, Bulletin, 100, 1283-1290.