City, University of London Institutional Repository
Citation
: Crabb, D. P., Smith, N. D., Glen, F., Burton, R. and Garway-Heath, D. F. (2013).
How does glaucoma look?: Patient perception of visual field loss. Ophthalmology, 120(6),
pp. 1120-1126. doi: 10.1016/j.ophtha.2012.11.043
This is the accepted version of the paper.
This version of the publication may differ from the final published
version.
Permanent repository link:
http://openaccess.city.ac.uk/6157/
Link to published version
: http://dx.doi.org/10.1016/j.ophtha.2012.11.043
Copyright and reuse:
City Research Online aims to make research
outputs of City, University of London available to a wider audience.
Copyright and Moral Rights remain with the author(s) and/or copyright
holders. URLs from City Research Online may be freely distributed and
linked to.
City Research Online:
http://openaccess.city.ac.uk/
[email protected]
How Does Glaucoma Look?
Patient Perception of Visual Field Loss
David P. Crabb, PhD,
1Nicholas D. Smith, PhD,
1Fiona C. Glen, PhD,
1Robyn Burton, BSc,
1David F. Garway-Heath, MD
2Objective:
To explore patient perception of vision loss in glaucoma and, specifically, to test the hypothesis
that patients do not recognize their impairment as a black tunnel effect or as black patches in their field of view.
Design:
Clinic-based cross-sectional study.
Participants:
Fifty patients (age range, 52– 82 years) with visual acuity better than 20/30 and with a range of
glaucomatous visual field (VF) defects in both eyes, excluding those with very advanced disease (perimetrically
blind).
Methods:
Participants underwent monocular VF testing in both eyes using a Humphrey Field Analyzer (HFA;
Carl Zeiss Meditec, Dublin, CA; 24 –2 Swedish interactive threshold algorithm standard tests) and other tests of
visual function. Participants took part in a recorded interview during which they were asked if they were aware
of their VF loss; if so, there were encouraged to describe it in their own words. Participants were shown 6 images
modified in a variety of ways on a computer monitor and were asked to select the image that most closely
represented their perception of their VF loss.
Main Outcome Measures:
Forced choice of an image best representing glaucomatous vision impairment.
Results:
Participants had a range of VF defect severity: average HFA mean deviation was
⫺
8.7 dB (standard
deviation [SD], 5.8 dB) and
⫺
10.5 dB (SD, 7.1 dB) in the right and left eyes, respectively. Thirteen patients (26%;
95% confidence interval [CI], 15%– 40%) reported being completely unaware of their vision loss. None of the
patients chose the images with a distinct black tunnel effect or black patches. Only 2 patients (4%; 95% CI,
0%–14%) chose the image with a tunnel effect with blurred edges. An image depicting blurred patches and
another with missing patches was chosen by 54% (95% CI, 39%– 68%) and 16% (95% CI, 7%–29%) of the
patients, respectively. Content analysis of the transcripts from the recorded interviews indicated a frequent use
of descriptors of visual symptoms associated with reported blur and missing features.
Conclusions:
Patients with glaucoma do not perceive their vision loss as a black tunnel effect or as black
patches masking their field of view. These findings are important in the context of depicting the effects of
glaucomatous vision loss and raising awareness for glaucoma detection.
Financial Disclosure(s):
The author(s) have no proprietary or commercial interest in any materials discussed
in this article.
Ophthalmology 2013;xx:xxx © 2013 by the American Academy of Ophthalmology.
Entering the term
glaucoma
into an Internet search engine
will return a plethora of images illustrating what a patient
with the disease is believed to see. Most of these images,
typically developed for patient information and glaucoma
awareness programs, imply that a patient’s perception of
the world is through a black tunnel, or with parts of their
field of view obscured by black patches. Most clinicians
and most patients with the disease know this is a
mis-representation. Perception of visual field (VF) loss is far
more complex, yet there is a paucity of research evidence
directly assessing how patients with glaucoma actually
describe their awareness of VF loss. Assembling an
ev-idence base of what patients see, and what they do not
see, would be helpful for at least 2 reasons. First, it would
aid raising awareness of the true symptoms of the
condition—particularly important because estimates of
those with the disease who remain undiagnosed are so
high.
1,2Second, it may help patient adherence to their
treatment regimen if they are falsely reassured about not
having the severe symptoms depicted by the typical
im-ages of how glaucoma patients see.
Good evidence, reviewed extensively elsewhere,
3–5is
beginning to emerge highlighting the impact of
glaucoma-tous VF loss on everyday function. Nevertheless, results
from clinical tests of vision do not necessarily correlate well
with patients’ perception of their vision.
6,7For example,
some patients are surprised to find there is something wrong
with their vision or attribute noted changes to the normal
ageing process, and this is supported by qualitative studies
investigating patient perception of glaucoma.
8Perimetric
largely are underappreciated, yet provide an explanation for
the asymptomatic nature of glaucoma until late stages in the
disease process. One report speculated that cortical
reorga-nization, in concert with resulting filling in, almost certainly
affects the recognition of VF loss in glaucoma and used this
premise to design some helpful images illustrating how
these phenomena would look to patients.
11To our
knowl-edge, there has been no direct assessment of patient
descrip-tions of the perception of glaucomatous VF loss. Having a
narrative directly from patients themselves would be helpful
in constructing images and films of what is seen and,
perhaps more importantly, dispelling myths about how
glaucoma is meant to look to the person with the condition.
The main aim of this report was to test the hypothesis
that patients with bilateral glaucoma would not choose to
describe their perception of VF loss as a black tunnel effect
or as black areas masking their field of view. By using
open-ended interview questions, the study also aimed to
investigate how patients describe the perception of their
functional impairment and how this manifests in their
day-to-day life.
Patients and Methods
The target population for this study was patients with glaucoma between 50 and 80 years of age with a range of VF loss in both eyes. Patients were recruited from a convenience sample from Moorfields Eye Hospital NHS Foundation Trust, London, United Kingdom, and all had an established clinical diagnosis of primary open-angle glaucoma in both eyes. Glaucomatous VF loss was defined as repeatable Glaucoma Hemifield Test results outside normal limits according to the Humphrey Field Analyzer (HFA; Carl Zeiss Meditec, Dublin, CA) at their most recent clinic visit. The HFA mean deviation (MD) from the eye with the better MD (better eye MD [BEMD]) was used as an estimate of VF defect severity. Mean deviation is a standard age-corrected clinical mea-sure of the overall severity of VF loss, with more negative values indicating greater VF loss.
Participants were included only if they had a corrected binoc-ular visual acuity of 0.18 logarithm of the minimum angle of resolution units or better (Snellen equivalent, 20/30), as measured by an Early Treatment Diabetic Retinopathy Study chart. Astig-matic error was less than ⫾2.5 diopters in all those recruited. Participants underwent slit-lamp biomicroscopy performed by an ophthalmologist and were not recruited if they had any other ocular disease (except for uncomplicated cataract surgery). To attempt to eliminate further significant media opacity (cataract) and other ocular media-type confounding conditions, all partici-pants were required to have results within normal limits for light scattering in the ocular media using the Oculus C-Quant straylight meter (Oculus Optikgerate GmbH, Wetzlar, Germany). The study was approved by the Ethics Committee for the School of Health Sciences, City University London, and the National Health Service–approved Moorfields and Whittington Hospital Research Ethics Committee. Written informed consent, according to the tenets of the Declaration of Helsinki, was obtained from each participant before examination. All the data from the study, with patient identifiers removed, were transferred to a secure computer at the university.
Fifty participants were recruited. For the study itself, all pa-tients underwent the following measurements: binocular visual acuity with an Early Treatment Diabetic Retinopathy Study chart, binocular contrast sensitivity (CS) with a Pelli-Robson chart, and
monocular VF testing in both eyes using an HFA (24-2 Swedish interactive threshold algorithm standard tests). For the latter, HFA reliability criteria using fixation losses less than 25% and false-positive responses less than 15% were applied. All testing was performed in 1 session, but with adequate rest times between tests. A forced-choice experiment was used to select an image that best represented the patient’s perception of their VF loss. Six candidate images (Fig 1) were shown to the patients on a 13.3-inch liquid crystal display computer monitor at a distance of 40 cm (with appropriate refractive correction), covering the full area of the screen. For all 6 images, the same outdoor scene was used, but each image was manipulated with Adobe Photoshop (Creative Suite 5; Adobe Systems Inc., San Jose, CA) to provide views of the image obscured and degraded in a range of distinct ways: a tunnel with black edges, a tunnel with blurred edges, black patches, blurred patches, and missing patches. For the latter, the Photoshop content-aware fill tool was used to create a filling-in effect. After the unmodified (original) image was shown, the others were dis-played to the study participant in random order. Images were viewed binocularly. The patients were allowed to toggle between the images, but they were asked simply to make a forced-choice decision about which of the 6 most closely related to their percep-tion of their visual loss with glaucoma. Features about the images deliberately were not explained to the patients.
Patients then were asked 2 open-ended questions, and their responses were recorded: (1) In your own words, could you de-scribe how your glaucoma affects your vision? and (2) When you are aware of your visual field loss, can you describe how it looks, or how it impacts your vision and everyday life? Patients deliber-ately were encouraged to say as much as they could in response to the questions. The interviewers (N.D.S., F.C.G., and R.B.) took special care to avoid saying anything that could be interpreted as leading or coercive, and their interaction was limited to indirect probes. All the recorded interviews were transcribed and are freely available from the authors.
Statistical Analysis
The responses to the forced-choice experiment were counted and compared using statistics for proportions. Summary statistics for BEMD were calculated and compared for the groups of patients choosing a particular image. An integrated VF (IVF) also was constructed for each patient to give a representation of their binocular VF.12,13This method involves the combination of the
measured monocular VFs simply by taking the best sensitivity value at each corresponding test point to represent the person’s binocular VF. Grayscales of the IVFs were generated using Pro-gressor software (Medisoft, Ltd., Leeds, UK). Integrated VF MD values (computed as the mean of all the point-by-point total deviation values from the IVF) were calculated to take account of any intereye asymmetry of VF defects and were used to compare groups of patients choosing a particular image.
The transcribed interviews were subjected to a form of content analysis.14 Each transcript was assessed by highlighting words
considered to be a descriptor of the symptoms of perception of glaucoma or how a VF loss looks. This was performed by 3 of the authors (D.P.C., N.D.S., and F.C.G.) arriving at a consensus about a definition of a descriptor and whether a word or term was meaningful. For example, blurry, blurred, blurs, and blurriness
were all considered to be derived from the verbblur. If, however, a patient used, for example,foggy,smear, orblot, then these would be considered separate descriptors. Frequency of the occurrence of identified terms was calculated as the number of participants who used the word; if, for example, a patient used the wordblur4 times during their interview, then this would count only as 1 occurrence. Also, only positive descriptors were identified and counted. So for
Ophthalmology
Volume xx, Number x, Month 2013
example, if a patient said, “My vision is not blurred,” then this was not counted. The same analysis was conducted for words used to describe everyday activities used by participants as examples of when they were aware of their vision impairment.
Results
The mean age of the 50 patients was 70 years (standard deviation [SD], 7 years). Twenty-six of the patients (52%) were female. The
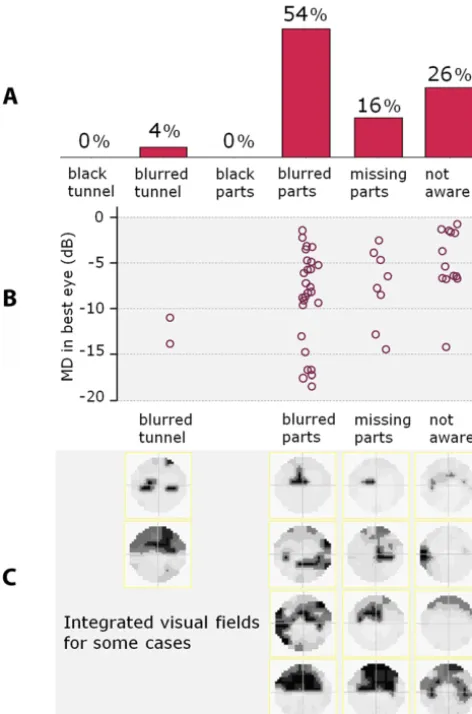
[image:4.594.102.486.53.568.2]patients had a range of VF defect severity: average HFA 24-2 MD was⫺8.7 dB (SD, 5.8 dB),⫺10.5 dB (SD, 7.1 dB), and⫺7.3 dB (SD, 5.7 dB) in the right eye, left eye, and best eye (BEMD), respectively. The mean binocular CS and visual acuity of the patients was 1.8 Pelli-Robson log CS (SD, 0.18 PR log CS) and 0.07 logarithm of the minimum angle of resolution units (SD, 0.10 logarithm of the minimum angle of resolution units), respectively. The results for the forced-choice image experiment are shown inFigure 2A. None of the 50 participants in this study chose the image altered to have a tunnel with black edges effect or the image
with black patches. Thirteen participants (26%; 95% confidence interval [CI], 15%– 40%) were completely unaware of their VF defect affecting their visual function, choosing the original uned-ited image. Twenty-seven participants (54%; 95% CI, 39%– 68%) and 8 participants (16%; 95% CI, 7%–29%) chose the images with blurred patches and missing patches, respectively. Only 2 partic-ipants chose the image with a tunnel with blurred edges (4%; 95% CI, 0%–14%). Figure 2B shows individual BEMD for patients stratified by their choice of image. There was some statistical evidence that patients unaware of their VF loss had better average BEMD compared with those who chose altered images (one-way analysis of variance on BEMD stratified by choice of image [group]:F⫽3.0,P⫽0.04). Similar results were observed with the IVF MD (1-way analysis of variance on IVF MD stratified by choice of image [group]: F ⫽ 3.7, P ⫽ 0.02). However, the distribution of values for BEMD (and IVF MD) in each group was wide; some participants with similar severity and type of VF defect reported different perceptions.Figure 2C shows IVF grayscales for some of the patients in each group. There was no statistical
evidence of any average differences in CS between the groups choosing different images (1-way analysis of variance:F⬍1,P⫽
0.42).
The most frequently used descriptor of a VF defect wasmissing
(n⫽10) andblur(n⫽6). Other synonyms ofmissing(e.g.,blank,
blind spot, hole) and blur (foggy, fuzzy, unfocused) also were evident. Only 1 person in the study usedblackas a descriptor, and not 1 of the 50 participants used the wordtunnel. The results are shown inFigure 3A as a word cloud (www.wordle.net; accessed July 1, 2012). The size of a word in the visualization is propor-tional to the frequency of its use by the participants in the study. Similarly, results for the named everyday activities where a VF loss was noted by an individual also is shown as a word cloud in
Figure 3B.
Discussion
This study provided some evidence, from patients
them-selves, about the visual symptoms of glaucoma. The study
sample represented a population of patients with a range of
VF loss in both eyes (Fig 2B), with more than one fifth
having quite advanced VF loss (MD worse than
⫺
12 dB in
both eyes). Twenty-six percent of the patients (typically
with better MD values) reported no visual symptoms,
con-firming the frequently reported asymptomatic nature of the
disease even in the presence of diagnosed bilateral VF loss.
The main finding is that patients with visual symptoms do
not report seeing black areas in their field of view, as is
commonly (but incorrectly) shown in images and
simula-tions of what patients with the condition are believed to
perceive. Moreover, tunnel vision does not adequately
de-scribe the visual experience of patients in this study; a
combination of perceiving blur and missing areas seems to
be the main visual indications of the condition. The
narra-tives from patients themselves provide an interesting
per-sonal insight into symptoms. (Some excerpts are given in
Fig 4.)
Insights into the subjective perception of VF loss have
been considered previously
11; however, to our knowledge,
this study is the first to attempt to have patients with
glaucoma actually describe what they see. Eloquent
descrip-tions of visual symptoms from patients with other
retinop-athies have been reported,
15–18and this has, for example,
led to appropriate simulations and pictures of vision with
macular disease.
19The results from this study are important in terms of
stimulating the design of appropriate information about the
visual symptoms of glaucoma. There has been a shift in the
role of the patient from passive recipient to active consumer
of health information, especially via the Internet.
20The
quality of Internet information about glaucoma accessed by
patients has been shown to be in need of improvement
(Zaidi F, Ansari E. Glaucoma and the Internet. Paper
pre-sented at: 2010 European Association for Vision and Eye
Research Conference, October 9, 2010; Crete. Acta
Oph-thalmologica 2010;88(Suppl):S246). All stakeholders with
an interest in glaucoma, including patients, patient groups,
clinicians, researchers, and glaucoma societies, could start
by ensuring that depiction of the symptoms of the disease,
especially on the Internet, are as realistic as possible before
Figure 2. A,Bar graph showing the percentage of participants who chose
an image with attributes as described.B,Graph showing the distribution
of participants’ best eye Humphrey mean deviation (MD) stratified by their selected image, with each point representing an individual partici-pant. (Horizontal jitter has been used to displace the points to make the
distributions easier to see.) C, Grayscale representations of integrated
visual fields for some of the participants, again stratified by their choice of
image. dB⫽decibels.
Ophthalmology
Volume xx, Number x, Month 2013
[image:5.594.44.280.54.411.2]they are published. Providing realistic insights about
pa-tients’ symptoms may be helpful for educational and public
awareness material associated with glaucoma; the results
from this report should be considered carefully in this
context.
The results from this study also have important clinical
implications. Many patients eloquently articulated the
re-current phenomena of noting part of the VF as missing or
described their functional loss as a type of blur. These
responses seem orthogonal to the conventional view of the
visual symptoms associated with glaucoma, which include
the simplified view of narrowing of the peripheral VF.
These findings therefore are relevant to the practitioner in
primary eye care responsible for screening and identifying
cases of glaucoma, especially when making the differential
diagnosis between the need for a refractive prescription or
correctable vision loss and investigating a complaint of, for
instance, blur as a potential symptom of glaucoma. The
results from this study also are relevant to the dialogue
between the clinician and diagnosed patient about
adher-ence to treatment and worsening of visual symptoms,
espe-cially in the context of the patient who may think their
disease is not severe enough to see, for example, black
patches in their field of view. Linked to this suggestion is
the idea that the doctor–patient relationship may be
strengthened if the doctor can demonstrate that he or she
appreciates the impact of the disease on the patient. After
all, research evidence has indicated the importance of the
role of a clinician as an educator to bridge the gap in
knowledge transfer and to encourage adherence to
treat-ment.
21,22Interestingly, in response to the open-ended
ques-tions, some patients clearly did not relate their perception of
lack of vision to the greyscale output on the VF chart. The
results from this study should prompt those involved in
research and development of perimetry to think of
imagi-native graphical ways of restoring the important connection
between the VF measurement and what the patient
per-ceives of their condition. A starting point could be the use
of binocular representations like the IVF.
23 [image:6.594.101.484.58.391.2]When participants were asked to name everyday
situa-tions when they noted the impact of their VF loss, many of
the themes reported in studies of quality of life and visual
disability in the patient with glaucoma re-emerged. For
example, mobility, driving, fear and experience of falling,
and reading all were mentioned consistently (Fig 3). It was
noteworthy that many of the participants in this study
be-came more aware of the vision loss at night, and this has
been highlighted previously as a perceived impairment in
Figure 3. A,A word cloud (www.wordle.net; accessed July 1, 2012) showing the occurrence of descriptors of glaucomatous vision loss calculated as the
number of participants who used the term. The size of a word in the visualization is proportional to the frequency of its use.B,A similar word cloud of
glaucoma.
24An everyday activity that has received little
attention in glaucoma, but has emerged here as being
asso-ciated commonly with recognizing symptoms, was
puter use, especially locating the cursor and using the
com-puter mouse. Perhaps this is reflective of the increasing use
of computers and the Internet in an elderly population.
25This list of activities where visual symptoms are noted can
be considered to be only illustrative; fortunately,
well-designed research in this area using patient-reported
out-comes and performance-based measures is gathering
mo-mentum and should provide better evidence of the impact of
the disease on quality of life.
4,5This study has some limitations. The sample size was
sufficient to test the main hypothesis that patients with
bilateral glaucoma do not describe their visual symptoms as
a black tunnel effect or as seeing black patches. Yet the size
and distribution of the sample was not broad enough to
untangle any specific relationship between the type of VF
defect and reported symptoms. The example cases in
Figure
3
show no obvious pattern in a binocular VF (IVF) being
associated with a certain description, although preservation
of the VF in points adjacent to fixation was a notable feature
in those patients declaring no visual symptoms resulting
from their condition. Of course, these results may not apply
to a population of patients with, for example, only a very
small island of preserved central binocular VF or with very
advanced VF loss worse than a MD of
⫺
20 dB in both eyes.
Yet none of the participants who came close to the latter
category reported seeing black in their field of view.
An-other shortcoming of the study was the forced-choice
ex-periment itself and the investigator-driven creation of the
images, limiting the possibilities of describing individual
visual symptoms. Furthermore, patients obviously looked at
the images with their visual symptoms, meaning it may be
difficult to disambiguate what they perceive from what has
been modified. Also, representing vision loss as static defects
in an image may not illicit the same response from patients as
a defect that maintains a constant position with respect to the
point of regard. Nevertheless, patients understood the task at
hand sufficiently well to be able to describe the impact of their
glaucoma on their visual experience, and any bias is unlikely to
interfere with the main findings about the black tunnel effect or
seeing black patches. Note that a sample of patients
volunteer-ing for a study where they know they are expected to describe
symptoms and, to some extent, discuss feelings about their
disease are not representative of all patients, many of whom
may be embarrassed or reticent about their condition. Finally,
the open-ended questions generated only a simple list of
vo-cabulary of the symptoms of the condition, but more
sophis-ticated qualitative research approaches, perhaps using a focus
group design, could yield a more complete narrative about
patient perception of the condition. A between-eye study in
individual patients evaluating monocular perception of VF
defects also would be informative.
In summary, this study showed that patients with
glau-coma do not see black areas in their field of view. These
results are mainly important in the context of raising
aware-ness for glaucoma detection and in developing appropriate
information about the disease. In conclusion, the study
provides evidence from patients themselves to contradict
the common depiction of the visual symptoms of glaucoma:
the end of the black tunnel.
Acknowledgments.The authors thank Ryo Asaoka for his help with patient recruitment and ophthalmic examinations.
References
1. Cedrone C, Mancino R, Cerulli A, et al. Epidemiology of primary glaucoma: prevalence, incidence, and blinding ef-fects. Prog Brain Res 2008;173:3–14.
2. Burr JM, Mowatt G, Hernández R, et al. The clinical effec-tiveness and cost-effeceffec-tiveness of screening for open angle glaucoma: a systematic review and economic evaluation. Health Technol Assess 2007;11(41):iii–iv, ix–x, 1–190. 3. Spaeth G, Walt J, Keener J. Evaluation of quality of life
for patients with glaucoma. Am J Ophthalmol 2006; 141(suppl):S3–14.
4. Ramulu P. Glaucoma and disability: which tasks are affected, and at what stage of disease? Curr Opin Ophthalmol 2009;20: 92– 8.
5. Glen FC, Crabb DP, Garway-Heath DF. The direction of research into visual disability and quality of life in glaucoma. BMC Ophthalmol [serial online] 2011;11:19. Available at:
http://www.biomedcentral.com/1471-2415/11/19.Accessed No-vember 8, 2012.
6. Richman J, Lorenzana LL, Lankaranian D, et al. Relationships in glaucoma patients between standard vision tests, quality of life, and ability to perform daily activities. Ophthalmic Epi-demiol 2010;17:144 –51.
7. Jampel HD, Schwartz A, Pollack I, et al. Glaucoma patients’ assessment of their visual function and quality of life. J Glaucoma 2002;11:154 – 63.
8. Green J, Siddall H, Murdoch I. Learning to live with glaucoma: a qualitative study of diagnosis and the impact of sight loss. Soc Sci Med 2002;55:257– 67.
Figure 4. Excerpts from the transcripts of the response to the question “How does glaucoma look?” from 4 participants in the study.
Ophthalmology
Volume xx, Number x, Month 2013
9. Safran AB, Landis T. From cortical plasticity to unaware-ness of visual field defects. J Neuroophthalmol 1999;19: 84 – 8.
10. Ramachandran VS, Gregory RL. Perceptual filling in of arti-ficially induced scotomas in human vision. Nature 1991;350: 699 –702.
11. Hoste AM. New insights into the subjective perception of visual field defects. Bull Soc Belge Ophtalmol 2003;(287): 65–71.
12. Crabb DP, Viswanathan AC. Integrated visual fields: a new approach to measuring the binocular field of view and visual disability. Graefes Arch Clin Exp Ophthalmol 2005;243: 210 – 6.
13. Owen VM, Crabb DP, White ET, et al. Glaucoma and fitness to drive: using binocular visual fields to predict a milestone to blindness. Invest Ophthalmol Vis Sci 2008; 49:2449 –55.
14. Bowling A. Research Methods in Health: Investigating Health and Health Services. 2nd ed. Philadelphia, PA: Open Univer-sity Press; 2002:387–9.
15. Sperduto RD, Ferris FL III, Hagler WS, Billings TE. Senile macular degeneration: an artist’s view. JAMA 1983;250: 2506 –7.
16. Allen L, Thompson HS, Folk JC. The Hole in My Vision: An Artist’s View of His Own Age-Related Macular Degeneration. Iowa City, IA: Penfield Press; 2000.
17. Marmor MF. A brief history of macular grids: from Thomas Reid to Edvard Munch and Marc Amsler. Surv Ophthalmol 2000;44:343–53.
18. Crabtree HL, Hildreth AJ, O’Connell JE, et al. Measuring visual symptoms in British cataract patients: the cataract symptom scale. Br J Ophthalmol 1999;83:519 –23.
19. Marmor DJ, Marmor MF. Simulating vision with and without macular disease. Arch Ophthalmol 2010;128:117–25. 20. McMullan M. Patients using the Internet to obtain health
information: how this affects the patient– health professional relationship. Patient Educ Couns 2006;63:24 – 8.
21. Juzych MS, Randhawa S, Shukairy A, et al. Functional health literacy in patients with glaucoma in urban settings. Arch Ophthalmol 2008;126:718 –24.
22. Friedman DS, Hahn SR, Gelb L, et al. Doctor-patient com-munication, health-related beliefs, and adherence in glaucoma: results from the Glaucoma Adherence and Persistency Study. Ophthalmology 2008;115:1320 –7.
23. Asaoka R, Crabb DP, Yamashita T, et al. Patients have two eyes! Binocular versus better eye visual field indices. Invest Ophthalmol Vis Sci 2011;52:7007–11.
24. Nelson P, Aspinall P, O’Brien C. Patients’ perception of visual impairment in glaucoma: a pilot study. Br J Ophthalmol 1999;83:546 –52.
25. Wagner N, Hassanein K, Head M. Computer use by older adults: a multi-disciplinary review. Comput Human Behav 2010;26:870 – 82.
Footnotes and Financial Disclosures
Originally received: July 29, 2012. Final revision: November 26, 2012. Accepted: November 27, 2012.
Available online: Manuscript no. 2012-1146.
1Department of Optometry and Visual Science, City University London,
London, United Kingdom.
2National Institute for Health Research Biomedical Research Centre,
Moorfields Eye Hospital NHS Foundation Trust and University College London Institute of Ophthalmology, London, United Kingdom. Financial Disclosure(s):
The author(s) have no proprietary or commercial interest in any materials discussed in this article.
Supported by a research grant from the International Glaucoma Asso-ciation. The sponsor had no role in the design or conduct of this research. Dr. Crabb’s research laboratory is funded in part by unre-stricted grants from Allergan, Inc., and the Investigator-Initiated Stud-ies Programme of Merck Sharp & Dohme, Ltd. Dr. Garway-Heath was supported by the National Institute for Health Research Biomedical Research Centre based at Moorfields Eye Hospital NHS Foundation Trust and University College London Institute of Ophthalmology.
Correspondence: