PREDETERMINATION PARTIAL DISCHARGE INCEPTION VOLTAGE IN
POWER CABLES USING ELECTRODE GAPS IN AIR UNDER AC
VOLTAGE
Faisal P. Mohamed, W H. Siew, Bojie Sheng, Brian G. Stewart, Euan A. Morris
Institute for Energy and Environment, University of Strathclyde, Glasgow, UK
Abstract
The breakdown of insulation in cables while in service can cause considerable damage to equipment and the accessories to which they are connected. PD in cables arises due to the overstressing of cable insulation resulting from electric field enhancement caused by imperfections in cable core and screen. The nature and magnitude of PD activity depends upon the type of defect, aging, environmental factors, applied voltage and cable loading. Reduction in system voltage can potentially reduce PD, which will correspondingly extend the service life of the cable. Currently, industry voltage statutory requirements permit ±6% tolerance setting on nominal voltage on distribution networks. This ±6% voltage reduction on may have little or an adverse effect on PD magnitude depending on the nature of defect present in the cable. Hence there is a clear requirement to pre-determine the PD inception voltage in cables through laboratory experiments to understand the significance of voltage reduction. This means to verify the effect of voltage reduction on extinguishing or minimizing PD activity in cables.
In this paper, range of voltages at which PD incepts termed as partial discharge inception voltage(PDIV) is measured using a test cell containing different types of electrode configuration having different spacing. PDIV measured using the test cell is verified by conducting partial discharge testing in paper insulated lead covered (PILC) and cross-linked poly ethylene(XLPE) cables. It has been found that PDIV measured using the test cell and cable are in good agreement.
I.
INRODUCTION
The majority of PILC cable installations in the United Kingdom are approaching the end of their design life which puts pressure on network owners on minimizing the number of faults by effective asset management. In cables, it has been understood that such failures may be related to the occurrence and severity of partial discharges[1-3]. PD activity in cables is caused by various defects, such as voids, protrusions from cable core conductor and semi-conductor screen (both conductor and dielectric). Another important factor that contributes to the PD phenomenon is that all cable insulation is manufactured with imperfections in both dielectric and metal[4].
The surface smoothness at interfaces between the insulation layer and semi-conductive shields is an
important factor to the long term electrical performance of power cables. The micro-protrusions from the semi-conductive shields can result in localized electrical stress and induce undesired treeing or electrical degradation[5]. The effects are more severe depending on the shape and size of the protrusion. Sharp protrusions can lead to extremely high electric stress concentrations and accelerating electrical aging. Figure 1 shows the intensity of electric stress enhancement as a function of size of protrusions. Apart from the cable design parameters, PD activity is influenced by applied voltage, nature of defect, cable aging and atmospheric conditions.
Figure 1. Stress enhancement factor in various cable
constructions[5]
Interdependence of PD and applied voltage may have the potential to minimize the PD magnitude through voltage reduction. Currently, a distribution network operator is permitted to have ±6% tolerance setting on nominal voltage on distribution networks. This ±6% voltage reduction may have little or an adverse effect on PD magnitude. In this paper, only the influence of system voltage on PD is considered. Hence it is a requirement to pre-determine the PD inception voltage in cables through laboratory experiments to understand the significance of voltage reduction.
[image:1.612.312.545.304.461.2]2
test cell is verified by conducting partial discharge testing on PILC and XLPE cable samples.
This paper is organized into five sections. Experiment setup is discussed in section II. In section III, PD testing using a standard test cell containing various electrode configurations is discussed. PD testing in cable samples is explained in section IV. Section V concludes the paper.
II.
EXPERIMENT SETUP
[image:2.612.367.493.160.330.2] [image:2.612.66.292.316.441.2] [image:2.612.57.274.469.636.2]A test setup based on IEC 60270 is used for PD testing is shown in
Figure 2. The same test setup is used for PD
testing in cables. In addition to that, a high frequency current transformer (HFCT) having a frequency response of 100kHz - 20MHz is clamped around the low voltage electrode. The HFCT output is connected to a digital storage oscilloscope to record PD pulses. A photograph containing the measurement setup is shown in Figure 3.
The necessary base-line PD measurement were conducted to make sure the test equipment is free from PD. The measurement system is calibrated for 5pC.
Figure 2. IEC60270 PD measurement test setup
Figure 3. IEC60270 PD measurement (David Tedford Laboratory,)
III.
PD TESTING USING STANDARD
ELECTRODE GAPS IN AIR
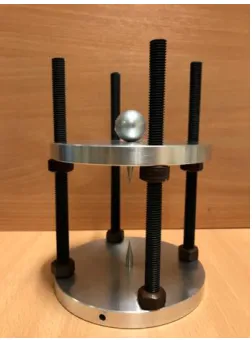
To predetermine the PDIV due to electrical field enhancement caused by protrusions in cable core and screen, a test cell containing various electrode configurations to represent the protrusions in cables is designed as shown in Figure 4.
Figure 4. Standard Test cell
Electrodes used are made of steel to avoid erosion at higher voltages. The dimensions of the electrode are given in Table 1.
Table 1 Electrode Specification
Sl No Electrode Dimensions
1 Pin Tip diameter: 0.4mm,0.6mm,0.8mm 2 Plane Height:10mm, diameter, 19mm, radius of
curvature, 3mm
3 Rod Height:27.5mm, radius of curvature, 2.5mm 4 Sphere diameter: 30mm
The test cell is energized using the IEC60270 measurement system discussed in section II. The input 50Hz voltage supply is gradually increased until PD appears. The test is repeated for different electrodes pairs with different spacing.
Figure 5. ɸ-q-n Plot(IEC60270), (Point-Plane, 11.7kV peak)
Figure 6. PDIV measurement, point-plane electrode gap
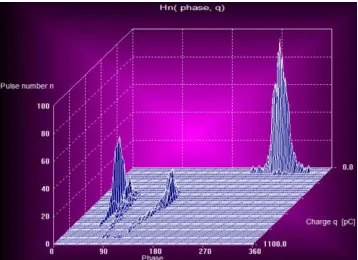
[image:3.612.331.520.65.222.2]The PD pattern ɸ-q-n plot of the point-point electrode (diameter: 4mm) gap at 13.63kV is shown in Figure 7. PDIV lies in the range of 8kV to 14.5kV as shown in Figure 8.
Figure 7. ɸ-q-n Plot (IEC60270) (Point-Point, 13.63kV peak).
Figure 8. PDIV measurement, point-point electrode gap
[image:3.612.71.274.199.370.2]The PD pattern ɸ-q-n plot of the point-rod electrode (diameter:4mm) gap at 8.4kV is shown in
Figure 9. PDIV lies in the range of 8kV to 13kV as shown
[image:3.612.306.508.308.452.2]in Figure 10.
[image:3.612.77.273.462.603.2]Figure 9. ɸ-q-n Plot (IEC60270), (Point-Rod, 8.4kV peak)
Figure 10. PDIV measurement, point-point electrode gap
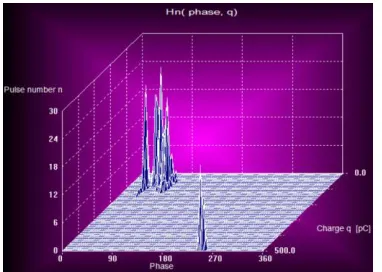
The PD pattern ɸ-q-n plot of the point-sphere electrode (diameter: 4mm) gap at 6.9kV is shown in Figure 11.
[image:3.612.323.520.492.646.2]4
[image:4.612.88.262.66.201.2]Figure 11. ɸ-q-n Plot (IEC60270) (Point-Sphere, 6.9kV peak).
Figure 12. PDIV measurement, point-sphere electrode gap
IV.
PD TESTING IN POWER CABLES
Paper insulated lead covered (PILC) cables were extensively laid in early 50s before the development of polymeric cables. These cables were comprised of oil impregnated paper strips wounded over the conductor. PILC cables can with stand higher level of PD for a long period compared to polymeric cables, including XLPE cables[6, 7].
In this experiment, PILC and XLPE cables were tested for PD using the IEC60270 measurement setup to verify the PDIV calculated using the test cell discussed before. Figure 13 shows the XLPE cable section for PDIV measurement. To prepare the sample free from corona, plasticine is applied wherever necessary.
[image:4.612.73.272.216.398.2]Figure 13. XLPE cable section for PD testing
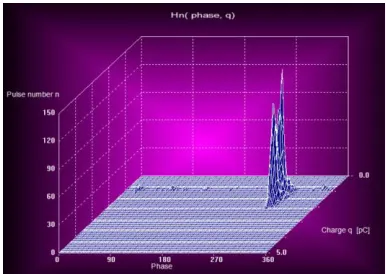
[image:4.612.328.518.254.391.2] [image:4.612.326.519.441.578.2]Figure 14 shows the ɸ-q-n plot of the XLPE cable section shown above which contains PD distribution incepted 6.5Kv peak. The ɸ-q-n plot of another XLPE cable section is shown in Figure 15 showing PDIV of 6.6 kV.
Figure 14. ɸqn Plot (IEC60270) (XLPE cable section -1, 6.5kV peak).
Figure 15. ɸ-q-n Plot (IEC60270) (XLPE cable section - 2, 6.6kV peak).
In XLPE cable section 1 (referring Figure 16), The distribution is symmetrical in both half cycles. In XLPE cable section - 2, PD distribution is symmetrical at higher
voltages as shown in
5pC was recorded during 1 minute intervals with a peak PD magnitude of 8pC.
Figure 17. ɸ-q-n Plot (IEC60270) (XLPE cable section - 2, 20 kV peak).
[image:5.612.81.269.316.458.2]Three core PILC cables decommissioned from site were used to measure the PDIV using IEC60270 measurement setup as shown in Figure 18.
Figure 18. PD testing of 3core PILC cable
The ɸ-q-n plot shown in Figure 19 is derived at PDIV of 7kV with average PD magnitude of 1560pC.
Figure 19. ɸ-q-n Plot (IEC60270) (PILC cable , 7kV peak)
V.
DISUSSION AND FURTHER WORK
A common cause of insulation degradation in high voltage (HV) cables is partial discharges (PD). Protrusions are one of the most critical types of imperfection, and affect primarily the semiconductor shields. Influence of such protrusions on PD activity may be severe depending on the shape and size of the protrusion. Voltage dependence of PD activity can be used to minimize PD magnitude by reducing the applied voltage. Currently, industry voltage statutory requirements permit ±6% tolerance on nominal voltage for distribution networks. Prior to applying voltage reduction, PD inception voltage in cables was predetermined through laboratory experiments using a test cell and power cables using IEC60270 setup. Based on the experiments from the test cell containing standard electrode geometry having various dimensions and spacing, PDIV lies in the range of 6kV to 15kV. PDIV measured using 33 kV PILC and XLPE cable sections lies within the range. This research shows that minimum voltage at which PD initiates in cables of around 6kV. Reducing 6% voltage from nominal 33kVcan minimize the PD activity caused by electrical field enhancement caused by protrusions. However, voltage reduction can increase the current flowing through the cable at constant load which will increase the temperature of the cable which in turn influence the PD activity. Furthermore, PD is also caused by voids in the insulation. Further work includes experimental investigation of temperature effect on PD activity during voltage reduction.VI.
ACKNOWLEDGEMENT
The authors wish to express sincere gratitude for funding support from EPSRC Hubnet, the Supergen Energy Networks Hub, under Grant EP/N030028/1.
VII.
REFERENCES
1. Faisal Peer Mohamed, W.H.S., John J. Soraghan, Scott Munro Strachan,Jamie McWilliam, The use of power frequency current transformers as partial discharge sensors for underground cables. IEEE Transactions on Dielectrics and Electrical Insulation, 2013. 20(3): p. 814 - 824.
2.Faisal Peer Mohamed, W.H.S., John J. Soraghan, Scott Munro Strachan,Jamie McWilliam, Remote monitoring of partial discharge data from insulated power cables. IET Science, Measurement and Technology, 2014.
3.Hunter, J.A., et al. Partial discharge diagnostics of defective medium voltage three-phase PILC cables. in
2012 IEEE International Symposium on Electrical Insulation. 2012.
[image:5.612.80.271.513.649.2]6
5.Suh Joon, H., A.M. Mendelsohn, and R. Ramachandran.
Overview of Semiconductive Shield Technology in Power Distribution Cables. in 2005/2006 IEEE/PES Transmission and Distribution Conference and Exhibition. 2006.
6.Hunter, J.A., et al. Partial discharge in medium voltage three-phase cables. in Electrical Insulation (ISEI), Conference Record of the 2010 IEEE International Symposium on. 2010.
![Figure 1. Stress enhancement factor in various cable constructions[5]](https://thumb-us.123doks.com/thumbv2/123dok_us/1480751.100707/1.612.312.545.304.461/figure-stress-enhancement-factor-various-cable-constructions.webp)